


 |
市场调查报告书
商品编码
1693724
电动货运自行车:市场占有率分析、产业趋势与统计、成长预测(2025-2030 年)E-cargo Bike - Market Share Analysis, Industry Trends & Statistics, Growth Forecasts (2025 - 2030) |
||||||
价格
※ 本网页内容可能与最新版本有所差异。详细情况请与我们联繫。
简介目录
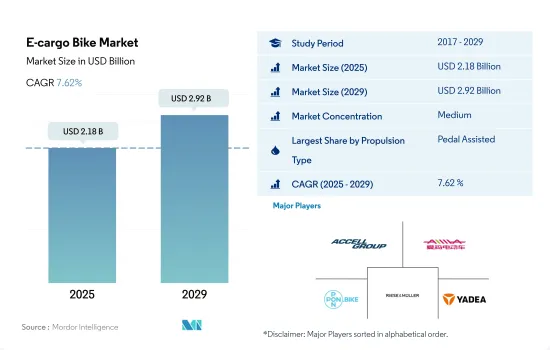
电动货运自行车市场规模预计在 2025 年为 21.8 亿美元,预计到 2029 年将达到 29.2 亿美元,预测期内(2025-2029 年)的复合年增长率为 7.62%。
推进系统细分市场概览
- 2017 年至 2023 年,电动货运自行车的销量将实现 17.16% 的复合年增长率,其中德国、英国、法国和美国等市场占据全球市场的很大份额。随着城市面临交通拥堵,造成噪音和空气污染,电动货运自行车和自行车物流领域正在成为首末班车配送、一般物流服务提供和家庭交通的一种便捷、永续、无拥堵和包容的替代方案。
- 北美是全球成长最快的电子商务市场,由于其脆弱的地理位置和广阔的城市景观,与其他地区相比,它面临着特殊的物流挑战。 2022年,墨西哥的电子商务市场规模达到了379.9亿美元。然而,墨西哥运输和物流公司Estafeta等公司在2017年底实施了“绿色配送”,在某些城市引入电动自行车进行最后一英里的配送。透过这些措施,预计未来几年电动货运自行车的使用量将会增加。
- 线上订单的成长正在推动最后一哩配送业务的成长。政府应该欢迎创新和变革,使未来减少依赖、更永续。中国、印度和日本等亚洲国家人口密度极高,因此电动货运自行车可望成为未来最实用、最环保的选择。
国家层级概述
- 预计预测期内全球电动货运自行车市场的复合年增长率将达到 7.73%。由于电动自行车具有健康益处、经济的交通选择和骑乘便利等优点,市场销售量正在激增。
- 在亚太地区,中国、日本和印尼在过去一段时间占据了总销量的很大份额。 2022年,中国占全球电动自行车市场90%以上的份额。然而,此后成长停滞,市场基本饱和。
- 在欧洲,电动自行车销售近年来快速成长,其中德国、比利时和荷兰的销售量最大。其背景是人们越来越偏好使用电动自行车进行交通、运动和休閒。此外,瑞典、比利时和法国对电动自行车的补贴和税收优惠预计将在预测期内进一步推动欧洲电动自行车市场的显着成长。
- 近年来,北美地区对低速自行车的偏好不断提升,电动自行车市场呈现成长态势。随着各共享单车营运商将更多电动自行车纳入其车队扩张的一部分,预计这将在不久的将来支持这些自行车的销售成长。
全球电动货运自行车市场趋势
全球电动自行车普及率的稳定成长反映了全球向永续、高效的个人行动解决方案的转变。
- 近年来,许多国家对电动自行车的需求不断增加。汽油价格上涨、交通高峰期拥挤以及运动对健康的益处正在推动英国和美国等多个国家采用电动自行车。欧洲是 2019 年电动机车销售的主要市场,其采用率高于其他地区。与 2018 年相比,2019 年对电动自行车的需求不断增长,加速了电动自行车的普及率。
- 新冠肺炎疫情在全球迅速蔓延,对自行车产业产生了正面影响。与其他交通方式相比,电动自行车是日常通勤和前往中东和北非其他地区最实用、最经济的解决方案之一,并且彻底改变了消费者的通勤方式。这鼓励了人们投资电动自行车,与 2019 年相比,2020 年全球电动自行车的普及率正在加速。
- 商业营运的恢復和停工等贸易限制的解除加速了世界各国对电动自行车的普及。进出口活动的改善是全球贸易壁垒消除的结果。根据估计和预测,在预测期内,电动自行车在全球许多国家的受欢迎程度预计将会增加,因为消费者对电动自行车的兴趣越来越大,因为它们具有骑行时锻炼、无燃料成本和清洁骑行等特点和优势。
全球超当地语系化配送市场正在经历显着成长,主要受美国和亚太地区(尤其是中国)的显着趋势所推动。
- 电动自行车在世界多个国家越来越受欢迎。过去五年来,由于网路购物的兴起,污染和交通拥堵显着增加。为了因应这种情况,网路购物选择更快、更环保的电动自行车送货方式。全球整体,亚太地区的电动自行车交付量最多,其次是北美。这些因素解释了为什么 2019 年全球使用电动自行车进行本地配送的数量与 2018 年相比有所增加。
- 为了扩大电动自行车市场,政府采取的回扣和补贴等措施也为全球电动自行车市场提供了支持。例如,在北美,政府提供价值 1,000 美元的奖励来鼓励人们选择电动自行车。这些因素推动了对电动自行车的需求,2021 年北美国家的电动自行车出货量与 2020 年相比成长了 19.70%。类似因素导致 2021 年全球电动自行车交付量与 2020 年相比增加。
- 由于电动机车相对于其他燃料驱动汽车具有成本优势,因此电动自行车业务在全球呈现爆炸性成长。由于电动自行车具有省时、省油、环保和降低维护成本等优点,企业正在投资电动自行车用于本地配送。由于上述因素,预计在预测期内,最后一哩本地配送中使用电动自行车的数量将会增加。
电动货运自行车产业概况
电动货运自行车市场适度整合,前五大公司占47.73%的市场。该市场的主要企业包括 Accell Group、Aima Technology Group、Pon Holding BV、Riese & Muller、Yadea Group Holdings Ltd 等。
其他福利
- Excel 格式的市场预测 (ME) 表
- 3个月的分析师支持
目录
第一章执行摘要和主要发现
第二章 报告要约
第三章 引言
- 研究假设和市场定义
- 研究范围
- 调查方法
第四章 产业主要趋势
- 自行车销量
- 人均GDP
- 通货膨胀率
- 电动自行车普及率
- 每天出游 5-15 公里的人口/通勤者百分比
- 自行车租赁
- 电动自行车电池价格
- 电池化学价格表
- 超本地化配送
- 自行车道
- 电池充电容量
- 交通拥堵指数
- 法律规范
- 价值炼和通路分析
第五章市场区隔
- 推进类型
- 踏板辅助
- 高速电动自行车
- 油门辅助
- 电池类型
- 铅酸电池
- 锂离子电池
- 其他的
- 地区
- 非洲
- 按国家
- 南非
- 非洲以外
- 亚太地区
- 按国家
- 澳洲
- 中国
- 印度
- 日本
- 纽西兰
- 韩国
- 其他亚太地区
- 欧洲
- 按国家
- 奥地利
- 比利时
- 丹麦
- 法国
- 德国
- 义大利
- 卢森堡
- 荷兰
- 挪威
- 波兰
- 西班牙
- 瑞典
- 瑞士
- 英国
- 其他欧洲国家
- 中东
- 按国家
- 沙乌地阿拉伯
- 阿拉伯聯合大公国
- 其他中东地区
- 北美洲
- 按国家
- 加拿大
- 墨西哥
- 美国
- 北美其他地区
- 南美洲
- 按国家
- 阿根廷
- 巴西
- 南美洲其他地区
- 非洲
第六章竞争格局
- 关键策略趋势
- 市场占有率分析
- 商业状况
- 公司简介
- Accell Group
- Aima Technology Group Co. Ltd
- Bakfiets.nl
- CUBE Bikes
- DOUZE Factory SAS
- Giant Manufacturing Co. Ltd.
- Jiangsu Xinri E-Vehicle Co. Ltd
- Jinhua Jobo Technology Co.
- Pedego Electric Bikes
- Pon Holding BV
- Rad Power Bikes
- Riese & Muller
- RYTLE GmbH
- Smart Urban Mobility BV
- Tern Bicycles
- The Cargo Bike Company
- Xtracycle Inc.
- XYZ CARGO
- Yadea Group Holdings Ltd
- YUBA BICYCLES LLC
第七章:CEO面临的关键策略问题
第 8 章 附录
- 世界概况
- 概述
- 五力分析框架
- 全球价值链分析
- 市场动态(DRO)
- 资讯来源及延伸阅读
- 图片列表
- 关键见解
- 数据包
- 词彙表
简介目录
Product Code: 93673
The E-cargo Bike Market size is estimated at 2.18 billion USD in 2025, and is expected to reach 2.92 billion USD by 2029, growing at a CAGR of 7.62% during the forecast period (2025-2029).
Propulsion Segment Market Overview
- Electric cargo bike sales recorded a CAGR of 17.16% between 2017 and 2023, with developed nations like Germany, the United Kingdom, France, and the United States accounting for a sizable percentage of the worldwide market. As cities struggle with traffic congestion that causes noise and air pollution, the electric cargo bike and bicycle logistic sectors are emerging as a useful, sustainable, non-congested, and inclusive alternative for first- and last-mile deliveries, general logistical service provision, and family vehicles.
- North America is the fastest-growing e-commerce market in the world and presents special logistics challenges compared to other regions due to its fraught geography and sprawling urban landscapes. The Mexican e-commerce market reached USD 37.99 billion in 2022. However, companies like Mexican transportation and logistics Estafeta implemented its "green deliveries" in late 2017, featuring e-bikes for last-mile deliveries in certain cities. Such steps are expected to increase the usage of the e-cargo bike in recent years.
- An increase in online orders is driving the growth of the last-mile delivery business. Governments should welcome technological innovation and change to reduce reliance and become more sustainable in the future. Because of the tremendously dense population in Asian countries such as China, India, and Japan, e-cargo bikes are expected to be the most practical and eco-friendly option in the future.
Country Level Overview
- The global e-cargo bike market is projected to witness a CAGR of 7.73% during the forecast period, mainly due to the increasing adoption of e-bikes as a daily mode of transportation globally. The market has witnessed an upsurge in the unit sales of e-bikes due to their beneficial characteristics, such as health benefits, economic mobility options, and convenience in riding.
- In Asia-Pacific China, Japan, and Indonesia accounted for a major share of the overall unit sales during the historical period. China held over 90% volume share in the global e-bike market in 2022. However, it has witnessed stagnant growth since, and the market is almost at a saturation point.
- In Europe, e-bike sales skyrocketed in recent years, with countries including Germany, Belgium, and the Netherlands selling major units of e-bikes. This is due to the growing preference for using e-bikes for transportation, sports, and leisure activities. Additionally, the subsidies and tax incentives programs on e-bikes in Sweden, Belgium, and France are anticipated to further support the significant growth of the European e-bike market during the forecast period.
- In North America, the e-bike market is emerging as the preference for using low-speed two-wheelers has grown in recent years. The increased inclusion of more e-bikes by various bike-sharing operators as part of their fleet expansion is expected to support the sales growth of these bikes in the near future.
Global E-cargo Bike Market Trends
The steady global increase in e-bike adoption rates reflects a worldwide shift toward sustainable and efficient personal mobility solutions
- There has been an increase in the demand for electric bicycles in many countries over the past several years. Increased gasoline costs, traffic congestion during rush hours, and the health advantages of exercise are driving the adoption of e-bikes in several countries, including the United Kingdom and the United States. With a greater adoption rate in 2019 compared to other regions, Europe was the primary market for the sales of electric bikes. The increasing demand for e-bikes accelerated the adoption rate in 2019 compared to 2018.
- The bicycle industry was favorably impacted by the rapid global expansion of COVID-19 cases. E-bikes are one of the most practical and affordable solutions for everyday commutes to work and other local locations compared to other means of transportation, which has revolutionized how consumers commute. This has encouraged people to invest in e-bikes, which accelerated their adoption rate in 2020 over 2019 in various countries worldwide.
- The return of commercial operations and the lifting of trade restrictions like lockouts have accelerated the adoption of e-bikes in numerous countries throughout the world. The improvement of import and export activities has been a result of the removal of trade obstacles globally. According to estimates, during the forecast period, the adoption rate of e-bikes will increase in a number of countries worldwide due to consumers' growing interest in them as a result of their features and advantages, such as the ability to exercise while riding, the lack of fuel costs, and cleaner rides.
The global Hyper-Local Delivery market is on a significant upward trend, driven mainly by substantial volumes in the US and Asia-Pacific, especially China
- E-bikes are becoming increasingly popular in several countries across the world. Due to increased online shopping, pollution and traffic congestion have increased significantly over the past five years. Due to these circumstances, online merchants are choosing the quicker and greener option of e-bike deliveries. Globally, Asia-Pacific recorded the highest number of e-bike deliveries, followed by North America. These factors account for the global increase in the use of e-bikes for local deliveries in 2019 over 2018.
- Focusing on e-bike market expansion, governments' efforts in the form of rebates and subsidies are also supporting the global e-bike market. For instance, in North America, the government provides incentives worth USD 1,000, encouraging people to choose e-bikes. These factors are driving the demand for e-bikes, which led to a 19.70% growth in e-bike deliveries in North American countries in 2021 over 2020. Similar factors drove global growth in e-bike delivery units in 2021 over 2020.
- The e-bike business is exploding in many nations across the world due to the cost advantages of electric bikes over other fuel-powered vehicles. Businesses are investing in e-bikes for local deliveries because of advantages like time efficiency, fuel efficiency, environmental friendliness, and lower maintenance costs. The use of e-bikes for last-mile local deliveries is anticipated to rise during the forecast period due to the aforementioned factors.
E-cargo Bike Industry Overview
The E-cargo Bike Market is moderately consolidated, with the top five companies occupying 47.73%. The major players in this market are Accell Group, Aima Technology Group Co. Ltd, Pon Holding B.V., Riese & Muller and Yadea Group Holdings Ltd (sorted alphabetically).
Additional Benefits:
- The market estimate (ME) sheet in Excel format
- 3 months of analyst support
TABLE OF CONTENTS
1 EXECUTIVE SUMMARY & KEY FINDINGS
2 REPORT OFFERS
3 INTRODUCTION
- 3.1 Study Assumptions & Market Definition
- 3.2 Scope of the Study
- 3.3 Research Methodology
4 KEY INDUSTRY TRENDS
- 4.1 Bicycle Sales
- 4.2 GDP Per Capita
- 4.3 Inflation Rate
- 4.4 Adoption Rate Of E-bikes
- 4.5 Percent Population/commuters With 5-15 Km Daily Travel Distance
- 4.6 Bicycle Rental
- 4.7 E-bike Battery Price
- 4.8 Price Chart Of Different Battery Chemistry
- 4.9 Hyper-local Delivery
- 4.10 Dedicated Bicycle Lanes
- 4.11 Battery Charging Capacity
- 4.12 Traffic Congestion Index
- 4.13 Regulatory Framework
- 4.14 Value Chain & Distribution Channel Analysis
5 MARKET SEGMENTATION (includes market size in Value in USD and Volume, Forecasts up to 2029 and analysis of growth prospects)
- 5.1 Propulsion Type
- 5.1.1 Pedal Assisted
- 5.1.2 Speed Pedelec
- 5.1.3 Throttle Assisted
- 5.2 Battery Type
- 5.2.1 Lead Acid Battery
- 5.2.2 Lithium-ion Battery
- 5.2.3 Others
- 5.3 Region
- 5.3.1 Africa
- 5.3.1.1 By Country
- 5.3.1.1.1 South Africa
- 5.3.1.1.2 Rest-of-Africa
- 5.3.2 Asia-Pacific
- 5.3.2.1 By Country
- 5.3.2.1.1 Australia
- 5.3.2.1.2 China
- 5.3.2.1.3 India
- 5.3.2.1.4 Japan
- 5.3.2.1.5 New Zealand
- 5.3.2.1.6 South Korea
- 5.3.2.1.7 Rest-of-APAC
- 5.3.3 Europe
- 5.3.3.1 By Country
- 5.3.3.1.1 Austria
- 5.3.3.1.2 Belgium
- 5.3.3.1.3 Denmark
- 5.3.3.1.4 France
- 5.3.3.1.5 Germany
- 5.3.3.1.6 Italy
- 5.3.3.1.7 Luxembourg
- 5.3.3.1.8 Netherlands
- 5.3.3.1.9 Norway
- 5.3.3.1.10 Poland
- 5.3.3.1.11 Spain
- 5.3.3.1.12 Sweden
- 5.3.3.1.13 Switzerland
- 5.3.3.1.14 UK
- 5.3.3.1.15 Rest-of-Europe
- 5.3.4 Middle East
- 5.3.4.1 By Country
- 5.3.4.1.1 Saudi Arabia
- 5.3.4.1.2 United Arab Emirates
- 5.3.4.1.3 Rest-of-Middle East
- 5.3.5 North America
- 5.3.5.1 By Country
- 5.3.5.1.1 Canada
- 5.3.5.1.2 Mexico
- 5.3.5.1.3 US
- 5.3.5.1.4 Rest-of-North America
- 5.3.6 South America
- 5.3.6.1 By Country
- 5.3.6.1.1 Argentina
- 5.3.6.1.2 Brazil
- 5.3.6.1.3 Rest-of-South America
- 5.3.1 Africa
6 COMPETITIVE LANDSCAPE
- 6.1 Key Strategic Moves
- 6.2 Market Share Analysis
- 6.3 Company Landscape
- 6.4 Company Profiles
- 6.4.1 Accell Group
- 6.4.2 Aima Technology Group Co. Ltd
- 6.4.3 Bakfiets.nl
- 6.4.4 CUBE Bikes
- 6.4.5 DOUZE Factory SAS
- 6.4.6 Giant Manufacturing Co. Ltd.
- 6.4.7 Jiangsu Xinri E-Vehicle Co. Ltd
- 6.4.8 Jinhua Jobo Technology Co.
- 6.4.9 Pedego Electric Bikes
- 6.4.10 Pon Holding B.V.
- 6.4.11 Rad Power Bikes
- 6.4.12 Riese & Muller
- 6.4.13 RYTLE GmbH
- 6.4.14 Smart Urban Mobility B.V
- 6.4.15 Tern Bicycles
- 6.4.16 The Cargo Bike Company
- 6.4.17 Xtracycle Inc.
- 6.4.18 XYZ CARGO
- 6.4.19 Yadea Group Holdings Ltd
- 6.4.20 YUBA BICYCLES LLC
7 KEY STRATEGIC QUESTIONS FOR E BIKES CEOS
8 APPENDIX
- 8.1 Global Overview
- 8.1.1 Overview
- 8.1.2 Porter's Five Forces Framework
- 8.1.3 Global Value Chain Analysis
- 8.1.4 Market Dynamics (DROs)
- 8.2 Sources & References
- 8.3 List of Tables & Figures
- 8.4 Primary Insights
- 8.5 Data Pack
- 8.6 Glossary of Terms
02-2729-4219
+886-2-2729-4219
 电动货运自行车市场-全球产业规模、份额、趋势、机会和预测,依产品类型、电池类型、最终用户、地区和竞争格局划分,2020-2030年预测
 电动货运自行车市场:依最终用户、类型、应用、负载容量、动力系统、电池类型、电压和分销管道划分-2025年至2032年全球预测
 全球电动货运自行车市场全球货运自行车市场
 2025年全球货运自行车市场报告
 电动货运自行车市场机会、成长动力、产业趋势分析及 2025 - 2034 年预测
 2032 年电动货运自行车市场预测:按产品类型、电池类型、推进类型、驱动类型、负载容量、最终用户和地区进行的全球分析
 电动货物摩托车的全球市场的评估:各产品类型,电池类别,用途类别,各地区,机会,预测(2018年~2032年)
 货运自行车市场:按类型、应用、燃料类型和地区划分2025年全球电动货运自行车市场报告
▼