


 |
市场调查报告书
商品编码
1693750
生物农药-市场占有率分析、产业趋势与统计、成长预测(2025-2030)Bioinsecticides - Market Share Analysis, Industry Trends & Statistics, Growth Forecasts (2025 - 2030) |
||||||
价格
※ 本网页内容可能与最新版本有所差异。详细情况请与我们联繫。
简介目录
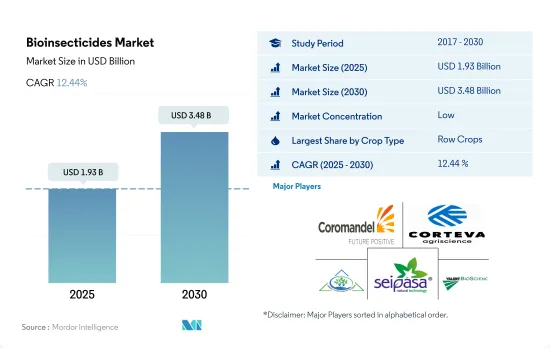
生物农药市场规模预计在 2025 年为 19.3 亿美元,预计到 2030 年将达到 34.8 亿美元,预测期内(2025-2030 年)的复合年增长率为 12.44%。
- 生物农药是从多种来源获得的天然物质,可有效控制害虫,同时对非目标生物安全,并且易于在污水处理厂和自然环境中降解。这些独特的特性使得生物农药越来越受到农民和消费者的欢迎。
- 生物农药市场以连续作物为主,占2022年全球市场价值的84.0%。大麦、玉米、小麦、油菜籽、黑麦、向日葵、大豆和水稻等主要连续作物是世界上种植最广泛的作物。紧随其后的是园艺作物,2022 年的市场占有率为 11.8%。
- 北美引领全球生物农药市场,2022 年市场占有率为 40.8%,其次是欧洲(33.2%)及亚太地区(17.5%)。向有机、生态学和永续农业实践的转变已获得全球支持,尤其註重减少因疫情而产生的化肥和农药的消耗。
- 农药行动网络 (PAN) 是一个由 600 多个非政府组织、机构和个人组成的全球网络,致力于推广对环境无害、对社会公正的危险农药替代品。透过其倡议和计划,PAN 提高了人们对农药有害影响的认识,并提倡采用生物农药作为更安全、更永续的替代方案。
- 由于其独特的特性和优势,加上消费者对无化学和有机农产品的偏好日益增长,全球生物农药市场预计在 2023 年至 2029 年期间的复合年增长率将达到 12.2%。
- 生物农药是利用真菌、细菌或植物抽取物等微生物来对抗危害作物生长发育的害虫的生物衍生农药。北美、欧洲和亚太地区主导全球生物农药市场。
- 2022年,北美地区将占全球生物农药市场的40.8%(以金额为准计算)。北美国家已经采取了一定的措施来增加有机农业。例如,在美国,美国有机农业转型计画和区域综合病虫害管理中心已经实施。加拿大已透过其害虫管理中心实施了禁止使用某些杀虫剂的禁令。在墨西哥,人们越来越反对使用化学杀虫剂。所有这些倡议都在推动该地区生物农药市场的发展。
- 欧洲是第二大生物农药市场。欧盟正大力推广有机农业,目标是2030年欧盟25%的农业用地采用有机耕作方式。作为该策略的一部分,所有成员国必须在2030年前将化学农药使用量减半。为此,各成员国都采取了各自的措施和措施,例如义大利对化学农药征收高额税。
- 亚太地区是生物农药第三大市场。中国和印度占据亚太生物农药市场的大部分份额。中国是全球最大的农药使用国,计画在2025年将园艺作物的农药使用量减少10%,水稻、小麦和玉米种植的农药使用量减少5%。预计在预测期内,全球农药禁令和有机农业的兴起将推动全球生物农药市场的发展。
生物农药市场的全球趋势
在北美和欧洲,由于人们意识的增强和政府的推动,有机生产达到了历史最高水准。
- 有机农业已成为永续粮食系统的主要贡献者,并在全球 187 个国家/地区实践。截至2021年,全球有机农地面积为7,230万公顷,2018年至2021年间各地区平均成长2.9%。有机耕地面积为1,440万公顷,占有机农地总面积的19.9%。
- 有机农业最强大的市场是北美和欧洲,这两个地区占世界有机耕地面积的41.0%。 2022年,欧洲将拥有650万公顷有机耕地,占全球有机耕地总面积的44.1%。北美和欧洲最重要的有机种植作物是苹果、草莓、谷物和橄榄。
- 亚太地区的新兴国家也加入了有机农业运动,并在生产和供应新鲜有机农产品方面实现自给自足,以满足国内需求。有机农业趋势在亚太地区日益兴起,2017年至2022年间,该地区有机土地面积将增加18.8%。该地区政府的主要措施也在有机农业扩张趋势中发挥了关键作用。例如,日本的《食品、农业和农村基本计画》的目标是到2030年将有机农民和有机农地的数量增加两倍。
- 有机农业的成长得益于人们对其益处的认识不断提高,例如促进土壤健康、减少环境影响和生产更健康的食品。
人均有机食品支出的成长主要出现在美国和德国,这是由消费者对更健康、更永续食品的需求所推动的。
- 过去几年,有机食品市场经历了显着成长,全球销售额预计将从 2012 年的 708 亿美元成长到 2020 年的 1,206 亿美元。有机食品的流行趋势受到多种因素的推动,包括消费者对更健康、更永续的食品选择的需求不断增长,以及对传统农业对环境影响的认识不断提高。预计未来几年全球有机食品市场将持续维持成长趋势。
- 根据有机贸易协会 2021 年的一项调查,当年有机水果和蔬菜的销售量成长了约 4.5%,占有机产品总销量的 15%。北美在有机产品平均支出方面占据市场主导地位,2021年美国的人均有机产品支出达到186.7美元,是北美国家中最高的。预计欧洲有机食品市场也将强劲成长,其中德国 2021 年人均有机食品支出最高,为 75.6 美元。
- 有机食品市场仍由消费者可支配收入较高的已开发国家主导,但预计新兴国家的有机食品市场也将成长。例如,亚太地区的工人阶级不断壮大,使得有机食品更容易取得且更便宜,这有助于扩大市场。
生物农药产业概况
生物农药市场细分化,前五大企业市占率合计为1.69%。该市场的主要企业包括 Coromandel International Ltd、Corteva Agriscience、IPL Biologicals Limited、Seipasa SA、Valent Biosciences LLC 等。
其他福利
- Excel 格式的市场预测 (ME) 表
- 3个月的分析师支持
目录
第一章执行摘要和主要发现
第二章 报告要约
第三章 引言
- 研究假设和市场定义
- 研究范围
- 调查方法
第四章 产业主要趋势
- 有机种植区
- 有机产品人均支出
- 法律规范
- 阿根廷
- 澳洲
- 巴西
- 加拿大
- 中国
- 埃及
- 法国
- 德国
- 印度
- 印尼
- 义大利
- 日本
- 墨西哥
- 荷兰
- 奈及利亚
- 菲律宾
- 俄罗斯
- 南非
- 西班牙
- 泰国
- 土耳其
- 英国
- 美国
- 越南
- 价值炼和通路分析
第五章市场区隔
- 作物类型
- 经济作物
- 园艺作物
- 耕地作物
- 地区
- 非洲
- 按国家
- 埃及
- 奈及利亚
- 南非
- 其他非洲国家
- 亚太地区
- 按国家
- 澳洲
- 中国
- 印度
- 印尼
- 日本
- 菲律宾
- 泰国
- 越南
- 其他亚太地区
- 欧洲
- 按国家
- 法国
- 德国
- 义大利
- 荷兰
- 俄罗斯
- 西班牙
- 土耳其
- 英国
- 其他欧洲国家
- 中东
- 按国家
- 伊朗
- 沙乌地阿拉伯
- 其他中东地区
- 北美洲
- 按国家
- 加拿大
- 墨西哥
- 美国
- 北美其他地区
- 南美洲
- 按国家
- 阿根廷
- 巴西
- 南美洲其他地区
- 非洲
第六章 竞争格局
- 关键策略趋势
- 市场占有率分析
- 商业状况
- 公司简介
- Andermatt Group AG
- Certis USA LLC
- Coromandel International Ltd
- Corteva Agriscience
- IPL Biologicals Limited
- Jaipur Bio Fertilizers
- Lallemand Inc.
- Seipasa SA
- T.Stanes and Company Limited
- Valent Biosciences LLC
第七章:CEO面临的关键策略问题
第 8 章 附录
- 世界概况
- 概述
- 五力分析框架
- 全球价值链分析
- 市场动态(DRO)
- 资讯来源及延伸阅读
- 图片列表
- 关键见解
- 数据包
- 词彙表
简介目录
Product Code: 500008
The Bioinsecticides Market size is estimated at 1.93 billion USD in 2025, and is expected to reach 3.48 billion USD by 2030, growing at a CAGR of 12.44% during the forecast period (2025-2030).
- Bioinsecticides are natural substances derived from various sources that effectively control insect pests while being safe for non-target organisms and easily degradable in sewage treatment plants and natural environments. These unique features make bioinsecticides an increasingly popular choice for farmers and consumers.
- The bioinsecticides market is dominated by row crops, which accounted for 84.0% of the global market value in 2022. Major row crops such as barley, corn, wheat, rapeseed, rye, sunflower, soybean, and rice are among the most widely farmed globally. Following closely behind are horticulture crops, which had a market share of 11.8% in 2022.
- North America leads the global bioinsecticides market, accounting for 40.8% of the market share in 2022, followed by Europe and Asia-Pacific, with market shares of 33.2% and 17.5%, respectively. The transition to organic agriculture through agroecological and sustainable agricultural practices gained traction globally, focusing on reducing fertilizers and pesticide consumption, particularly due to the pandemic.
- The Pesticide Action Network (PAN) is a global network of over 600 non-governmental organizations, institutions, and individuals working to promote environmentally sound and socially just alternatives to hazardous pesticides. Through its initiatives and programs, PAN is raising awareness about the negative effects of pesticides and driving the adoption of bioinsecticides as a safer and more sustainable alternative.
- With its unique features and benefits and growing consumer preference for chemical-free produce and organically grown food, bioinsecticides are set to experience growth in the global market, with an estimated CAGR of 12.2% between 2023 and 2029.
- Bioinsecticides are biologically-derived pesticides that use microorganisms such as fungi, bacteria, or even plant extracts to combat pest insects that disrupt crop growth and development. North America, Europe, and Asia-Pacific are dominating the global bioinsecticides market.
- The North American region accounted for 40.8%, by value, of the global bioinsecticides market in 2022. North American countries are establishing certain policies to increase organic farming. For instance, the United States implemented USDA's Organic Transition Initiative and a regional integrated pest management center. Canada implemented a ban on certain pesticides through pest management centers. In Mexico, there is growing opposition to the use of chemical pesticides. All these initiatives are driving the bioinsecticides market in the region.
- Europe is the second-largest market for bioinsecticides. The European Union is promoting organic farming by setting the target of achieving 25% of the region's agricultural land under organic farming by 2030. As part of the strategy, all member countries must reduce their use of chemical pesticides by half by 2030. Therefore all the member countries are implementing individual initiatives and policies, including imposing a high tax on chemical pesticides in Italy.
- Asia-Pacific is the third-largest market for bioinsecticides. China and India hold the major share of the Asia-Pacific bioinsecticides market. China, the world's largest pesticide user, intends to reduce pesticide use by 10% in horticultural crops and 5% in rice, wheat, and corn cultivation by 2025. Pesticide bans worldwide and increased organic farming are expected to drive the global bioinsecticides market during the forecast period.
Global Bioinsecticides Market Trends
Organic production is at an all-time high in North America and Europe, due to the increasing awareness and Government initiatives.
- Organic agriculture has emerged as a significant contributor to sustainable food systems, with 187 countries practicing it globally. As of 2021, there was 72.3 million ha of organic agricultural land worldwide, with an average increase of 2.9% across all regions from 2018 to 2021. Organic arable land accounted for 14.4 million ha, representing 19.9% of the total organic agricultural land.
- The strongest markets for organic farming are North America and Europe, accounting for 41.0% of the global organic arable land. In 2022, Europe had 6.5 million ha of organic arable land, equivalent to 44.1% of the overall organic arable agricultural area. The most significant crops grown organically in North America and Europe are apples, strawberries, cereals, and olives.
- Developing countries in Asia-Pacific are also joining the organic agriculture movement and becoming self-sufficient in producing and providing fresh organic produce to meet their domestic demand. The trend of organic farming is gaining momentum in Asia-Pacific, with the region recording an 18.8% increase in organic arable land from 2017 to 2022. The major initiatives by governments in the region also play a vital role in the growing trend of organic farming. For example, Japan's Basic Plan for Food, Agriculture, and Rural Areas aims to triple the number of organic farmers and lands by 2030.
- The growth of organic agriculture is driven by the rising awareness of the benefits of organic farming, such as promoting soil health, reducing environmental impacts, and producing healthier food.
Per capita spending of organic food majorly observed in United States and Germany, attributed to the consumer demand for healthier and sustainable food
- The organic food market experienced significant growth in the past few years, with global sales reaching USD 120.6 billion in 2020, up from USD 70.8 billion in 2012. The trend toward organic food is being driven by several factors, such as increasing consumer demand for healthier, more sustainable food options and a growing awareness of the environmental impact of conventional agriculture. The global organic food market is expected to continue its growth trend over the coming years.
- According to a survey conducted by the Organic Trade Association in 2021, sales of organic fruits and vegetables increased by around 4.5% in the same year, accounting for 15% of the overall organic sales. North America dominates the market in terms of average spending on organic products, with per capita spending in the United States reaching USD 186.7 in 2021, the highest among all North American countries. Europe is also expected to experience significant growth in the organic food market, with Germany accounting for the highest per capita spending of USD 75.6 in 2021.
- While the organic food market is still dominated by developed countries with high consumer disposable incomes, it is also expected to grow in developing nations. For example, the increasing number of working-class people in the Asia-Pacific region may contribute to the market's expansion due to the growing availability and affordability of organic food products.
Bioinsecticides Industry Overview
The Bioinsecticides Market is fragmented, with the top five companies occupying 1.69%. The major players in this market are Coromandel International Ltd, Corteva Agriscience, IPL Biologicals Limited, Seipasa SA and Valent Biosciences LLC (sorted alphabetically).
Additional Benefits:
- The market estimate (ME) sheet in Excel format
- 3 months of analyst support
TABLE OF CONTENTS
1 EXECUTIVE SUMMARY & KEY FINDINGS
2 REPORT OFFERS
3 INTRODUCTION
- 3.1 Study Assumptions & Market Definition
- 3.2 Scope of the Study
- 3.3 Research Methodology
4 KEY INDUSTRY TRENDS
- 4.1 Area Under Organic Cultivation
- 4.2 Per Capita Spending On Organic Products
- 4.3 Regulatory Framework
- 4.3.1 Argentina
- 4.3.2 Australia
- 4.3.3 Brazil
- 4.3.4 Canada
- 4.3.5 China
- 4.3.6 Egypt
- 4.3.7 France
- 4.3.8 Germany
- 4.3.9 India
- 4.3.10 Indonesia
- 4.3.11 Italy
- 4.3.12 Japan
- 4.3.13 Mexico
- 4.3.14 Netherlands
- 4.3.15 Nigeria
- 4.3.16 Philippines
- 4.3.17 Russia
- 4.3.18 South Africa
- 4.3.19 Spain
- 4.3.20 Thailand
- 4.3.21 Turkey
- 4.3.22 United Kingdom
- 4.3.23 United States
- 4.3.24 Vietnam
- 4.4 Value Chain & Distribution Channel Analysis
5 MARKET SEGMENTATION (includes market size in Value in USD and Volume, Forecasts up to 2030 and analysis of growth prospects)
- 5.1 Crop Type
- 5.1.1 Cash Crops
- 5.1.2 Horticultural Crops
- 5.1.3 Row Crops
- 5.2 Region
- 5.2.1 Africa
- 5.2.1.1 By Country
- 5.2.1.1.1 Egypt
- 5.2.1.1.2 Nigeria
- 5.2.1.1.3 South Africa
- 5.2.1.1.4 Rest of Africa
- 5.2.2 Asia-Pacific
- 5.2.2.1 By Country
- 5.2.2.1.1 Australia
- 5.2.2.1.2 China
- 5.2.2.1.3 India
- 5.2.2.1.4 Indonesia
- 5.2.2.1.5 Japan
- 5.2.2.1.6 Philippines
- 5.2.2.1.7 Thailand
- 5.2.2.1.8 Vietnam
- 5.2.2.1.9 Rest of Asia-Pacific
- 5.2.3 Europe
- 5.2.3.1 By Country
- 5.2.3.1.1 France
- 5.2.3.1.2 Germany
- 5.2.3.1.3 Italy
- 5.2.3.1.4 Netherlands
- 5.2.3.1.5 Russia
- 5.2.3.1.6 Spain
- 5.2.3.1.7 Turkey
- 5.2.3.1.8 United Kingdom
- 5.2.3.1.9 Rest of Europe
- 5.2.4 Middle East
- 5.2.4.1 By Country
- 5.2.4.1.1 Iran
- 5.2.4.1.2 Saudi Arabia
- 5.2.4.1.3 Rest of Middle East
- 5.2.5 North America
- 5.2.5.1 By Country
- 5.2.5.1.1 Canada
- 5.2.5.1.2 Mexico
- 5.2.5.1.3 United States
- 5.2.5.1.4 Rest of North America
- 5.2.6 South America
- 5.2.6.1 By Country
- 5.2.6.1.1 Argentina
- 5.2.6.1.2 Brazil
- 5.2.6.1.3 Rest of South America
- 5.2.1 Africa
6 COMPETITIVE LANDSCAPE
- 6.1 Key Strategic Moves
- 6.2 Market Share Analysis
- 6.3 Company Landscape
- 6.4 Company Profiles (includes Global Level Overview, Market Level Overview, Core Business Segments, Financials, Headcount, Key Information, Market Rank, Market Share, Products and Services, and Analysis of Recent Developments).
- 6.4.1 Andermatt Group AG
- 6.4.2 Certis U.S.A. LLC
- 6.4.3 Coromandel International Ltd
- 6.4.4 Corteva Agriscience
- 6.4.5 IPL Biologicals Limited
- 6.4.6 Jaipur Bio Fertilizers
- 6.4.7 Lallemand Inc.
- 6.4.8 Seipasa SA
- 6.4.9 T.Stanes and Company Limited
- 6.4.10 Valent Biosciences LLC
7 KEY STRATEGIC QUESTIONS FOR AGRICULTURAL BIOLOGICALS CEOS
8 APPENDIX
- 8.1 Global Overview
- 8.1.1 Overview
- 8.1.2 Porter's Five Forces Framework
- 8.1.3 Global Value Chain Analysis
- 8.1.4 Market Dynamics (DROs)
- 8.2 Sources & References
- 8.3 List of Tables & Figures
- 8.4 Primary Insights
- 8.5 Data Pack
- 8.6 Glossary of Terms
02-2729-4219
+886-2-2729-4219
 生物来源杀虫剂市场:按类型、製剂形式、施用方法、作物类型和分销管道划分-2026-2032年全球市场预测Chlorfenapyr技术市场按作物类型、製剂、应用方法和最终用户划分,全球预测,2026-2032年
 生物农药市场-2025年至2030年预测
 2032年生物农药市场预测:按来源、剂型、应用类型、作物类型、目标害虫、最终用户和地区进行的全球分析
 生物杀虫剂市场-全球产业规模、份额、趋势、机会及预测(按来源、应用、地区和竞争细分,2020-2030 年)
 生物农药市场规模、份额及成长分析(按来源、用途、配方、应用方法、最终用户和地区)-2025-2032 年产业预测