


 |
市场调查报告书
商品编码
1693756
北美农业生技药品:市场占有率分析、行业趋势和成长预测(2025-2030 年)North America Agricultural Biologicals - Market Share Analysis, Industry Trends & Statistics, Growth Forecasts (2025 - 2030) |
||||||
※ 本网页内容可能与最新版本有所差异。详细情况请与我们联繫。
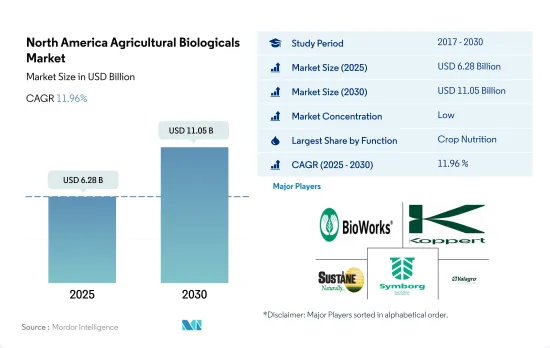
北美农业生技药品市场规模预计在 2025 年为 62.8 亿美元,预计到 2030 年将达到 110.5 亿美元,预测期内(2025-2030 年)的复合年增长率为 11.96%。
- 农业生技药品在北美永续农业中扮演重要角色。透过提供必需的营养物质和控制作物害虫和昆虫,这些产品减少了化学肥料和杀虫剂的使用。 2017年至2022年,该地区的农业生技药品市场成长了63.1%。
- 作物营养生技药品在生技药品市场占据主导地位,而在作物营养物质中,生物肥料将在 2022 年占据作物营养物质市场的主导地位。生物肥料是含有帮助植物生长的活微生物的有机物质。 2017-2021年期间,生物肥料市场规模成长约49.3%。以根瘤菌为基础的生物肥料将引领北美生物肥料产业,到2022年将占生物肥料市场规模的约36.5%。这主要是因为基于根瘤菌的生物肥料有潜力减少对无机氮肥的整体依赖。
- 作物保护以生物农药为主,占作物保护类别的94.1%。北美生物杀菌剂市场规模预计在2022年达到8.912亿美元,占同年市场占有率的46.9%,成为最受欢迎的生物农药类型。生物杀菌剂是喷洒在植物上以防止病原体真菌引起的疾病的物质。芽孢桿菌、木霉菌和假单胞菌是市面上使用最广泛的生物杀菌剂。
- 随着消费者越来越意识到合成化学肥料的不利影响,国内外对有机产品的需求都在成长。市场成长了 95.1%,2023 年至 2029 年的复合年增长率为 11.8%。
- 美国在北美生技药品市场占据主导地位,2022 年市场占有率为 55.5%。在美国,作物保护产品引领农业生技药品市场,价值 13.5 亿美元。生物农药是美国消费量最大的生物作物保护产品,到2022年将占作物保护产品的83.5%。
- 生物农药在生物农药领域占主导地位,用于控制病原真菌引起的植物疾病。生物杀菌剂要么来自微生物,要么植物来源。预计2022年这些生物杀菌剂的市场规模将达到6.509亿美元,成为同年消费量最大的生物农药类型,市场占有率为49.5%。
- 2022年加拿大占北美农业生技药品市场的28.8%,市场规模为12.7亿美元。 2022 年,该国作物保护领域的市场规模估计约为 4.751 亿美元。该国作物保护领域以生物农药为主,占当年作物保护市值的 95.2%。
- 就有机作物种植面积而言,墨西哥是北美第二大国。该国有机作物总面积预计将从 2017 年的 512,700 公顷增加到 2022 年的 541,500 公顷,到 2029 年底将增加 10.9%。有机作物种植面积增加的趋势将直接增加预测期内对生技药品的需求。
- 对永续和有机种植作物的需求不断增加以及过度使用化学肥料的不利影响是生技药品市场发展的驱动因素。此外,生技药品能够降低整体生产成本,进一步促进市场成长。
北美农业生技药品市场趋势
美国等主要国家对有机农产品的需求正在成长,政府的支持也有助于增加有机农产品的种植面积。
- 根据FibL统计的数据,2021年北美有机种植农作物的面积达到了150万公顷。该地区有机种植总面积在2017年至2021年间增加了13.5%。在北美国家中,美国占据主导地位,拥有62.3万公顷的有机农田,其中加州、缅因州和纽约州是实施有机种植的主要州。就国内生产而言,主要的有机农产品是苹果(31.1%)、草莓(9.5%)、柳橙(6.9%)、长叶莴苣(6.7%)和马铃薯(6.2%)。贸易方面,2021年进口最多的水果是香蕉(53.1%)、酪梨(7.7%)、芒果(5.8%)、蓝莓(5.0%)和南瓜(4.3%),出口最多的水果是苹果(80.0%)、梨(14.4%)、樱桃(4.0%)、干干(80.0%)、梨(14.4%)、樱桃(4.0%)、干洋葱(1.5%)和马铃薯(1.2%)。
- 2021年墨西哥有机农业面积为531,100公顷。墨西哥是世界20大有机食品生产国之一。此外,全国主要的有机食品生产州包括恰帕斯州、瓦哈卡州、米却肯州、奇瓦瓦州和格雷罗州,占全国有机种植面积的80.0%。全国有机农业协会等组织正在该国推广有机农业,预计将激励更多农民从事有机农业。
- 加拿大作物种植面积将从2017年的40万公顷增加到2021年的45万公顷。 2021年,这一数字将达到42万公顷,其中连作作物将占据最大面积。加拿大政府宣布,将于2021年向有机发展基金提供297,330美元,用于支持有机农民。这些努力有望增加该地区有机种植的面积。
国内外市场对有机农产品的需求不断增加,人均有机食品支出不断增加
- 2021年北美人均有机食品支出为108美元。在北美国家中,美国的人均支出最高,2021年平均支出为158美元。
- 疫情是有机食品消费增加的一个主要因素。根据有机农产品网路和类别合作伙伴的报告,2020年美国有机产品销售额成长了14.2%,相当于增加了10亿美元,达到85亿美元。
- 2021年,美国有机产品销售额超过630亿美元,与前一年同期比较成长2.0%。到 2021 年,有机水果和蔬菜将占有机产品总销售额的 15.0%,价值 210 亿美元。
- 根据加拿大有机联合会报告的数据,2020年加拿大有机食品销售额达81亿美元。加拿大是世界第六大有机产品市场,但其有机产品供应却无法满足需求。 2021年,人均有机食品支出为142.6美元。根据有机贸易协会数据显示,2021年墨西哥有机产品市场规模为6,300万美元,全球排名第35位,预计2021年至2026年复合年增长率为7.2%。然而,2021年墨西哥人均有机产品支出为0.49美元,低于该地区其他国家。随着越来越多的公司进入墨西哥市场,预计该国对有机产品的需求将会增加。
北美农业生技药品产业概况
北美农业生技药品市场细分化,前五大公司占0.75%的市占率。市场的主要企业包括 Bioworks Inc.、Koppert Biological Systems Inc.、Sustane Natural Fertilizer Inc.、Symborg Inc.、Valagro USA 等。
其他福利
- Excel 格式的市场预测 (ME) 表
- 3个月的分析师支持
目录
第一章执行摘要和主要发现
第二章 报告要约
第三章 引言
- 研究假设和市场定义
- 研究范围
- 调查方法
第四章 产业主要趋势
- 有机种植区
- 有机产品人均支出
- 法律规范
- 加拿大
- 墨西哥
- 美国
- 价值炼和通路分析
第五章市场区隔
- 功能
- 作物营养
- 生物肥料
- 固氮螺菌
- 固氮菌
- 菌根真菌
- 解磷细菌
- 根瘤菌
- 其他生物肥料
- 生物肥料
- 胺基酸
- 富里酸
- 腐植酸
- 蛋白质水解物
- 海藻萃取物
- 其他生物刺激素
- 有机肥
- 肥料
- 餐食基肥料
- 油饼
- 其他有机肥料
- 作物保护
- 生物防治剂
- 大型微生物
- 微生物
- 生物防治剂
- 生物真菌剂
- 生物除草剂
- 生物杀虫剂
- 其他生物防治剂
- 作物营养
- 作物类型
- 经济作物
- 园艺作物
- 耕地作物
- 原产地
- 加拿大
- 墨西哥
- 美国
- 北美其他地区
第六章 竞争格局
- 关键策略趋势
- 市场占有率分析
- 商业状况
- 公司简介
- Agriculture Solutions Inc.
- Andermatt Group AG
- BioFert Manufacturing Inc.
- BIOQUALITUM SA de CV
- Bioworks Inc.
- Koppert Biological Systems Inc.
- Lallemand Inc.
- Sustane Natural Fertilizer Inc.
- Symborg Inc.
- Valagro USA
第七章:CEO面临的关键策略问题
第 8 章 附录
- 世界概况
- 概述
- 五力分析框架
- 全球价值链分析
- 市场动态(DRO)
- 资讯来源及延伸阅读
- 图片列表
- 关键见解
- 数据包
- 词彙表
The North America Agricultural Biologicals Market size is estimated at 6.28 billion USD in 2025, and is expected to reach 11.05 billion USD by 2030, growing at a CAGR of 11.96% during the forecast period (2025-2030).
- Agricultural biologicals play an important role in sustainable agriculture in North America. By delivering necessary nutrients and managing pests and insects in crops, these products decrease the usage of chemical fertilizers and pesticides. The regional agricultural biologicals market grew by 63.1% between 2017 and 2022.
- Crop nutrition biologicals dominate the biologicals market, and among crop nutrients, biofertilizers dominated the crop nutrient segment in 2022. Biofertilizers are organic substances containing live microorganisms that help plants thrive. From 2017 to 2021, the biofertilizer market value rose by approximately 49.3%. Rhizobium-based biofertilizers lead the North American biofertilizer industry, accounting for approximately 36.5% of the biofertilizer market value in 2022. This is mostly owing to the potential of rhizobium-based biofertilizers to reduce overall reliance on inorganic nitrogen fertilizers.
- Crop protection is dominated by biopesticides, which account for 94.1% of the crop protection category. The market for biofungicides in North America was valued at USD 891.2 million in 2022, making them the most popular biopesticide type with a 46.9% market share in the same year. Biofungicides are substances that are applied to plants to prevent diseases caused by pathogenic fungi. Bacillus, Trichoderma, and Pseudomonas are the most widely available biofungicides on the market.
- The demand for organic products has grown both domestically and internationally as a result of consumers' growing awareness of the negative effects of synthetic fertilizers. The market grew by 95.1%, with a CAGR of 11.8% between 2023 and 2029.
- The United States dominated the North American biologicals market with a market share of 55.5% in 2022. Crop protection led the agricultural biologicals market in the United States and accounted for USD 1.35 billion. Biopesticides are the most consumed biological crop protection segment in the United States and accounted for 83.5% of the crop protection segment in 2022.
- Biofungicides dominate the biopesticide segment and are used to control plant diseases caused by pathogenic fungi. Biofungicides may be of microbial or botanical origin. The market for these biofungicides was valued at USD 650.9 million in 2022 and was the most consumed type of biopesticide, with a market share of 49.5% in the same year.
- Canada accounted for 28.8% of the North American agricultural biologicals market in 2022, with a market value of USD 1.27 billion. The crop protection segment in the country was valued at about USD 475.1 million in 2022. Biopesticides dominated the crop protection segment in the country, accounting for 95.2% of the crop protection market value in the same year.
- Mexico is the second-largest country in terms of organic crop area in the North American region. The total organic crop area in the country increased from 512.7 thousand hectares in 2017 to 541.5 thousand hectares in 2022 and is anticipated to increase by 10.9% by the end of 2029. This increasing trend in organic crop areas directly increases the demand for biologicals in the forecast period.
- The increasing demand for sustainable or organically cultivated crops and the adverse effects of the overuse of chemical fertilizers are factors driving the market for biologicals. Additionally, biologicals have the ability to reduce the overall cost of production, further contributing to market growth.
North America Agricultural Biologicals Market Trends
Organic produce demand grows in major countries like the United States, increasing cultivation area with government support
- According to the data provided by FibL statistics, the area under organic cultivation of crops in North America was 1.5 million hectares in 2021. The total organic area in the region increased by 13.5% between 2017 and 2021. Among the North American countries, the United States is dominant, with 623.0 thousand hectares of agricultural land under organic farming, with California, Maine, and New York being the major states practicing agriculture. Regarding domestic production, the main organic produce was apples (31.1%), strawberries (9.5%), oranges (6.9%), romaine lettuce (6.7%), and potatoes (6.2%). In the case of trade, the most imported products were bananas (53.1%), avocados (7.7%), mangoes (5.8%), blueberries (5.0%), and squash (4.3%), while the most exported were apples (80.0%), pears (14.4%), cherries (4.0%), dried onions (1.5%), and potatoes (0.2%) in 2021.
- Mexico had 531.1 thousand hectares of area under organic farming in 2021. Mexico is among the top 20 organic food producers in the world. Moreover, the major organic food-producing states in the country include Chiapas, Oaxaca, Michoacan, Chihuahua, and Guerrero, which account for 80.0% of the total organic area in the country. Organizations such as the National Association for Organic Agriculture are promoting organic agriculture in the country, which is expected to motivate more farmers to take up organic agriculture.
- Canada's area under organic crop cultivation increased from 400,000 hectares in 2017 to 450,000 hectares in 2021. Row crops occupied the maximum area, with 420,000 hectares in 2021. The Canadian government announced a sum of USD 297,330 in 2021 as an Organic Development Fund to support organic farmers. These initiatives are expected to increase the organic area in the region.
Growing demand for organic produce in domestic and international markets, rise in per capita spending on organic food
- The average per capita spending on organic food products in North America was recorded as USD 108.0 in 2021. Among the North American countries, the United States had the highest per capita spending, with an average spending of USD 158.0 in 2021.
- The pandemic has been a major factor in the increase of organic food consumption. In 2020, sales of organic products in the United States grew by 14.2%, which represented an increase of USD 1.0 billion, reaching a value of USD 8.50 billion, according to a report by Organic Produce Network and Category Partners.
- In 2021, organic product sales in the United States crossed USD 63.00 billion with a 2.0% increase over the previous year. Organic fruits and vegetables accounted for 15.0% of the total organic product sales with a value of USD 21.0 billion in 2021.
- According to data reported by the Organic Federation of Canada, organic food sales in Canada reached a value of USD 8.10 billion in 2020. Canada is the 6th largest market in the world for organic products, with the supply of organic products failing to keep up with the demand in the country. In 2021, the average spending on organic food per person was USD 142.6. In 2021, Mexico registered a market size of USD 63.0 million for organic products with a global rank of 35, and it is estimated to record a CAGR of 7.2% between 2021 and 2026, according to the Organic Trade Association. However, the per capita spending on organic products in the country is less compared to other countries in the region with a value of USD 0.49 in 2021. It is expected that more players entering the market in Mexico will increase the demand for organic products in the country.
North America Agricultural Biologicals Industry Overview
The North America Agricultural Biologicals Market is fragmented, with the top five companies occupying 0.75%. The major players in this market are Bioworks Inc., Koppert Biological Systems Inc., Sustane Natural Fertilizer Inc., Symborg Inc. and Valagro USA (sorted alphabetically).
Additional Benefits:
- The market estimate (ME) sheet in Excel format
- 3 months of analyst support
TABLE OF CONTENTS
1 EXECUTIVE SUMMARY & KEY FINDINGS
2 REPORT OFFERS
3 INTRODUCTION
- 3.1 Study Assumptions & Market Definition
- 3.2 Scope of the Study
- 3.3 Research Methodology
4 KEY INDUSTRY TRENDS
- 4.1 Area Under Organic Cultivation
- 4.2 Per Capita Spending On Organic Products
- 4.3 Regulatory Framework
- 4.3.1 Canada
- 4.3.2 Mexico
- 4.3.3 United States
- 4.4 Value Chain & Distribution Channel Analysis
5 MARKET SEGMENTATION (includes market size in Value in USD and Volume, Forecasts up to 2030 and analysis of growth prospects)
- 5.1 Function
- 5.1.1 Crop Nutrition
- 5.1.1.1 Biofertilizer
- 5.1.1.1.1 Azospirillum
- 5.1.1.1.2 Azotobacter
- 5.1.1.1.3 Mycorrhiza
- 5.1.1.1.4 Phosphate Solubilizing Bacteria
- 5.1.1.1.5 Rhizobium
- 5.1.1.1.6 Other Biofertilizer
- 5.1.1.2 Biostimulants
- 5.1.1.2.1 Amino Acids
- 5.1.1.2.2 Fulvic Acid
- 5.1.1.2.3 Humic Acid
- 5.1.1.2.4 Protein Hydrolysates
- 5.1.1.2.5 Seaweed Extracts
- 5.1.1.2.6 Other Biostimulants
- 5.1.1.3 Organic Fertilizer
- 5.1.1.3.1 Manure
- 5.1.1.3.2 Meal Based Fertilizers
- 5.1.1.3.3 Oilcakes
- 5.1.1.3.4 Other Organic Fertilizer
- 5.1.2 Crop Protection
- 5.1.2.1 Biocontrol Agents
- 5.1.2.1.1 Macrobials
- 5.1.2.1.2 Microbials
- 5.1.2.2 Biopesticides
- 5.1.2.2.1 Biofungicides
- 5.1.2.2.2 Bioherbicides
- 5.1.2.2.3 Bioinsecticides
- 5.1.2.2.4 Other Biopesticides
- 5.1.1 Crop Nutrition
- 5.2 Crop Type
- 5.2.1 Cash Crops
- 5.2.2 Horticultural Crops
- 5.2.3 Row Crops
- 5.3 Country
- 5.3.1 Canada
- 5.3.2 Mexico
- 5.3.3 United States
- 5.3.4 Rest of North America
6 COMPETITIVE LANDSCAPE
- 6.1 Key Strategic Moves
- 6.2 Market Share Analysis
- 6.3 Company Landscape
- 6.4 Company Profiles (includes Global Level Overview, Market Level Overview, Core Business Segments, Financials, Headcount, Key Information, Market Rank, Market Share, Products and Services, and Analysis of Recent Developments).
- 6.4.1 Agriculture Solutions Inc.
- 6.4.2 Andermatt Group AG
- 6.4.3 BioFert Manufacturing Inc.
- 6.4.4 BIOQUALITUM SA de CV
- 6.4.5 Bioworks Inc.
- 6.4.6 Koppert Biological Systems Inc.
- 6.4.7 Lallemand Inc.
- 6.4.8 Sustane Natural Fertilizer Inc.
- 6.4.9 Symborg Inc.
- 6.4.10 Valagro USA
7 KEY STRATEGIC QUESTIONS FOR AGRICULTURAL BIOLOGICALS CEOS
8 APPENDIX
- 8.1 Global Overview
- 8.1.1 Overview
- 8.1.2 Porter's Five Forces Framework
- 8.1.3 Global Value Chain Analysis
- 8.1.4 Market Dynamics (DROs)
- 8.2 Sources & References
- 8.3 List of Tables & Figures
- 8.4 Primary Insights
- 8.5 Data Pack
- 8.6 Glossary of Terms
 动物微生物组市场规模、份额和增长分析:按动物种类、产品类型、原材料、形态、应用、最终用户、通路和地区划分——2026-2033年行业预测
 农业生物製品:市场占有率分析、产业趋势与统计、成长预测(2026-2031)
 全球农业生技药品市场规模、份额、趋势和成长分析报告(2026-2034年)
 2026年全球农业生技药品市场报告
 生物合理作物保护市场依产品类型、作物类型、配方、作用机制、成分及应用方法划分-2026-2032年全球预测
 农业生技药品市场规模、份额和趋势分析报告:按作物类型、产品类型、应用方法、地区和细分市场预测(2026-2033 年)
 日本农业生物製品市场报告(按类型、来源、应用方式、应用领域和地区划分,2026-2034年)
 农业生技药品市场规模、份额和成长分析(按类型、来源、应用、作物类型和地区划分)-2026-2033年产业预测
 农业生技药品市场规模、份额和成长分析(按类型、来源、应用、作物类型和地区划分)-2026-2033年产业预测农业生技药品市场-2025-2030年预测