


 |
市场调查报告书
商品编码
1693768
亚太地区生物防治剂:市场占有率分析、产业趋势与统计、成长预测(2025-2030 年)Asia-Pacific Biopesticides - Market Share Analysis, Industry Trends & Statistics, Growth Forecasts (2025 - 2030) |
||||||
※ 本网页内容可能与最新版本有所差异。详细情况请与我们联繫。
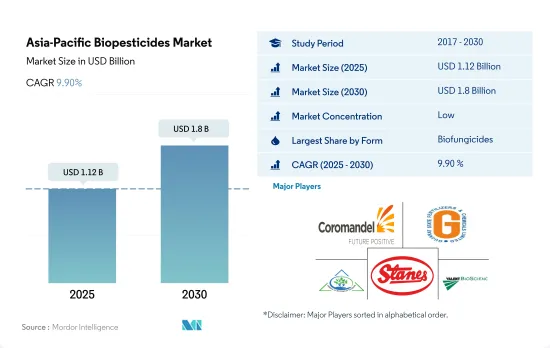
亚太生物农药市场规模预计在 2025 年为 11.2 亿美元,预计到 2030 年将达到 18 亿美元,预测期内(2025-2030 年)的复合年增长率为 9.90%。
- 生物农药是源自动物、植物、昆虫或微生物(包括细菌和真菌)的天然物质或药剂。这些用于控制农业害虫和感染疾病。 2022 年亚太地区生物农药市场价值为 8.542 亿美元。
- 生物杀菌剂是该地区最常用的生物防治剂。 2022年的市场占有率为36.8%。芽孢桿菌、木霉、链霉菌和假单胞菌是农业中商业性使用的微生物种类。这些生物杀菌剂可有效对抗腐霉菌、立枯丝核菌、镰刀菌、核盘菌、串珠霉菌、灰霉病和白粉病等病原体。
- 在生物农药中,细菌杀虫剂苏力菌在农业的应用最为广泛,因为它可以在孢子形成阶段产生蛋白质来控制害虫。苏力菌可有效控制影响多种作物的鳞翅目害虫。
- 萤光假单胞菌和野油菜黄单胞菌分别是一种真菌和一种细菌,它们作为生物除草剂在该地区的商业性价值日益凸显。这些真菌释放的细胞外肽和脂多醣抑制杂草生长。已知野油菜黄单胞菌能有效控制马唐。
- 对农业生物胁迫管理的可持续方法的需求是该地区使用生物农药的潜在驱动力。
- 在亚太地区,中国和印度等国家引领市场,向永续农业的转型特别显着。中国目前是该地区最大的生物农药消费国,2022 年的市占率将达到 29.1%。
- 为了回应人们对土壤污染、食品污染和化学残留日益增长的担忧,中国政府采取了积极措施,推广使用有机投入品。这些努力包括承担有机认证采集费用、资助农场基础设施和有机肥料、培训、行销援助和土地征用援助。中高所得群体推动了有机食品需求的不断增长。
- 然而,印度拥有世界上最多的有机农民和第五大有机农地面积。 2021-2022年,印度生产了超过340万吨的有机认证产品,其中包括各种食品。有机农业实践的广泛采用预计将推动该地区生物农药市场的发展。
- 生物农药市场的主要驱动力之一是抗除草剂杂草(如 L. rigidum、R. raphanustrum、Bromus spp. 和 Hordeum spp.)的发展。这些杂草已经对传统的化学除草剂产生了抗药性,这些除草剂透过抑制ACCase或ALS来杀死杂草,因此很难控制。这为农民采用生物除草剂等其他替代方案创造了机会,从而推动了亚太地区生物农药市场的发展。预计 2023 年至 2029 年期间市场复合年增长率将达到 9.8%。
亚太生物农药市场趋势
中国、印度、印尼和澳洲等国政府的支持日益增强,有助于推动该地区的有机农业
- 根据FiBL统计,2021年亚太地区有机农地面积将超过370万公顷,占全球有机农地面积的26.4%。 2017年至2022年,有机种植面积将增加19.3%。截至 2020 年,该地区共有约 180 万名有机生产者,其中印度以 130 万位居榜首。中国、印度、印尼和澳洲是该地区有机种植面积最大的国家。中国和印度等国家的政府部门正在不断推广有机农业,以减少作物种植对化学物质的依赖。例如,印度实施了「Paramparagat Krishi Vikas Yojana」和「全印度有机农业网路计画」(AI-NPOF)等计画。
- 2021年,中国以250万公顷的面积占最大份额,为66.1%,其次是印度,为19.3%,印尼,为1.5%,澳大利亚,为1.4%。所有有机农地分为三种作物类型:连续作物、园艺作物和经济作物。连作作物占该地区有机土地的最大份额,2021 年为 67.5%,即 250 万公顷。该地区种植的主要连作作物包括水稻、小麦、豆类、大豆和小米。
- 经济作物将占第二大份额,到2021年将达到70万公顷,占有机农地的18.5%。全球对糖和有机茶等有机经济作物的需求正在增加。中国和印度分别是有机绿茶和有机红茶的最大生产国。由于国际需求不断增长,该地区有机种植面积预计会增加。
澳洲人均有机产品支出最高,而中国有机食品市场成长迅速
- 2021 年该地区人均有机产品支出为 85.1 美元。同年,澳洲人均有机产品支出较高,为 58.3 美元,主要是由于消费者认为有机食品更健康,导致需求增加。根据全球有机贸易的数据,2021 年澳洲有机包装食品和饮料市场价值 8.852 亿美元。
- 2021年,中国有机食品市场成长了13.3%,预计这种正面的成长模式将持续下去,2023年至2029年的复合年增长率估计为7.1%。随着年轻一代越来越重视有机产品,以及由于职业母亲数量的增加和健康保健趋势的日益普及导致对有机婴儿食品的需求不断增长,预计到2025年有机市场的价值将达到64亿美元。
- 印度的有机产品远远落后于全球需求的 1.0%,2021 年的人均支出仅 0.08 美元。然而,印度预计在未来几年成为一个充满希望的市场,到 2025 年将达到 1.533 亿美元。目前,该地区的有机市场高度分散,有机产品仅在少数超级市场和专卖店有售。消费者知识和购买意愿的提高将有助于更好地了解该地区有机食品的永续性属性。人均收入的增加,加上消费者对消费有机食品重要性的认识不断提高,有可能增加亚太地区人均有机食品支出。
亚太生物农药产业概况
亚太生物农药市场细分化,前五大公司占3.31%。该市场的主要企业有 Coromandel International Ltd、Gujarat State Fertilizers & Chemicals Ltd、IPL Biologicals Limited、T.Stanes, Company Limited、Valent Biosciences LLC 等。
其他福利
- Excel 格式的市场预测 (ME) 表
- 3个月的分析师支持
目录
第一章执行摘要和主要发现
第二章 报告要约
第三章 引言
- 研究假设和市场定义
- 研究范围
- 调查方法
第四章 产业主要趋势
- 有机种植区
- 有机产品人均支出
- 法律规范
- 澳洲
- 中国
- 印度
- 印尼
- 日本
- 菲律宾
- 泰国
- 越南
- 价值炼和通路分析
第五章市场区隔
- 形式
- 生物真菌剂
- 生物除草剂
- 生物杀虫剂
- 其他生物防治剂
- 作物类型
- 经济作物
- 园艺作物
- 耕地作物
- 原产地
- 澳洲
- 中国
- 印度
- 印尼
- 日本
- 菲律宾
- 泰国
- 越南
- 其他亚太地区
第六章竞争格局
- 关键策略趋势
- 市场占有率分析
- 商业状况
- 公司简介
- Andermatt Group AG
- Biobest Group NV
- Biolchim SPA
- Coromandel International Ltd
- Gujarat State Fertilizers & Chemicals Ltd
- Henan Jiyuan Baiyun Industry Co. Ltd
- IPL Biologicals Limited
- Koppert Biological Systems Inc.
- T.Stanes and Company Limited
- Valent Biosciences LLC
第七章 CEO 的关键策略问题
第 8 章 附录
- 世界概况
- 概述
- 五力分析框架
- 全球价值链分析
- 市场动态(DRO)
- 资讯来源及延伸阅读
- 图片列表
- 关键见解
- 数据包
- 词彙表
The Asia-Pacific Biopesticides Market size is estimated at 1.12 billion USD in 2025, and is expected to reach 1.8 billion USD by 2030, growing at a CAGR of 9.90% during the forecast period (2025-2030).
- Biopesticides are naturally occurring substances or agents derived from animals, plants, insects, and microorganisms, including bacteria and fungi. They are used to manage agricultural pests and infections. The market for biopesticides in the Asia-Pacific region was valued at USD 854.2 million in 2022.
- Biofungicides are the most popular biopesticides used in the region. They held a market share of 36.8% in 2022. Bacillus, Trichoderma, Streptomyces, and Pseudomonas are the most commercially used species of microorganisms in agriculture. These biofungicides effectively act against pathogens, such as Pythium, Rhizoctonia, Fusarium, Sclerotinia, Thielaviopsis, Botrytis, and powdery mildew.
- Among bioinsecticides, the bacterial insecticide Bacillus thuringiensis is most predominantly used in agriculture due to its immense potential to control pests by producing proteins during the sporulation phase. Bacillus thuringiensis is effective in managing lepidopteran species that affect a wide range of crop types.
- Pseudomonas fluorescens and Xanthomonas campestris are fungi and bacteria, respectively, gaining commercial importance as bioherbicides in the region. The extracellular peptides and a lipopolysaccharide released from these organisms inhibit the growth of weeds. Xanthomonas campestris is known to control horseweed effectively.
- The need for sustainable approaches in managing biotic stresses in agriculture is the potential driver for biopesticide usage in the region.
- The Asia-Pacific region is witnessing a significant shift toward sustainable agriculture practices, with countries like China and India leading the market. China is currently the largest consumer of biopesticides in the region, and it accounted for a 29.1% share in 2022.
- In response to rising concerns over soil contamination, pollution, and chemical residues in food, the Chinese government is taking proactive measures to promote the usage of organic inputs. These initiatives include bearing the cost of organic certification, providing funding for on-farm infrastructure and organic fertilizers, training, marketing assistance, and assisting with land acquisition. Middle and higher-income families are driving this growing demand for organically-grown food.
- However, India has the world's highest number of organic growers, and it is the fifth-largest country in terms of organic agricultural land area. During 2021-2022, India produced over 3.4 million metric tons of certified organic products, including a wide range of food products. This high adoption of organic farming practices is expected to drive the biopesticides market in the region.
- One key driver of the biopesticides market is the development of herbicide-resistant weeds such as L. rigidum, R. raphanustrum, Bromus spp., and Hordeum spp. These weeds have developed resistance against traditional chemical herbicides that kill the weeds by ACCase- and ALS-inhibition, making control difficult. This presents an opportunity for farmers to adopt other alternatives like bioherbicides, thus driving the Asia-Pacific biopesticides market. The market is estimated to record a CAGR of 9.8% between 2023 and 2029.
Asia-Pacific Biopesticides Market Trends
Growing Government support in countries like China, India, Indonesia, and Australia, boosts organic farming in the region
- The organic agricultural area in the Asia-Pacific region was over 3.7 million hectares in 2021, representing 26.4% of the global organic area, as per FiBL statistics. The organic area under cultivation grew by 19.3% between 2017 and 2022. As of 2020, the region recorded around 1.8 million organic producers, with India topping the list with 1.3 million organic producers. China, India, Indonesia, and Australia are the major countries with large organic cultivation areas in the region. Government authorities in countries like China and India are constantly promoting organic agriculture to reduce reliance on chemical inputs for crop cultivation. For instance, India has implemented schemes like Paramparagat Krishi Vikas Yojana and the All India Network Programme on Organic Farming (AI-NPOF).
- In 2021, China accounted for a maximum share of 66.1%, with 2.5 million ha, followed by India, Indonesia, and Australia, with 19.3%, 1.5%, and 1.4%, respectively. The total organic land is divided into three crop types, namely row crops, horticultural crops, and cash crops. Row crops occupy a major share of organic agricultural land in the region, accounting for 67.5% share, i.e., 2.5 million ha in 2021. The major row crops grown in the region include paddy, wheat, pulses, soybeans, and millets.
- Cash crops held the second largest share, with 0.7 million ha in 2021, accounting for an 18.5% share of organic cropland. The demand for organic cash crops like sugar and organic tea is increasing worldwide. China and India are the largest organic green and black tea producers, respectively. The growing international demand is expected to increase the organic acreages in the region.
Per capita spending on organic product predominant in Australia and China's organic food market growing significantly
- The per capita spending on organic products in the region was recorded at USD 85.1 in 2021. Australia witnessed a higher per capita spending on organic products, with USD 58.3 in the same year, attributed to the higher demand due to consumers' perception of organic food as healthy. As per the Global Organic Trade data, Australia's organic packaged food and beverage market was valued at USD 885.2 million in 2021.
- China's organic food market grew by 13.3% in 2021, and the positive growth pattern is expected to continue, with an estimated CAGR of 7.1% between 2023 and 2029. With an increasing emphasis on the importance of organic products among the younger generation and a rise in demand for organic baby food due to the growing number of mothers in the workforce and the increasing adoption of the health and wellness trend, organic products are expected to reach a value of USD 6.4 billion by 2025.
- Organic products in India represent far less than 1.0% of global demand, with a per capita expenditure of just USD 0.08 in 2021. However, India represents a promising market over the coming years, reaching a value of USD 153.3 million by 2025. Currently, the market for organic goods in the region is very fragmented, with just a few supermarkets and specialty stores selling them, as only people from higher-income families are potential customers. Growing consumer knowledge and buying motivations will lead to a better understanding of the sustainability qualities of organic food in the region. Increasing per capita income, along with increased consumer awareness of the importance of organic food intake, has the potential to raise per capita expenditure on organic food items in the Asia-Pacific region.
Asia-Pacific Biopesticides Industry Overview
The Asia-Pacific Biopesticides Market is fragmented, with the top five companies occupying 3.31%. The major players in this market are Coromandel International Ltd, Gujarat State Fertilizers & Chemicals Ltd, IPL Biologicals Limited, T.Stanes and Company Limited and Valent Biosciences LLC (sorted alphabetically).
Additional Benefits:
- The market estimate (ME) sheet in Excel format
- 3 months of analyst support
TABLE OF CONTENTS
1 EXECUTIVE SUMMARY & KEY FINDINGS
2 REPORT OFFERS
3 INTRODUCTION
- 3.1 Study Assumptions & Market Definition
- 3.2 Scope of the Study
- 3.3 Research Methodology
4 KEY INDUSTRY TRENDS
- 4.1 Area Under Organic Cultivation
- 4.2 Per Capita Spending On Organic Products
- 4.3 Regulatory Framework
- 4.3.1 Australia
- 4.3.2 China
- 4.3.3 India
- 4.3.4 Indonesia
- 4.3.5 Japan
- 4.3.6 Philippines
- 4.3.7 Thailand
- 4.3.8 Vietnam
- 4.4 Value Chain & Distribution Channel Analysis
5 MARKET SEGMENTATION (includes market size in Value in USD and Volume, Forecasts up to 2030 and analysis of growth prospects)
- 5.1 Form
- 5.1.1 Biofungicides
- 5.1.2 Bioherbicides
- 5.1.3 Bioinsecticides
- 5.1.4 Other Biopesticides
- 5.2 Crop Type
- 5.2.1 Cash Crops
- 5.2.2 Horticultural Crops
- 5.2.3 Row Crops
- 5.3 Country
- 5.3.1 Australia
- 5.3.2 China
- 5.3.3 India
- 5.3.4 Indonesia
- 5.3.5 Japan
- 5.3.6 Philippines
- 5.3.7 Thailand
- 5.3.8 Vietnam
- 5.3.9 Rest of Asia-Pacific
6 COMPETITIVE LANDSCAPE
- 6.1 Key Strategic Moves
- 6.2 Market Share Analysis
- 6.3 Company Landscape
- 6.4 Company Profiles (includes Global Level Overview, Market Level Overview, Core Business Segments, Financials, Headcount, Key Information, Market Rank, Market Share, Products and Services, and Analysis of Recent Developments).
- 6.4.1 Andermatt Group AG
- 6.4.2 Biobest Group NV
- 6.4.3 Biolchim SPA
- 6.4.4 Coromandel International Ltd
- 6.4.5 Gujarat State Fertilizers & Chemicals Ltd
- 6.4.6 Henan Jiyuan Baiyun Industry Co. Ltd
- 6.4.7 IPL Biologicals Limited
- 6.4.8 Koppert Biological Systems Inc.
- 6.4.9 T.Stanes and Company Limited
- 6.4.10 Valent Biosciences LLC
7 KEY STRATEGIC QUESTIONS FOR AGRICULTURAL BIOLOGICALS CEOS
8 APPENDIX
- 8.1 Global Overview
- 8.1.1 Overview
- 8.1.2 Porter's Five Forces Framework
- 8.1.3 Global Value Chain Analysis
- 8.1.4 Market Dynamics (DROs)
- 8.2 Sources & References
- 8.3 List of Tables & Figures
- 8.4 Primary Insights
- 8.5 Data Pack
- 8.6 Glossary of Terms
 生物杀线虫剂市场规模、份额和成长分析(按类型、剂型、应用方式、作物类型、虫害类型和地区划分)-产业预测,2025-2032年
 全球生物肥料和生物农药市场:预测至2032年-按产品类型、形态、应用方法、作物类型和地区分類的分析
 生物农药市场(按类型、作物、剂型、应用和销售管道)——2025-2030 年全球预测
 2025-2033年生物农药市场报告(依产品、剂型、来源、应用方式、作物种类及地区)
 2025年全球生物农药市场报告
 生物农药市场:2025 年至 2030 年预测
 细菌生物防治剂:市场占有率分析、产业趋势、统计数据、成长预测(2025-2030 年)2032年生物农药市场预测:按产品类型、作物类型、剂型、应用、最终用户和地区进行的全球分析日本生物农药市场报告(依产品类型(生物除草剂、生物杀虫剂、生物杀菌剂等)、应用领域(作物型、非作物型)及地区划分)2025-2033
 生物农药市场规模、份额及成长分析(按类型、来源、剂型、应用类型、作物类型和地区)-2025-2032 年产业预测