


 |
市场调查报告书
商品编码
1693770
印度生物刺激素:市场占有率分析、行业趋势和统计数据、成长预测(2025-2030 年)India Biostimulants - Market Share Analysis, Industry Trends & Statistics, Growth Forecasts (2025 - 2030) |
||||||
※ 本网页内容可能与最新版本有所差异。详细情况请与我们联繫。
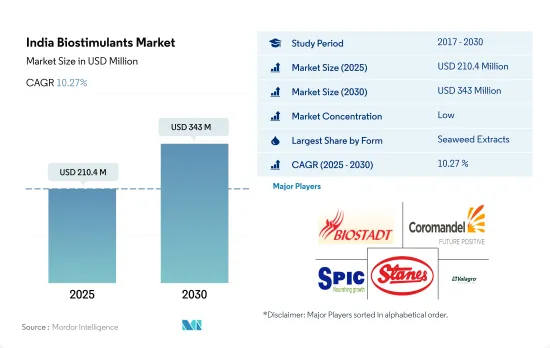
印度生物刺激素市场规模预计在 2025 年为 2.104 亿美元,预计到 2030 年将达到 3.43 亿美元,预测期内(2025-2030 年)的复合年增长率为 10.27%。
- 印度生物刺激素市场拥有大量的生物刺激素作为活性成分,例如腐殖酸、富里酸、胺基酸、蛋白质水解物、海藻萃取物、几丁聚醣、生物聚合物和其他植物和动物来源的生物刺激素。 2022 年印度生物刺激素市场价值为 1.532 亿美元,2017-2022 年期间成长率为 15.7%。
- 海藻萃取物生物刺激素在印度生物刺激素市场中占有最大的市场占有率,2022 年占 37.4%,2022 年市场规模为 5,730 万美元。这是因为它们能够提高抗逆性、根系生长、养分和水分吸收、植物生长、作物产量以及改善植物整体健康状况。
- 到2022年,连续作物将占生物刺激素市场价值的86.2%。这是因为到2022年,连续作物将占全国有机作物总面积的82.3%左右。到2022年,经济作物和园艺作物将分别占生物刺激素市场的11.2%和2.6%。
- 随着对有机食品的需求不断增加,印度政府正在透过各种计划推动有机作物、水果和蔬菜的生产,如国家园艺计划、东北和喜马拉雅园艺计划、Rashtriya Krishi Vikas Yojana、国家土壤健康和肥力管理计划、国家有机农业计划、印度农业研究理事会有机作物网络项目和 Paramparaghat Krishi Vikas Yojana。这些措施有望促进印度生物刺激素市场的发展。
- 预计 2023 年至 2029 年期间印度生物刺激素市场规模将成长 81.2%,复合年增长率为 10.4%。
印度生物刺激素市场趋势
由于有机种植者的增加,主要用于连续作物的有机种植面积增加。
- 印度是世界上经过认证的有机生产者总数最多的国家,2019 年拥有 130 万名有机生产者。儘管有机生产者数量众多,但该国有机种植面积仅占该国农业总面积的 2.0% 左右。 2021年,该国有机种植面积为711,094.0公顷,比2017年增加约3.4%。该国的有机农业集中在几个邦。全国排名前 10 名的有机作物州约占有机作物总面积的 80.0%。中央邦、拉贾斯坦邦和马哈拉斯特拉邦等几个邦在扩大有机农业覆盖率方面处于领先地位。光是中央邦一地,2019 年有机种植面积就占印度全国的 27.0%。
- 该国以连续作物有机种植为主,2021 年有机作物连续种植面积约占全国有机作物种植总面积的 59.7%。粮食生产以稻米、小麦、小米和玉米为主。大多数谷类作物在雨季(六月至九月)种植。这段时期种植的作物主要依赖雨水或需要更多的水,例如水稻、玉米、棉花和大豆。
- 有机经济作物的总种植面积将从 2017 年的 27 万公顷增加到 2021 年的 28 万公顷。该国主要生产的经济作物为棉花、甘蔗、茶叶和香辛料。目前,该国有机园艺作物的生长有限。由于对有机产品的需求不断增长以及印度政府的有机农业计划,预计2023-2029年期间有机作物面积将会增加。
透过电子商务管道不断增长的需求和供应将推动人均有机食品支出的成长
- 印度人均有机产品支出为0.23美元,与亚太地区人均有机产品支出平均值相比相对较低。然而,近年来,消费者需求正在转向有机产品,因为越来越多的消费者认为有机产品具有更强的免疫力、更好的品质并且更容易透过电子商务管道获得。印度是有机食品和饮料的一个有前景的市场。预计到 2024 年,印度有机食品和饮料产业规模将达到 1.38 亿美元,2019 年至 2024 年期间的复合年增长率为 13%。
- 2022 年该国消费的有机食品和饮料总合为 1.08 亿美元。该国有机产品消费额从 2016 年的 4,500 万美元成长至 2021 年的 9,600 万美元。有机食品销售趋势呈上升趋势,主要原因是消费者意识不断增强,高所得消费者鼓励消费有机食品和饮料。需求最大的类别包括有机鸡蛋、乳製品、水果和蔬菜等必需食品。
- 有机饮料消费占据市场主导地位,占 2022 年有机食品和有机饮料总合市场价值的约 85.2%。有机饮料部分包括经核准认证机构认证的有机包装食品和饮料产品。 2020 年至 2022 年,有机饮料消费量的复合年增长率为 14%。有机产品的价格溢价限制了低收入消费者的购买能力,是有机食品消费的主要限制因素。然而,积极的促销和有机产品的优势将在预测期内推动有机食品市场的发展。
印度生物刺激素产业概况
印度生物刺激素市场细分,前五大公司占10.77%。该市场的主要企业有 Biostadt India Limited、Coromandel International Ltd、Southern Petrochemical Industries Corporation、T.Stanes, Company Limited、Valagro 等。
其他福利
- Excel 格式的市场预测 (ME) 表
- 3个月的分析师支持
目录
第一章执行摘要和主要发现
第二章 报告要约
第三章 引言
- 研究假设和市场定义
- 研究范围
- 调查方法
第四章 产业主要趋势
- 有机种植区
- 有机产品人均支出
- 法律规范
- 印度
- 价值炼和通路分析
第五章市场区隔
- 形式
- 胺基酸
- 富里酸
- 腐植酸
- 蛋白质水解物
- 海藻萃取物
- 其他生物刺激素
- 作物类型
- 经济作物
- 园艺作物
- 田间作物
第六章竞争格局
- 重大策略倡议
- 市场占有率分析
- 商业状况
- 公司简介
- Biostadt India Limited
- Coromandel International Ltd
- Corteva Agriscience
- GrowTech Agri Science Private Limited
- Gujarat State Fertilizers & Chemicals Ltd
- Indian Farmers Fertiliser Cooperative Limited
- Rallis India Ltd
- Southern Petrochemical Industries Corporation
- T.Stanes and Company Limited
- Valagro
第七章:CEO面临的关键策略问题
第 8 章 附录
- 世界概况
- 概述
- 五力分析框架
- 全球价值链分析
- 市场动态(DRO)
- 资讯来源及延伸阅读
- 图片列表
- 关键见解
- 数据包
- 词彙表
The India Biostimulants Market size is estimated at 210.4 million USD in 2025, and is expected to reach 343 million USD by 2030, growing at a CAGR of 10.27% during the forecast period (2025-2030).
- Many biostimulants as active ingredients are used in the Indian biostimulants market, including humic acid, fulvic acid, amino acids, protein hydrolysates, seaweed extracts, chitosan, biopolymers, and other biostimulants such as plant and animal derivatives. The Indian biostimulants market was valued at USD 153.2 million in 2022 and grew by 15.7% between 2017 and 2022.
- Seaweed extract biostimulants have the largest market share in the Indian biostimulants market, accounting for 37.4% in 2022, with a market value of USD 57.3 million in 2022. This is due to their ability to improve the overall health of the plant, as well as their ability to improve stress tolerance, root growth, nutrition and water intake, plant growth, and crop yield.
- Row crops accounted for 86.2% of the biostimulants market value in 2022. This is because row crops accounted for approximately 82.3% of the total organic crop area in the country in 2022. Cash crops and horticultural crops account for 11.2% and 2.6% of the biostimulants market, respectively, in 2022.
- As the demand for organic food items is on the rise, the Indian government is promoting the production of organic crops, fruits, and vegetables through various schemes, like National Horticulture Mission, Horticulture Mission for North East and Himalayan States, Rashtriya Krishi Vikas Yojana, National Project on Management of Soil Health and Fertility, National Project on Organic Farming, Network Project on Organic Farming under Indian Council of Agricultural Research, and Paramparagat Krishi Vikas Yojana. These initiatives will boost the Indian biostimulants market.
- The Indian biostimulants market value is anticipated to grow between 2023 and 2029 by 81.2%, with a CAGR of 10.4%.
India Biostimulants Market Trends
Growing number of organic producers helping the increase in area under organic cultivation, primarily in row crops
- India is the largest country, in terms of the total number of certified organic producers in the world, with 1.3 million organic producers in 2019. Despite having a large number of organic producers, organic cultivation areas in the country account for around 2.0% of the total agriculture area in the country. In 2021, the organic area in the country was recorded as 711,094.0 hectares, which increased by about 3.4% compared to 2017. Organic farming in the country is concentrated in only a few states. The top ten organic farming states in the country account for about 80.0% of the total organic crop area. A few states have taken the lead in improving organic farming coverage, like Madhya Pradesh, Rajasthan, and Maharashtra, which are the top three organic farming states in the country. Madhya Pradesh alone accounted for about 27.0% of India's total organic cultivation area in 2019.
- Organic cultivation of row crops is dominant in the country, which accounted for about 59.7% of the total organic crop area in 2021. Cereal crop production is dominant rice, wheat, millet, and maize are the major cereals produced. Most cereal crops are grown in the kharif season (June - September). The crops grown in this season are mainly rain dependent or require more water, like rice, maize, cotton, and soybean.
- The overall organic cash crop cultivation area increased from 0.27 million hectares in 2017 to 0.28 million hectares in 2021. The major cash crops produced in the country are cotton, sugarcane, tea, and spices. There is a limited growth of organic horticultural crops currently in the country. The increasing demand for organic products and Indian government initiatives to go organic are anticipated to increase organic crop area between 2023 and 2029.
Growing demand and their easy accessibility through e-commerce channels, rising the per capita spending on organic food
- India's per capita spending on organic products is relatively low at USD 0.23 compared to the average per capita spending on organic products in Asia-Pacific. However, in recent years, shifting consumer demand has increased toward organic products as more customers perceive these items offer better immunity, higher quality, and more accessibility through e-commerce channels. India is a promising and developing market for organic foods and beverages. India's domestic organic food and beverage industry is expected to be worth USD 138.0 million by 2024, rising at a compound annual growth rate of 13% between 2019 to 2024.
- In 2022, the total combined organic food and beverages worth USD 108.0 million consumed in the country. The consumption value of organic products in the country increased from USD 45 million in 2016 to USD 96.0 million in 2021. Organic food sales have seen an increasing trend mainly due to increasing consumer awareness, and high-income consumers are propelling organic food and beverage consumption. Categories that gained the most demand included essential foods, such as organic eggs, dairy, and fruits and vegetables.
- Organic beverage consumption dominated the market and accounted for about 85.2% of the total combined organic food and beverages market value in 2022. The organic beverages segment includes organic packaged food and beverages that are certified by the approved certification body. Organic beverage consumption value increased at a CAGR of 14% between 2020 to 2022. The price premium associated with organic products hampers lower-income consumer access and is the major limiting factor for organic food consumption. However, organic products' active promotion and advantages drive the organic food market during the forecast period.
India Biostimulants Industry Overview
The India Biostimulants Market is fragmented, with the top five companies occupying 10.77%. The major players in this market are Biostadt India Limited, Coromandel International Ltd, Southern Petrochemical Industries Corporation, T.Stanes and Company Limited and Valagro (sorted alphabetically).
Additional Benefits:
- The market estimate (ME) sheet in Excel format
- 3 months of analyst support
TABLE OF CONTENTS
1 EXECUTIVE SUMMARY & KEY FINDINGS
2 REPORT OFFERS
3 INTRODUCTION
- 3.1 Study Assumptions & Market Definition
- 3.2 Scope of the Study
- 3.3 Research Methodology
4 KEY INDUSTRY TRENDS
- 4.1 Area Under Organic Cultivation
- 4.2 Per Capita Spending On Organic Products
- 4.3 Regulatory Framework
- 4.3.1 India
- 4.4 Value Chain & Distribution Channel Analysis
5 MARKET SEGMENTATION (includes market size in Value in USD and Volume, Forecasts up to 2030 and analysis of growth prospects)
- 5.1 Form
- 5.1.1 Amino Acids
- 5.1.2 Fulvic Acid
- 5.1.3 Humic Acid
- 5.1.4 Protein Hydrolysates
- 5.1.5 Seaweed Extracts
- 5.1.6 Other Biostimulants
- 5.2 Crop Type
- 5.2.1 Cash Crops
- 5.2.2 Horticultural Crops
- 5.2.3 Row Crops
6 COMPETITIVE LANDSCAPE
- 6.1 Key Strategic Moves
- 6.2 Market Share Analysis
- 6.3 Company Landscape
- 6.4 Company Profiles (includes Global Level Overview, Market Level Overview, Core Business Segments, Financials, Headcount, Key Information, Market Rank, Market Share, Products and Services, and Analysis of Recent Developments).
- 6.4.1 Biostadt India Limited
- 6.4.2 Coromandel International Ltd
- 6.4.3 Corteva Agriscience
- 6.4.4 GrowTech Agri Science Private Limited
- 6.4.5 Gujarat State Fertilizers & Chemicals Ltd
- 6.4.6 Indian Farmers Fertiliser Cooperative Limited
- 6.4.7 Rallis India Ltd
- 6.4.8 Southern Petrochemical Industries Corporation
- 6.4.9 T.Stanes and Company Limited
- 6.4.10 Valagro
7 KEY STRATEGIC QUESTIONS FOR AGRICULTURAL BIOLOGICALS CEOS
8 APPENDIX
- 8.1 Global Overview
- 8.1.1 Overview
- 8.1.2 Porter's Five Forces Framework
- 8.1.3 Global Value Chain Analysis
- 8.1.4 Market Dynamics (DROs)
- 8.2 Sources & References
- 8.3 List of Tables & Figures
- 8.4 Primary Insights
- 8.5 Data Pack
- 8.6 Glossary of Terms
 全球植物健康诱导剂市场:预测至2032年-按诱导剂类型、製剂、作用机制、作物类型、应用方法、最终用户、通路和地区进行分析
 生物刺激剂市场机会、成长驱动因素、产业趋势分析及预测(2025-2034年)2032年农业生物刺激素市场预测:按活性成分、作物类型、施用方法、配方和地区进行的全球分析
 海洋生物刺激素市场-全球产业规模、份额、趋势、机会和预测,按成分、应用模式、最终用途、地区和竞争细分,2020-2030 年预测
 生物刺激素市场(按形态、来源、使用方法和作物类型)—2025-2032 年全球预测生物刺激素市场-全球产业规模、份额、趋势、机会及预测(按活性成分、作物类型、应用、地区和竞争情况细分,2020-2030 年)
 腐植酸基生物刺激素市场,依产品类型、形式、应用、作物类型、国家划分 - 2025 年至 2032 年全球产业分析、市场规模、市场份额及预测
 2025年生物刺激素全球市场报告胺基酸类生物刺激素市场机会、成长动力、产业趋势分析及 2025 - 2034 年预测
 生物刺激素市场规模及预测(2021-2031 年)、全球及各地区份额、趋势及成长机会分析报告涵盖范围:依产品类型、应用方式、作物类型及地理划分