


 |
市场调查报告书
商品编码
1836496
智慧公用事业管理:市场占有率分析、产业趋势、统计数据和成长预测(2025-2030 年)Smart Utilities Management - Market Share Analysis, Industry Trends & Statistics, Growth Forecasts (2025 - 2030) |
||||||
※ 本网页内容可能与最新版本有所差异。详细情况请与我们联繫。
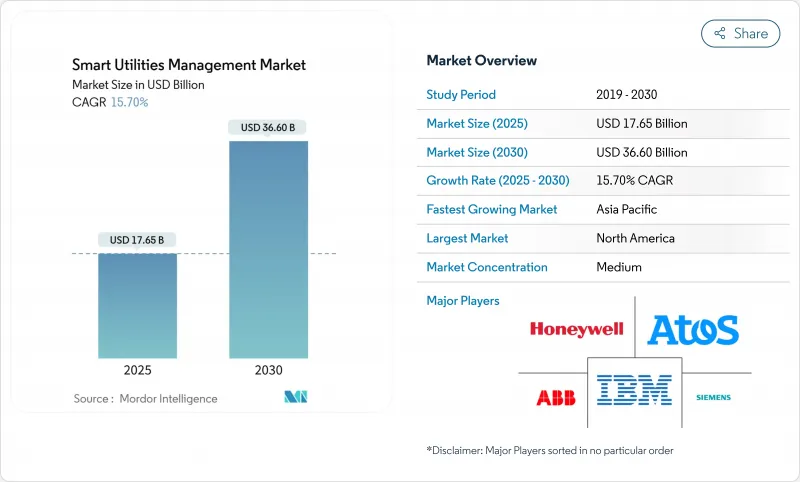
智慧公用事业管理市场预计在 2025 年价值 176.5 亿美元,预计到 2030 年将达到 366 亿美元,复合年增长率为 15.7%,这突显了从传统资产转向以数据为中心的自动化电网的明显转变。
先进计量基础设施 (AMI) 的加速部署、大规模数位数位双胞胎部署以及边缘运算分析是支撑这一发展轨蹟的关键力量。在支持性法规和电网现代化预算的推动下,北美仍然是最大的区域枢纽。同时,随着中国和印度在下一代输配电领域进行创纪录的公共产业投资,亚太地区正经历最快的扩张。公用事业公司也正在采用微电网和分散式能源 (DER)编配平台,以增强网路抵御气候引发的停电的能力,并优化用户侧资产。虽然软体解决方案在采购计划中占据主导地位,但随着公用事业公司将复杂的系统整合和网路安全监控外包,託管服务的成长速度最快。
全球智慧公用事业管理市场趋势与洞察
智慧城市日益普及
随着市政负责人寻求电力、水利、交通和废弃物的一体化运营,智慧城市计画正在加速端到端公共产业数位化。新加坡榜鹅数位区正在部署一个区域级智慧电网,将能源、冷冻和行动数据整合到一个指挥平台。中国的Vehicle-to-Grid试点计画使用连网电动车来平衡当地配电负荷,展现了智慧运输和能源管理的整合。在中东,杜拜水电局已承诺将为其智慧电网蓝图投入 19 亿美元,将公共产业定位为全市优化的数位骨干。这些倡议创造了强大的网路效应。一旦基础遥测到位,从交通号誌到废弃物物流等其他城市功能都可以使用相同的数据主干,从而扩大对统一公用事业平台的需求。
政府强制推行先进计量基础设施
立法是短期内推动智慧电錶普及的最强催化剂。澳洲目前规定,到2030年,智慧电錶必须在全国电力市场普及,并宣称对于高度可再生的电网而言,智慧电錶是「不可或缺的」。在美国,《2020年能源法案》要求在联邦设施上安装先进的水錶,并且每天抄表。法国的国家Linky计画展示如何透过强制规定在五年内实现90%的家庭普及率,并制定出能够波及出口市场的性能标准。数量保证使供应商能够扩大规模,从而降低单位成本并使产品符合通用标准,从而降低后来者被公共产业采用的风险。
智慧电錶面临高成本、安全和整合挑战
总拥有成本仍然是一个很大的障碍,尤其是在每位客户的收益较低的情况下。完整的 AMI 改造通常需要变电站升级、前端更换和新的网路安全层,从而推高了电錶硬体以外的资本支出。美国国家医学图书馆发表的一项研究警告说,每个连接的电錶都会增加一个攻击媒介,扩大电网的威胁面。当供应商限制 API 或强制使用专有韧体时,互通性就会受到损害,正如澳洲关于限制电网服务参与的封闭式电池生态系统的争论所见。半导体供应紧张导致的零件短缺延长了前置作业时间并推高了价格。成本敏感型经济体的公用事业公司必须承担这些成本或将其转嫁给消费者。
报告中分析的其他驱动因素和限制因素
- 分散式能源(DER)和微电网整合
- 提高能源效率
- 复杂且不断发展的资料隐私法规
細項分析
到 2024 年,电錶资料管理系统 (MDMS) 将以 48.3% 的收入成长率保持领先地位,这证实了公用事业公司优先考虑大规模收集、检验和分析间隔测量资料。该细分市场的规模还巩固了用于停电、员工和资产健康应用的广泛分析模组,从而加强了供应商锁定并提高了平台黏性。随着公用事业公司面临气候驱动的极端天气,先进的停电管理系统正以 15.9% 的复合年增长率加速发展。人工智慧拓扑建模也将故障定位时间从数小时缩短到数分钟。 CenterPoint Energy 和 Neara 的飓风后伙伴关係突显了公用事业公司如何采购云端原生模拟工具以在风暴季节之前对其网路进行压力测试。随着多重应用整合的持续,供应商协调 MDMS 与 SCADA、地理资讯系统和 DERMS 的能力正日益成为购买决策因素,促使整合商将模组捆绑到整合授权中。
这种融合的次要影响是公用事业内部的技能差距不断扩大。习惯于传统SCADA系统的营运商现在必须解读机率预测和机器学习输出,这促使公用事业公司积极参与培训专案并签订託管营运合约。将MDMS定位为营运智慧核心的供应商将获得下游收益,例如客户参与、现场服务自动化和网路回应,从而增强智慧公用事业管理市场的长期现金流状况。
2024年,软体将占支出的57.5%,这反映了分析、视觉化和自动化层面价值的不断增长。无程式码仪表板、基于角色的存取和人工智慧辅助配置已嵌入公用事业软体的核心,从而将试运行週期从数月缩短至数天。同时,公用事业公司正在将授权模式从永久合约转变为订阅模式,以平衡营运成本,并提升供应商的终身客户价值。服务虽然规模较小,但随着整合和网路安全需求超越传统公用事业能力,其复合年增长率高达16.3%。威立雅与Mistral AI的合作就是一个很好的例子。该公司正在整合一个生成式人工智慧聊天介面,使工厂经理能够使用自然语言查询资产效率,从而将领域数据转化为决策支援。
虽然硬体销售对于电网边缘可视性仍然至关重要——尤其是在刚开始首波智慧电錶推广的新兴市场——但净利率正在缩水。因此,供应商正在捆绑韧体许可证、延长保固期和託管升级计划,以确保经常性收益。同时,云端运算超大规模供应商正在提供获得 NERC CIP 和 ISO 27001 认证的公用事业行业专用环境,从而降低感知风险并加速云端运算在智慧公用事业管理市场的布局。
区域分析
在联邦拨款、州级弹性要求以及积极的投资者所有公共产业(IOU) 资本支出计划的同步推动下,北美地区 2024 年的收入将保持 38.6% 的增长。 AMI 电錶的普及率已超过所有电錶的 80%,而市场关注点正转向 DERMS、停电预测和以客户为中心的分时电价。欧洲继续优先考虑脱碳和能源独立,支援数位双胞胎进行容量规划,并增强跨境互联的网路安全。
然而,受中国887亿美元的2025年国家电网预算和印度1,090亿美元的输电升级蓝图的推动,亚太地区的复合年增长率最高,达16.0%。该地区各国政府将数位网路视为大规模可再生能源併网和都市化政策的先决条件。因此,供应商的策略着重于成本优化的硬体、多语言介面和本地服务伙伴关係关係,以规避竞标规则。东南亚规模较小的市场透过复製先驱的策略,正在压缩采用曲线,并在智慧公用事业管理市场中保持高于平均的成长。
其他福利:
- Excel 格式的市场预测 (ME) 表
- 3个月的分析师支持
目录
第一章 引言
- 研究假设和市场定义
- 调查范围
第二章调查方法
第三章执行摘要
第四章 市场状况
- 市场概况
- 市场驱动因素
- 智慧城市日益普及
- 政府对先进计量基础设施的要求
- 分散式能源(DER)和微电网整合
- 提高能源效率
- 在公共产业中扩展物联网边缘分析
- 在水和天然气网路中采用数位双胞胎
- 市场限制
- 智慧电錶面临高成本、安全和整合挑战
- 复杂且不断发展的资料隐私法规
- 专有生态系造成互通性差距
- 农村地区对老化通讯基础设施的依赖
- 价值链分析
- 监管状况
- 技术展望
- 波特五力分析
- 供应商的议价能力
- 消费者议价能力
- 新进入者的威胁
- 替代品的威胁
- 竞争对手之间的竞争强度
- 评估宏观经济趋势对市场的影响
第五章市场规模及成长预测(金额)
- 按类型
- 仪表资料管理系统
- 能源监控/管理
- 智慧配电管理
- 先进的停电管理系统
- 按组件
- 硬体
- 软体
- 服务
- 按实用程式类型
- 电
- 自来水厂
- 气体
- 依部署类型
- 本地部署
- 云
- 按地区
- 北美洲
- 美国
- 加拿大
- 墨西哥
- 欧洲
- 德国
- 英国
- 法国
- 义大利
- 西班牙
- 其他欧洲国家
- 亚太地区
- 中国
- 日本
- 印度
- 韩国
- 澳洲和纽西兰
- 其他亚太地区
- 南美洲
- 巴西
- 阿根廷
- 其他南美
- 中东和非洲
- 中东
- 沙乌地阿拉伯
- 阿拉伯聯合大公国
- 土耳其
- 其他中东地区
- 非洲
- 南非
- 埃及
- 奈及利亚
- 其他非洲国家
- 北美洲
第六章 竞争态势
- 市场集中度
- 策略趋势
- 市占率分析
- 公司简介
- IBM Corporation
- Siemens AG
- Honeywell International Inc.
- ABB Ltd
- Cisco Systems Inc.
- Atos SE
- Itron Inc.
- Schneider Electric SE
- Oracle Corp.
- Landis+Gyr AG
- Aclara Technologies LLC
- Sensus(Xylem Inc.)
- Kamstrup A/S
- Trilliant Holdings
- Powel ASA
- GE Digital
- Eaton Corp. plc
- Silver Spring Networks(Itron)
- Enel X
- Huawei Technologies Co.
第七章 市场机会与未来展望
The smart utilities management market size stood at USD 17.65 billion in 2025 and is forecast to reach USD 36.60 billion by 2030 at a 15.7% CAGR, underscoring a clear shift from legacy assets to data-centric, automated grids.
Accelerated rollouts of advanced metering infrastructure (AMI), large-scale digital-twin deployments, and edge-enabled analytics are the chief forces sustaining this trajectory. North America remains the largest regional hub on the back of supportive regulation and grid-modernization budgets, while Asia-Pacific registers the fastest expansion as China and India direct record utility capex toward next-generation transmission and distribution. Utilities are also adopting microgrids and distributed energy resource (DER) orchestration platforms to harden networks against climate-driven outages and optimize behind-the-meter assets. Software solutions dominate procurement plans, yet managed services are rising fastest as utilities outsource complex system integration and cybersecurity oversight.
Global Smart Utilities Management Market Trends and Insights
Rise in Smart City Deployment
Smart-city programs are accelerating end-to-end utility digitalization as municipal planners demand integrated power, water, transport, and waste operations. Singapore's Punggol Digital District is deploying a district-level smart grid that unifies energy, cooling, and mobility data into a single command platform. China's vehicle-to-grid pilots are using connected electric vehicles to balance local distribution loads, signaling convergence between smart mobility and energy management. In the Middle East, Dubai Electricity and Water Authority committed USD 1.9 billion to its smart-grid roadmap, positioning utilities as digital backbones for city-wide optimization. These initiatives create strong network effects: once foundational telemetry is in place, additional city functions-from traffic lights to waste logistics-can ride on the same data spine, amplifying demand for unified utility platforms.
Government Mandates for Advanced Metering Infrastructure
Legislation is the single most powerful catalyst for near-term rollouts. Australia now requires universal smart meters across the National Electricity Market by 2030, declaring them "non-negotiable" for high-renewable grids. In the United States, the Energy Act of 2020 obliges federal facilities to install advanced water meters capable of daily readings. France's nationwide Linky program showcases how a mandate can hit 90% household coverage within five years, setting performance benchmarks that ripple into export markets. Guaranteed volume commitments give vendors scale to cut unit costs and conform products to common standards, thereby lowering adoption risk for late-moving utilities.
High Cost, Security and Integration Challenges for Smart Meters
Total-cost-of-ownership hurdles persist, especially where per-customer revenue is low. Full AMI conversions often require substation upgrades, head-end replacements, and new cybersecurity layers, driving up capex beyond meter hardware. Research published in the National Library of Medicine warns that each connected meter introduces an additional attack vector, expanding the grid's threat surface. Interoperability suffers when vendors restrict APIs or apply proprietary firmware, as illustrated by Australian debates over closed battery ecosystems that limit participation in grid services. Component shortages, driven by semiconductor supply tightness, are prolonging lead times and inflating prices-factors that utilities in cost-sensitive economies must absorb or pass through to consumers.
Other drivers and restraints analyzed in the detailed report include:
- Integration of Distributed Energy Resources (DERs) and Microgrids
- Improvements in Energy Efficiency
- Complex, Evolving Data-Privacy Regulations
For complete list of drivers and restraints, kindly check the Table Of Contents.
Segment Analysis
Meter data management systems (MDMS) retained leadership with 48.3% revenue in 2024, underscoring utilities' priority to collect, validate, and analyze interval readings at scale. The segment's size also positions it as the anchor for broader analytics modules that feed outage, workforce, and asset-health applications, reinforcing vendor lock-in and fueling platform stickiness. Advanced outage management systems are accelerating at a 15.9% CAGR as utilities confront climate-driven extreme-weather events; AI-enabled topology modeling is shrinking fault-location windows from hours to minutes. CenterPoint Energy's post-hurricane partnership with Neara highlights how utilities procure cloud-native simulation tools to stress-test networks before storm seasons. As multi-application convergence continues, purchasing decisions increasingly factor a vendor's ability to harmonize MDMS with SCADA, geographic information systems, and DERMS, driving integrators to bundle modules in unified licenses.
A second-order effect of this convergence is the widening skills gap inside utilities. Operators accustomed to legacy SCADA must now interpret probabilistic forecasts and machine-learning outputs, steering utilities toward training programs or managed-operations contracts. Vendors that position MDMS as the kernel for operational intelligence are capturing downstream revenues in customer engagement, field-service automation, and cyber-response, strengthening the long-term cash-flow profile of the smart utilities management market.
Software accounted for 57.5% of spending in 2024, reflecting the high value assigned to analytics, visualization, and automation layers. Core utility software now embeds no-code dashboards, role-based access, and AI-assisted configuration, reducing commissioning cycles from months to days. Simultaneously, utilities are migrating license models from perpetual to subscription, smoothing opex but enlarging lifetime customer value for vendors. Services, although smaller, are expanding at 16.3% CAGR because integration and cybersecurity demands fall outside traditional utility competencies. Veolia's collaboration with Mistral AI is emblematic: the firm is embedding generative AI chat interfaces so plant managers can query asset efficiency in natural language, essentially converting domain data into decision support.
Hardware sales remain critical for grid-edge visibility-particularly in emerging markets embarking on first-wave smart-meter rollouts-but margins are tightening. Suppliers, therefore, bundle firmware licenses, extended warranties, and managed-upgrade programs to lock in recurring revenue. In parallel, cloud hyperscalers court utilities with sector-specific environments certified for NERC CIP and ISO 27001, lowering perceived risk and accelerating the cloud pivot inside the smart utilities management market.
The Smart Utilities Management Market Report is Segmented by Type (Meter Data Management Systems, Energy Monitoring / Management, Smart Distribution Management, and Advanced Outage Management Systems), Component (Hardware, Software, and Services), Utility Type (Electricity, Water, and Gas), Deployment Mode (On-Premise and Cloud), and Geography. The Market Forecasts are Provided in Terms of Value (USD).
Geography Analysis
North America retained 38.6% revenue in 2024 thanks to a synchronized cycle of federal grants, state-level resiliency mandates, and aggressive investor-owned utility (IOU) capex plans. Penetration of AMI exceeds 80% of all meters, shifting attention to DERMS, outage prediction, and customer-centric time-of-use pricing. Europe continues to prioritize decarbonization and energy independence, championing digital twins for capacity planning and cybersecurity hardening across cross-border interties.
Asia-Pacific, however, posts the fastest 16.0% CAGR, anchored by China's USD 88.7 billion State Grid budget for 2025 and India's USD 109 billion transmission upgrade blueprint. Governments in the region view digital networks as a prerequisite for large-scale renewable integration and urbanization policies. Vendor strategies, therefore, emphasize cost-optimized hardware, multilingual interfaces, and local-services partnerships to navigate tender rules. Smaller Southeast Asian markets replicate early mover playbooks, compressing adoption curves and sustaining above-average growth for the smart utilities management market.
- IBM Corporation
- Siemens AG
- Honeywell International Inc.
- ABB Ltd
- Cisco Systems Inc.
- Atos SE
- Itron Inc.
- Schneider Electric SE
- Oracle Corp.
- Landis+Gyr AG
- Aclara Technologies LLC
- Sensus (Xylem Inc.)
- Kamstrup A/S
- Trilliant Holdings
- Powel ASA
- GE Digital
- Eaton Corp. plc
- Silver Spring Networks (Itron)
- Enel X
- Huawei Technologies Co.
Additional Benefits:
- The market estimate (ME) sheet in Excel format
- 3 months of analyst support
TABLE OF CONTENTS
1 INTRODUCTION
- 1.1 Study Assumptions and Market Definition
- 1.2 Scope of the Study
2 RESEARCH METHODOLOGY
3 EXECUTIVE SUMMARY
4 MARKET LANDSCAPE
- 4.1 Market Overview
- 4.2 Market Drivers
- 4.2.1 Rise in Smart City Deployment
- 4.2.2 Government Mandates for Advanced Metering Infrastructure
- 4.2.3 Integration of Distributed Energy Resources (DERs) and Microgrids
- 4.2.4 Improvements in Energy Efficiency
- 4.2.5 Expansion of IoT-Edge Analytics in Utilities
- 4.2.6 Digital-Twin Adoption for Water and Gas Networks
- 4.3 Market Restraints
- 4.3.1 High Cost, Security and Integration Challenges for Smart Meters
- 4.3.2 Complex, Evolving Data-Privacy Regulations
- 4.3.3 Interoperability Gaps from Proprietary Ecosystems
- 4.3.4 Rural Dependence on Aging Telecom Infrastructure
- 4.4 Value Chain Analysis
- 4.5 Regulatory Landscape
- 4.6 Technological Outlook
- 4.7 Porter's Five Forces Analysis
- 4.7.1 Bargaining Power of Suppliers
- 4.7.2 Bargaining Power of Consumers
- 4.7.3 Threat of New Entrants
- 4.7.4 Threat of Substitute Products
- 4.7.5 Intensity of Competitive Rivalry
- 4.8 Assessment of the Impact of Macroeconomic Trends on the Market
5 MARKET SIZE AND GROWTH FORECASTS (VALUE)
- 5.1 By Type
- 5.1.1 Meter Data Management Systems
- 5.1.2 Energy Monitoring / Management
- 5.1.3 Smart Distribution Management
- 5.1.4 Advanced Outage Management Systems
- 5.2 By Component
- 5.2.1 Hardware
- 5.2.2 Software
- 5.2.3 Services
- 5.3 By Utility Type
- 5.3.1 Electricity
- 5.3.2 Water
- 5.3.3 Gas
- 5.4 By Deployment Mode
- 5.4.1 On-Premise
- 5.4.2 Cloud
- 5.5 By Geography
- 5.5.1 North America
- 5.5.1.1 United States
- 5.5.1.2 Canada
- 5.5.1.3 Mexico
- 5.5.2 Europe
- 5.5.2.1 Germany
- 5.5.2.2 United Kingdom
- 5.5.2.3 France
- 5.5.2.4 Italy
- 5.5.2.5 Spain
- 5.5.2.6 Rest of Europe
- 5.5.3 Asia-Pacific
- 5.5.3.1 China
- 5.5.3.2 Japan
- 5.5.3.3 India
- 5.5.3.4 South Korea
- 5.5.3.5 Australia and New Zealand
- 5.5.3.6 Rest of Asia-Pacific
- 5.5.4 South America
- 5.5.4.1 Brazil
- 5.5.4.2 Argentina
- 5.5.4.3 Rest of South America
- 5.5.5 Middle East and Africa
- 5.5.5.1 Middle East
- 5.5.5.1.1 Saudi Arabia
- 5.5.5.1.2 United Arab Emirates
- 5.5.5.1.3 Turkey
- 5.5.5.1.4 Rest of Middle East
- 5.5.5.2 Africa
- 5.5.5.2.1 South Africa
- 5.5.5.2.2 Egypt
- 5.5.5.2.3 Nigeria
- 5.5.5.2.4 Rest of Africa
- 5.5.1 North America
6 COMPETITIVE LANDSCAPE
- 6.1 Market Concentration
- 6.2 Strategic Moves
- 6.3 Market Share Analysis
- 6.4 Company Profiles (includes Global overview, Market overview, Core Segments, Financials, Strategic Info, Market Rank/Share, Products and Services, Recent Developments)
- 6.4.1 IBM Corporation
- 6.4.2 Siemens AG
- 6.4.3 Honeywell International Inc.
- 6.4.4 ABB Ltd
- 6.4.5 Cisco Systems Inc.
- 6.4.6 Atos SE
- 6.4.7 Itron Inc.
- 6.4.8 Schneider Electric SE
- 6.4.9 Oracle Corp.
- 6.4.10 Landis+Gyr AG
- 6.4.11 Aclara Technologies LLC
- 6.4.12 Sensus (Xylem Inc.)
- 6.4.13 Kamstrup A/S
- 6.4.14 Trilliant Holdings
- 6.4.15 Powel ASA
- 6.4.16 GE Digital
- 6.4.17 Eaton Corp. plc
- 6.4.18 Silver Spring Networks (Itron)
- 6.4.19 Enel X
- 6.4.20 Huawei Technologies Co.
7 MARKET OPPORTUNITIES AND FUTURE OUTLOOK
- 7.1 White-Space and Unmet-Need Assessment

