


 |
市场调查报告书
商品编码
1836513
苛性钠:市场占有率分析、产业趋势、统计数据和成长预测(2025-2030 年)Caustic Soda - Market Share Analysis, Industry Trends & Statistics, Growth Forecasts (2025 - 2030) |
||||||
※ 本网页内容可能与最新版本有所差异。详细情况请与我们联繫。
2024年,膜电池将占据大部分产量,占据苛性钠市场份额的85%,而到2030年,隔膜电池的复合年增长率将达到5.12%。
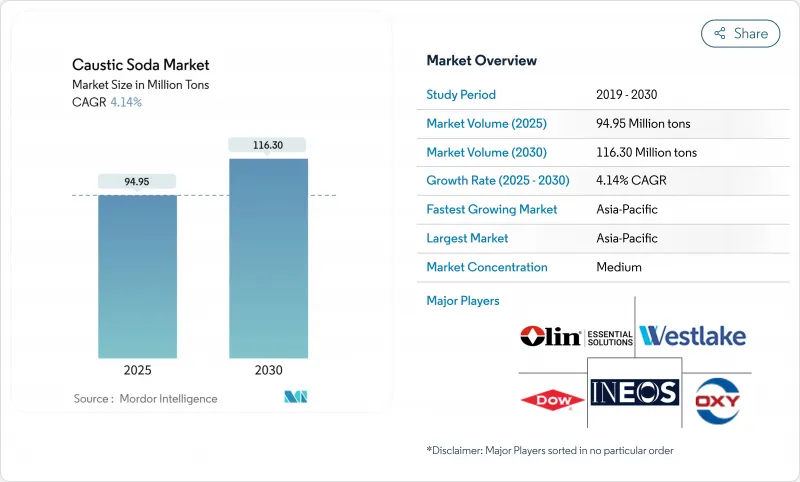
预计全球对苛性钠的需求将在 2025 年达到 9,495 万吨,到 2030 年将达到 1.163 亿吨,2025 年至 2030 年的复合年增长率为 4.14%。强劲的成长得益于该化学品广泛的工业应用,包括氧化铝精炼、有机化学合成、纸浆和造纸、纺织和水处理。膜电池技术已占产量的 85%,由于与传统汞电池相比,该技术可减少约 30% 的用电量并消除汞排放,因此正在扩大。亚洲占吨位的 64%,由于具有竞争力的电价、快速的炼油厂建设和积极的粘胶纤维投资而占据主导地位。液体等级占出货量的 65%,并提供有利的管道运输和散装储存。价差越来越多地追踪区域能源成本,促使生产商签署低碳电力合约并在天然气丰富的海岸线附近设立新工厂。中国、印度和美国宣布的产能扩张凸显了能源安全、碳政策和局部需求丛集之间的谨慎平衡,维持了合理分散的苛性钠市场。
全球苛性钠市场趋势与洞察
亚洲氧化铝精炼厂加速扩张
由于每使用拜耳法提取一吨氧化铝需要冶炼 2-3 吨,因此精炼产能的提高推高了苛性钠的消耗量,预计到 2024 年,仅中国铝製造商就将消耗数千万吨烧碱。印尼和印度的新冶炼厂正在签订长期供应合约以对冲价格上涨,这可能导致铝生产成本较上季上涨近 6%。工厂营运商也在采购更高纯度的烧碱以减少赤泥浪费,导致低盐苛性钠价格溢价。目前,一些炼油厂所有者正在考虑后向整合,加剧了上游许可证和电力取得的竞争。由于每增加一百万吨氧化铝大约需要 250 万吨苛性钠,因此计划于 2025-2027 年绿地计画正在支持苛性钠市场的结构性需求增长。
肥皂和清洁剂的需求不断增加
新兴市场卫生主导的都市化正在拓宽肥皂和清洁剂,而苛性钠是这些产品中皂化反应的碱性主链。预计到2024年,印尼、奈及利亚和越南界面活性剂製造商的出货量将达到两位数成长,目前优质食品级苛性钠的价格较标准的50 wt%溶液上涨了12%。特殊配方师要求产品中铁和镍的含量达到超低,以减少透明肥皂的变色,这促使製造商投资盐水净化装置。从抗菌液体到织物专用粉末,丰富的产品组合保持了苛性钠市场的多样性,从而缓解了重工业的週期性衰退。
欧洲电价波动
电费占膜电解现金成本的50%,但欧洲的日前电价在2025年初超过90欧元/兆瓦时,侵蚀了欧洲氯碱的利润。根据欧盟排放权交易体系,生产商面临间接二氧化碳排放费用,使得他们与俄罗斯和沙乌地阿拉伯出口商的成本差距扩大至每吨120美元。目前正在讨论的补偿方案可能会补偿部分成本,但政策的不确定性阻碍了欧洲新产能的投资。因此,预计2024年西北欧的现货进口量将年增19%,这将对该地区的苛性钠市场带来压力。
报告中分析的其他驱动因素和限制因素
- 印度粘胶短纤维产量激增
- 提高中东和非洲的海水淡化能力
- 能源密集型生产流程
細項分析
氯化钠的优点源自于对汞技术的监管禁令(尤其是欧盟2017年的最终淘汰日期)及其比传统电池节省30%的能源。此外,氯化钠污染可以保持在100 ppm以下,从而为半导体製造提供高纯度等级。中国、美国和德国的製造商正在透过将电流密度提高到7 kA m-2来突破现有薄膜生产线的瓶颈,从而在不增加新的盐水迴路的情况下增加吨位。一股平行的投资浪潮席捲日本,旭化成将于2024年获得政府支持,以扩大膜堆产能,用于国内氯碱维修。苛性钠市场的其余部分是薄膜和残留汞产能。
液体苛性钠的运输量通常为 50 wt%,占 2024 年运输量的 65%,而固态苛性钠的复合年增长率预计为 4.87%。对于距离氯碱厂 300-500 公里范围内的客户,管道连通性和散装卡车处理使液体成为预设选择,从而将运费保持在 30 美元/吨以下。纸浆和造纸厂、炼油厂和营业单位对液体的需求尤其强劲,这些公司的连续注入系统依赖标准的 50 wt% 原料。片状、珠状和团块状固态可满足远距、纯度关键或小批量的需求。虽然固态原料的数量较少,但由于脱水、造粒和抑尘工艺,每吨价格高出 120 美元。 Hydrite 于 2025 年推出的密封桶珠包装可有效降低吸湿性,直接满足最终用户的安全需求。固态的用量将主要成长于电子、製药和纺织染色领域,这将为生产商在商品苛性钠市场提高利润率提供途径。
区域分析
亚太地区巩固了领先地位,占2024年出货量的64%。儘管由于欧洲需求疲软导致出口下降,中国氯碱工厂的产量仍接近4,100万吨。由于铝和聚氯乙烯(PVC)产量扩张,国内消费依然强劲。随着Atul Products公司在瓦尔萨德(Valsad)的一座300吨/日的工厂于2024年运作,印度苛性钠市场势头强劲。东南亚生产商受益于该地区对肥皂、生物柴油和电池前驱体的需求,在跨境计划中站稳了脚跟,从而降低了海运风险。
北美儘管市场份额较小,但其电解电力成本在全球处于最低水平,充分利用页岩气资源,促进了苛性钠和氯衍生物的出口竞争力。 OxyChem 将于 2024 年在德克萨斯州运作一条 67.8 万吨製冷级生产线,以增强国内供应弹性。该地区的未来规划包括 PCC 集团计划在科慕德利斯尔工厂建造的 34 万吨氯碱装置,该装置计划于 2028 年试运行。此类棕地整合将为成熟且技术先进的苛性钠市场增添商用苛性钠,同时巩固氯气经销店。
欧洲正深陷高企且波动的能源价格的泥潭。儘管拥有76个製造地,但不断上涨的现货电价已将该地区的现金成本推高至远高于俄罗斯或沙乌地阿拉伯,导致运转率下降。政策制定者目前正在讨论间接成本补偿,以避免碳洩漏,并保护氯碱产业链中3.5万个直接就业机会。儘管如此,在电子、製药和食品加工等行业,欧洲生产商仍在继续与遵守欧洲大陆严格品质通讯协定的客户开展业务,儘管面临普遍的成本压力,但仍保持着独特的价值主张。
其他福利:
- Excel 格式的市场预测 (ME) 表
- 3个月的分析师支持
目录
第一章 引言
- 研究假设和市场定义
- 调查范围
第二章调查方法
第三章执行摘要
第四章 市场状况
- 市场概况
- 市场驱动因素
- 亚洲氧化铝提炼加速扩张将增加苛性钠需求
- 肥皂和清洁剂的需求不断增加
- 印度粘胶短纤维产量激增
- 提高中东和非洲的海水淡化能力
- 欧盟强制要求改用膜电池推动升级计划
- 市场限制
- 欧洲电价波动
- 能源密集型生产流程
- 各个终端用户产业中替代产品的可用性
- 价值链分析
- 技术展望
- 价格概览
- 贸易概况
- 五力分析
- 供应商的议价能力
- 买方的议价能力
- 新进入者的威胁
- 替代品的威胁
- 竞争程度
第五章市场规模及成长预测(数量)
- 按製造工艺
- 膜细胞
- 隔膜细胞
- 其他流程
- 按形状
- 液体
- 固体的
- 按浓度等级
- 32wt%
- 50wt%
- 73wt%或更多
- 按用途
- 纸浆和造纸
- 有机化学品
- 无机化学品
- 肥皂和清洁剂
- 氧化铝
- 水处理
- 纤维(黏胶纤维,染色)
- 其他(食品和製药加工、采矿和冶金)
- 按地区
- 亚太地区
- 中国
- 印度
- 日本
- 韩国
- ASEAN
- 其他亚太地区
- 北美洲
- 美国
- 加拿大
- 墨西哥
- 欧洲
- 德国
- 英国
- 义大利
- 法国
- 北欧的
- 其他欧洲国家
- 南美洲
- 巴西
- 阿根廷
- 其他南美
- 中东和非洲
- 沙乌地阿拉伯
- 阿拉伯聯合大公国
- 土耳其
- 南非
- 埃及
- 其他中东和非洲地区
- 亚太地区
第六章 竞争态势
- 市场集中度
- 策略趋势
- 市占率(%)/排名分析
- 公司简介{ }(英文)
- AGC Inc.
- Atul Ltd
- BorsodChem(Wanhua Chemical Group)
- Covestro AG
- DCW Ltd.
- Dow
- Formosa Plastics Corporation
- GHCL Limited
- Grasim Industries Limited
- Gujarat Alkalies and Chemicals Limited
- Hanwha Solutions Corp.
- INEOS
- Nouryon
- Occidental Petroleum Corporation
- Olin Corporation
- SABIC
- Shin-Etsu Chemical Co. Ltd.
- Tata Chemicals Ltd.
- Tosoh Corporation
- Westlake Corporation
- Xinjiang Zhongtai Chemical Co. Ltd.
第七章 市场机会与未来展望
- 钠离子电池领域需求不断成长
- 节能生产流程的需求不断增加
- 閒置频段和未满足需求评估
The membrane cell segment generated the bulk of 2024 output, commanding 85% of the caustic soda market share, and the diaphragm cell is expanding at a 5.12% CAGR to 2030.
Global demand for caustic soda totals 94.95 million tons in 2025 and is forecast to climb to 116.30 million tons by 2030, reflecting a 4.14% CAGR over 2025-2030. Robust growth springs from the chemical's wide industrial reach, with alumina refining, organic chemical synthesis, pulp and paper, textiles, and water treatment each deepening their consumption. Membrane cell technology, already responsible for 85% of output, is expanding because it cuts electricity use by roughly 30% relative to legacy mercury cells and eliminates mercury emissions. Asia's dominance, at 64% of tonnage, rests on competitive power tariffs, rapid refinery build-outs, and aggressive viscose fiber investments. Liquid grades command 65% of deliveries, favored for pipeline transfer and bulk storage. Pricing spreads increasingly track regional energy costs, prompting producers to lock in low-carbon electricity contracts and locate new plants near gas-rich coastlines. Capacity additions announced in China, India, and the United States underscore a careful balance between energy security, carbon policy, and localized demand clusters, sustaining a moderately fragmented caustic soda market.
Global Caustic Soda Market Trends and Insights
Accelerated Alumina Refinery Expansions in Asia
Rising refinery capacity is lifting caustic soda offtake because 2-3 tons are dissolved for every ton of alumina extracted in the Bayer process, and Chinese aluminum producers alone consumed tens of millions of tons in 2024. New smelter complexes in Indonesia and India are contracting long-term supply to hedge price spikes, which can swing aluminum production costs by nearly 6% quarter-on-quarter. Plant operators also source higher-purity grades to reduce red-mud disposal volumes, translating into price premia for low-salt caustic soda. Several refinery owners now consider backward integration, sharpening competition for upstream licenses and power access. With each 1 million-ton alumina addition requiring roughly 2.5 million tons of caustic soda, green-field projects scheduled for 2025-2027 underpin structural demand growth for the caustic soda market.
Increasing Demand for Soap and Detergent
Hygiene-led urbanization across emerging economies is widening the soap and detergent aisle, where caustic soda forms the alkali backbone of saponification reactions. Volumes shipped to surfactant makers in Indonesia, Nigeria, and Vietnam rose in double digits in 2024, and premium food-grade caustic soda now secures a 12% pricing uplift over standard 50 wt% solutions. Specialty formulators request ultra-low iron and nickel specifications that cut discoloration in transparent soaps, nudging producers to invest in brine purification skids. The widening product mix-from anti-bacterial liquids to fabric-specific powders-keeps the caustic soda market diversified, cushioning cyclical downturns in heavy industry.
Volatile Electricity Prices in Europe
Electricity can represent 50% of cash costs for membrane electrolysis, and European day-ahead prices surged above EUR 90/MWh in early 2025, eroding margins Euro Chlor. Producers face indirect CO2 charges under the EU Emissions Trading Scheme, widening cost gaps versus Russian or Saudi exporters by up to USD 120 per ton. Compensation proposals under discussion could reimburse a share of these expenses, yet policy uncertainty curtails investment in new European capacity. Consequently, spot imports into north-west Europe rose 19% year-on-year in 2024, pressuring the regional caustic soda market.
Other drivers and restraints analyzed in the detailed report include:
- Surge in Viscose Staple Fiber Output in India
- Desalination Capacity Additions in the Middle East and Africa
- Energy-Intensive Production Process
For complete list of drivers and restraints, kindly check the Table Of Contents.
Segment Analysis
Its dominance stems from regulatory bans on mercury technology, notably the EU's final 2017 phase-out deadline, and from a 30% electricity-savings advantage relative to legacy cells. In addition, sodium chloride contamination can be held below 100 ppm, enabling high-purity grades for semiconductor production. Producers in China, the United States, and Germany are debottlenecking existing membrane lines by raising current density to 7 kA m-2, adding incremental tonnage without new brine circuits. A parallel investment wave is visible in Japan, where Asahi Kasei secured government backing in 2024 to expand membrane stack output for domestic chlor-alkali retrofits. Diaphragm and residual mercury capacity accounts for the balance of the caustic soda market.
Liquid caustic soda, typically shipped at 50 wt%, covered 65% of deliveries in 2024 while solid form is projected to rise at a 4.87% CAGR. Pipeline connectivity and bulk-truck handling make liquids the default for customers located within 300-500 km of a chlor-alkali plant, limiting freight costs to under USD 30 per ton. Liquid demand is particularly resilient among pulp and paper mills, oil refineries, and water utilities, where continuous dosing systems rely on standard 50 wt% feedstock. Solid forms-flakes, beads, and briquettes-meet long-haul, purity-critical, or small-batch needs. Although representing a smaller volume, solids fetch up to USD 120 per ton premiums owing to de-watering, prilling, and dust-suppression steps. Hydrite's 2025 launch of sealed-drum bead packaging cuts hygroscopic moisture pick-up and directly addresses end-user safety demands. Solid volumes grow mainly in electronics, pharmaceuticals, and textile dyeing, giving producers an avenue to lift margin in an otherwise commodity-like caustic soda market.
The Caustic Soda Market Report Segments the Industry by Production Process (Membrane Cell, Diaphragm Cell, and Other Processes), Form (Liquid and Solid), Concentration Grade (32 Wt%, 50 Wt%, and 73 Wt% and Higher), Applications (Pulp and Paper, Organic Chemicals, and More), and Geography (Asia-Pacific, North America, Europe, South America, and Middle East and Africa). The Market Forecasts are Provided in Terms of Volume (tons).
Geography Analysis
Asia-Pacific cemented its leadership with 64% of 2024 shipments. Chinese chlor-alkali plants recorded output near 41 million tons, even as exports dipped on softer European draws. Domestic consumption stayed buoyant thanks to aluminum and PVC expansions. India's caustic soda market gained momentum when Atul Products commissioned a 300 TPD facility in Valsad during 2024, complemented by captive 50 MW power that buffers electricity risk. Southeast Asian producers benefit from regional demand for soap, biodiesel, and battery precursors, building a springboard for cross-border pipeline projects that cut maritime freight exposure.
North America, holding a significant albeit smaller share, leverages shale-derived natural gas to enjoy one of the world's lowest electrolysis power costs, fostering competitive exports of both caustic soda and chlorine derivatives. OxyChem's 2024 restart of its 678 kt refrigeration-grade line in Texas bolsters domestic supply resilience. The region's forward pipeline includes PCC Group's planned 340 kt chlor-alkali unit at Chemours' DeLisle site, scheduled for commissioning in 2028. Such brownfield integrations anchor captive chlorine outlets while adding merchant caustic to a mature but technologically advanced caustic soda market.
Europe struggles under high and volatile energy prices. Despite hosting 76 manufacturing sites, capacity utilization dipped as spot electricity spikes pushed regional cash costs well above those in Russia or Saudi Arabia. Policymakers now debate indirect-cost compensation to avert carbon leakage and protect 35,000 direct jobs in the chlor-alkali chain. Nonetheless, European producers continue to court customers in electronics, pharmaceuticals, and food processing who insist on the continent's stringent quality protocols, preserving niche value despite broad cost pressures.
- AGC Inc.
- Atul Ltd
- BorsodChem (Wanhua Chemical Group)
- Covestro AG
- DCW Ltd.
- Dow
- Formosa Plastics Corporation
- GHCL Limited
- Grasim Industries Limited
- Gujarat Alkalies and Chemicals Limited
- Hanwha Solutions Corp.
- INEOS
- Nouryon
- Occidental Petroleum Corporation
- Olin Corporation
- SABIC
- Shin-Etsu Chemical Co. Ltd.
- Tata Chemicals Ltd.
- Tosoh Corporation
- Westlake Corporation
- Xinjiang Zhongtai Chemical Co. Ltd.
Additional Benefits:
- The market estimate (ME) sheet in Excel format
- 3 months of analyst support
TABLE OF CONTENTS
1 Introduction
- 1.1 Study Assumptions and Market Definition
- 1.2 Scope of the Study
2 Research Methodology
3 Executive Summary
4 Market Landscape
- 4.1 Market Overview
- 4.2 Market Drivers
- 4.2.1 Accelerated alumina refinery expansions in Asia boosting caustic demand
- 4.2.2 Increasing Demand for Soap and Detergent
- 4.2.3 Surge in viscose staple fiber output in India
- 4.2.4 Desalination capacity additions in the Middle East and Africa
- 4.2.5 EU-mandated switch to membrane cells driving upgrade projects
- 4.3 Market Restraints
- 4.3.1 Volatile electricity prices in Europe
- 4.3.2 Energy-intensive Production Process
- 4.3.3 Availability of substitutes in Various End User Industries
- 4.4 Value Chain Analysis
- 4.5 Technological Outlook
- 4.6 Price Overview
- 4.7 Trade Overview
- 4.8 Porter's Five Forces
- 4.8.1 Bargaining Power of Suppliers
- 4.8.2 Bargaining Power of Buyers
- 4.8.3 Threat of New Entrants
- 4.8.4 Threat of Substitutes
- 4.8.5 Degree of Competition
5 Market Size and Growth Forecasts ( Volume)
- 5.1 By Production Process
- 5.1.1 Membrane Cell
- 5.1.2 Diaphragm Cell
- 5.1.3 Other Processes
- 5.2 By Form
- 5.2.1 Liquid
- 5.2.2 Solid
- 5.3 By Concentration Grade
- 5.3.1 32 wt%
- 5.3.2 50 wt%
- 5.3.3 73 wt% and Higher
- 5.4 By Application
- 5.4.1 Pulp and Paper
- 5.4.2 Organic Chemicals
- 5.4.3 Inorganic Chemicals
- 5.4.4 Soap and Detergent
- 5.4.5 Alumina
- 5.4.6 Water Treatment
- 5.4.7 Textile (Viscose Fibre, Dyeing)
- 5.4.8 Others (Food and Pharmaceutical Processing, Mining and metallurgy)
- 5.5 By Geography
- 5.5.1 Asia-Pacific
- 5.5.1.1 China
- 5.5.1.2 India
- 5.5.1.3 Japan
- 5.5.1.4 South Korea
- 5.5.1.5 ASEAN
- 5.5.1.6 Rest of Asia-Pacific
- 5.5.2 North America
- 5.5.2.1 United States
- 5.5.2.2 Canada
- 5.5.2.3 Mexico
- 5.5.3 Europe
- 5.5.3.1 Germany
- 5.5.3.2 United Kingdom
- 5.5.3.3 Italy
- 5.5.3.4 France
- 5.5.3.5 Nordics
- 5.5.3.6 Rest of Europe
- 5.5.4 South America
- 5.5.4.1 Brazil
- 5.5.4.2 Argentina
- 5.5.4.3 Rest of South America
- 5.5.5 Middle East and Africa
- 5.5.5.1 Saudi Arabia
- 5.5.5.2 United Arab Emirates
- 5.5.5.3 Turkey
- 5.5.5.4 South Africa
- 5.5.5.5 Egypt
- 5.5.5.6 Rest of Middle East and Africa
- 5.5.1 Asia-Pacific
6 Competitive Landscape
- 6.1 Market Concentration
- 6.2 Strategic Moves
- 6.3 Market Share(%)/ Ranking Analysis
- 6.4 Company Profiles {(includes Global level Overview, Market level overview, Core Segments, Financials as available, Strategic Information, Market Rank/Share for key companies, Products and Services, and Recent Developments)}
- 6.4.1 AGC Inc.
- 6.4.2 Atul Ltd
- 6.4.3 BorsodChem (Wanhua Chemical Group)
- 6.4.4 Covestro AG
- 6.4.5 DCW Ltd.
- 6.4.6 Dow
- 6.4.7 Formosa Plastics Corporation
- 6.4.8 GHCL Limited
- 6.4.9 Grasim Industries Limited
- 6.4.10 Gujarat Alkalies and Chemicals Limited
- 6.4.11 Hanwha Solutions Corp.
- 6.4.12 INEOS
- 6.4.13 Nouryon
- 6.4.14 Occidental Petroleum Corporation
- 6.4.15 Olin Corporation
- 6.4.16 SABIC
- 6.4.17 Shin-Etsu Chemical Co. Ltd.
- 6.4.18 Tata Chemicals Ltd.
- 6.4.19 Tosoh Corporation
- 6.4.20 Westlake Corporation
- 6.4.21 Xinjiang Zhongtai Chemical Co. Ltd.
7 Market Opportunities and Future Outlook
- 7.1 Rising Demand for Sodium-Ion Batteries Sector
- 7.2 Increasing Demand for Energy-efficient Production Processes
- 7.3 White-space and Unmet-need Assessment
 苛性钠市场分析及预测(至2035年):类型、产品类型、应用、最终用户、技术、形态、製程、安装类型、组件
 全球苛性钠市场规模、份额、趋势和成长分析报告(2026-2034)
 2026年全球苛性钠市场报告
 按产量、产品类型、应用和最终用途苛性钠和尿素市场-2026年至2032年全球预测
 欧洲苛性钠:市场占有率分析、产业趋势、统计数据和成长预测(2026-2031)
 按应用和地区苛性钠市场规模、份额和成长分析 - 2026-2033 年产业预测
 全球苛性钠市场预测至2032年:依生产流程、形态、等级、通路、应用及地区分類的分析全球苛性钠市场预测(按製造流程、形态、纯度、应用和分销管道)2025-2030
 苛性钠市场规模、份额、趋势分析报告:按应用、地区、细分市场、预测,2025 年至 2033 年
 苛性钠的印度市场:不同生产过程,各类型,各用途,各地区,机会,预测,2019年~2033年