


 |
市场调查报告书
商品编码
1836642
绿色和生物基溶剂:市场份额分析、行业趋势、统计数据和成长预测(2025-2030)Green And Bio-based Solvents - Market Share Analysis, Industry Trends & Statistics, Growth Forecasts (2025 - 2030) |
||||||
※ 本网页内容可能与最新版本有所差异。详细情况请与我们联繫。
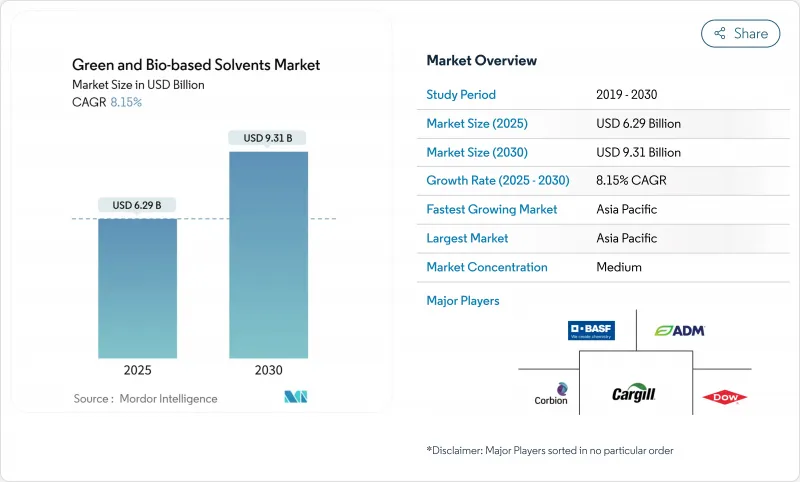
预计 2025 年绿色和生物基溶剂市场规模为 62.9 亿美元,到 2030 年将达到 93.1 亿美元,预测期内(2025-2030 年)的复合年增长率为 8.15%。
挥发性有机化合物(VOC)排放法规的收紧、原油价格的波动以及企业广泛的永续性目标,正在促使用户逐渐放弃石油基溶剂。可再生原料的不断增长降低了长期供应风险,税额扣抵也推动了需求的成长。由于中国和印度的工业快速成长和雄心勃勃的绿色化学政策的交汇,亚太地区对新增产能的影响力最大。
全球绿色和生物基溶剂市场趋势和见解
严格的VOC排放法规
监管机构正在加强对被覆剂、黏合剂和消费品中溶剂的限制。加拿大2024年的法规涵盖130个产品类别,加上欧盟限制持久性和危险物质的REACH更新,迫使配方设计师重新设计其产品线。替代方案有利于生物醇和酯类,它们符合相同的性能规格,且不违反新的VOC法规。欧盟的《化学品永续性战略》正在扩大危险物质限制的范围,进一步强化了这个政策趋势。
原油价格波动刺激生物替代品的成长
2024年,原油价格多次以两位数成长,缩小了生物溶剂与石油基溶剂之间的成本差距。许多买家对此作出回应,制定了双重采购条款,当原油价格超过预设阈值时,自动切换到替代来源。美国废油进口量翻了一番,证明即使在原油价格下跌的情况下,低碳废弃物原料也能维持价格优势。价格对冲策略降低了营运资金波动,使长期生物溶剂合约对采购经理更具吸引力。供应商从中得到的教训显而易见:成本竞争力如今不仅取决于绝对生产成本,也同样取决于对原料价差风险的管理。
生产成本上升
发酵反应器、昂贵的净化步骤以及较低的工厂运转率,使得生物溶剂的成本曲线与传统石油基溶剂相比处于不利地位。近期的製程现代化已将生物丙二醇的转换成本降低了25%,但在奖励机制较为宽鬆的地区之外,这一差距仍然很大。许多製造商正在寻求将生物溶剂与更高价值的产品结合,将固定成本分摊到多个收益来源中,从而实现经济效益。还有一些製造商正在设计直接替代型分子,使客户无需重新设计下游工艺,从而降低总转换成本。在棕地石化资产转化取得进展之前,绿色和生物基溶剂市场将面临选择性价格阻力,尤其是在商品化应用领域。
报告中分析的其他驱动因素和限制因素
- 企业 ESG 承诺与绿色采购要求
- 增加政府激励措施和税额扣抵
- 原物料供应和农产品价格的波动;
細項分析
2024年,生物酒精将成为最大的收益来源,占绿色和生物基溶剂市场的37.2%。成熟的乙醇发酵槽、广泛的农业原料供应以及灵活的下游调配生产线支撑了这一地位。乳酸乙酯的复合年增长率为9.56%,凸显了其向利基分子转型的趋势,该分子具有优异的溶解性和生物降解性,在药物合成和电子级清洁领域备受推崇。
区域分析
亚太地区将引领绿色和生物基溶剂市场,2024 年的营收份额将达到 45.2%,到 2030 年的最高复合年增长率将达到 8.77%。中国的双碳战略迫使炼油厂和下游树脂製造商抑制 VOC 排放,直接吸引人们使用可再生溶剂。
北美受益于联邦和州严格的空气品质法规以及成熟的生质燃料基础设施。欧洲则以其雄心勃勃的政策脱颖而出: 《绿色新政》、《循环经济行动计画》和国家塑胶税均支持可再生溶剂。
南美和非洲虽然收益仍然较小,但由于其原料供应廉价且环保意识日益增强,具有长期价值。然而,产能扩张依赖于监管的清晰度和基础设施的升级,而这两个地区都落后于领先地区。
其他福利:
- Excel 格式的市场预测 (ME) 表
- 3个月的分析师支持
目录
第一章 引言
- 研究假设和市场定义
- 调查范围
第二章调查方法
第三章执行摘要
第四章 市场状况
- 市场概况
- 市场驱动因素
- 严格的VOC排放法规
- 原油价格波动推动生质燃料
- 企业 ESG 承诺与绿色采购要求
- 增加政府对生化产品的诱因和税额扣抵
- 可再生原料的全球扩张
- 市场限制
- 生产成本上升
- 原物料供应不稳定,农产品价格波动
- 与传统溶剂回收设备的兼容性有限
- 价值链分析
- 技术展望
- 专利分析
- 五力分析
- 供应商的议价能力
- 买方的议价能力
- 新进入者的威胁
- 替代品的威胁
- 竞争程度
第五章 市场规模及成长预测(金额)
- 按类型
- 生物酒精
- 生质乙醇
- 生物甲醇
- 生物丙醇
- 生物丁醇
- 生物乙二醇
- 生物丙二醇
- 生物乙二醇
- 生物二醇
- 乳酸乙酯
- D-柠檬烯
- 大豆油甲酯
- 其他类型
- 生物酒精
- 按用途
- 油漆和涂料
- 工业和家庭清洁
- 印刷油墨
- 黏合剂和密封剂
- 製药
- 化妆品和个人护理
- 农业
- 其他用途
- 按最终用户产业
- 车
- 建造
- 製药和医疗保健
- 饮食
- 消费品
- 农业
- 电子产品
- 其他的
- 按地区
- 亚太地区
- 中国
- 印度
- 日本
- 韩国
- 亚太地区其他国家
- 北美洲
- 美国
- 加拿大
- 墨西哥
- 欧洲
- 德国
- 英国
- 法国
- 义大利
- 其他欧洲国家
- 南美洲
- 巴西
- 阿根廷
- 其他南美
- 中东和非洲
- 沙乌地阿拉伯
- 南非
- 其他中东和非洲地区
- 亚太地区
第六章 竞争态势
- 市场集中度
- 策略趋势
- 市占率分析
- 公司简介
- ADM
- BASF
- Bio Brands LLC
- Bioeutectics
- Braskem
- Cargill, Incorporated
- Corbion
- Covation Biomaterials
- Dow
- Elevance Renewable Sciences Inc.
- Florachem Corp.
- Florida Chemical Company
- Galactic
- Gevo
- GFBIOCHEMICALS
- LyondellBasell Industries Holdings BV
- Merck
- Peter Cremer Holding GmbH & Co. KG
- Sekab
- Solvay
- Vertec BioSolvents Inc.
第七章 市场机会与未来展望
The Green And Bio-based Solvents Market size is estimated at USD 6.29 billion in 2025, and is expected to reach USD 9.31 billion by 2030, at a CAGR of 8.15% during the forecast period (2025-2030).
Tightening VOC-emission rules, crude-oil price swings, and broad corporate sustainability targets are pushing users to switch away from petroleum-based solvents. Demand also gains from a widening pool of renewable feedstocks that lowers long-term supply risk and from expanding tax credits that offset part of the still-higher production costs. Asia Pacific supplies the strongest pull on new volumes because rapid industrial growth intersects with ambitious green-chemistry policies in China and India.
Global Green And Bio-based Solvents Market Trends and Insights
Stringent VOC-emission Regulations
Regulatory agencies are tightening solvent rules across coatings, adhesives, and consumer products. Canada's 2024 limits cover 130 product classes and pair with EU REACH updates that restrict persistent and toxic substances, forcing formulators to redesign product lines. Replacement programs favor bio-alcohols and esters that meet the same performance specs without breaching new VOC caps. The policy tilt is reinforced by the EU Chemicals Strategy for Sustainability, which is widening the scope of hazardous-substance restrictions.
Volatility in Crude-oil Prices Fueling Bio-alternatives
Crude benchmarks jumped by double-digit percentages several times in 2024, narrowing the cost gap between bio-solvents and petro-solvents. Many buyers responded by writing dual-sourcing clauses that trigger automatic substitution when oil surpasses pre-set thresholds. Waste-oil imports into the United States doubled, proving that low-carbon waste feedstocks can hold price advantages even when crude oil eases. Price-hedge strategies reduce working-capital swings, making long-term contracts for bio-solvents more attractive to purchasing managers. The lesson for suppliers is clear: cost competitiveness now depends as much on managing feedstock spread risk as on absolute production costs.
Higher Production Costs
Fermentation reactors, costly purification steps, and lower plant utilization rates still give bio-solvents an unfavorable cost curve versus entrenched petro-equivalents. Recent process modernization trimmed bio-propylene glycol conversion costs by 25%, but the gap remains material outside incentive-rich jurisdictions. Many producers solve for economy by pairing bio-solvents with higher-value co-products, spreading fixed costs across multiple revenue streams. Others design drop-in molecules that allow customers to avoid re-tooling downstream processes, thereby lowering total cost of change. Until more brownfield petro-chemical assets convert, the green and bio-based solvents market faces selective price resistance, particularly in commoditized applications.
Other drivers and restraints analyzed in the detailed report include:
- Corporate ESG Pledges and Green Procurement Mandates
- Increasing Government Incentives and Tax Credits
- Feedstock Supply Volatility and Agri-price Swings
For complete list of drivers and restraints, kindly check the Table Of Contents.
Segment Analysis
Bio-alcohols generated the largest revenue slice in 2024, taking a 37.2% share of the green and bio-based solvents market. Mature ethanol fermenters, widespread agricultural feedstock supply, and flexible downstream blending lines support this position. Ethyl lactate's 9.56% CAGR underscores the pivot into niche molecules with superior solvency power and biodegradability, attributes prized in pharmaceutical synthesis and electronic-grade cleaning.
The Green and Bio-Based Solvents Market Report Segments the Industry by Type (Bio-Alcohols, Bio-Glycols, Bio-Diols, and More), Application (Paints and Coatings, Industrial and Domestic Cleaning, Printing Inks, Adhesives and Sealants, and More), End-User Industry (Automotive, Construction, Agriculture, and More), and Geography (Asia-Pacific, North America, Europe, South America, and Middle-East and Africa).
Geography Analysis
Asia Pacific led the green and bio-based solvents market with a 45.2% revenue share in 2024 and posts the highest 8.77% CAGR through 2030. China's dual-carbon strategy forces refineries and downstream resin producers to curb VOC releases, creating immediate pull for renewable solvents.
North America benefits from the intersection of strict federal and state air-quality rules and a mature biofuel infrastructure. Europe stands out for policy ambition. The Green Deal, the Circular Economy Action Plan, and country-level plastic taxes all favor renewable solvents.
South America and Africa remain smaller in revenue but hold long-run value because they combine cheap feedstock availability with rising environmental awareness. Capacity build-outs, however, depend on regulatory clarity and infrastructure upgrades, both of which lag the front-runner regions.
- ADM
- BASF
- Bio Brands LLC
- Bioeutectics
- Braskem
- Cargill, Incorporated
- Corbion
- Covation Biomaterials
- Dow
- Elevance Renewable Sciences Inc.
- Florachem Corp.
- Florida Chemical Company
- Galactic
- Gevo
- GFBIOCHEMICALS
- LyondellBasell Industries Holdings B.V.
- Merck
- Peter Cremer Holding GmbH & Co. KG
- Sekab
- Solvay
- Vertec BioSolvents Inc.
Additional Benefits:
- The market estimate (ME) sheet in Excel format
- 3 months of analyst support
TABLE OF CONTENTS
1 Introduction
- 1.1 Study Assumptions and Market Definition
- 1.2 Scope of the Study
2 Research Methodology
3 Executive Summary
4 Market Landscape
- 4.1 Market Overview
- 4.2 Market Drivers
- 4.2.1 Stringent VOC-emission regulations
- 4.2.2 Volatility in crude-oil prices fuelling bio-alternatives
- 4.2.3 Corporate ESG pledges and green procurement mandates
- 4.2.4 Increasing Government incentives and tax credits for bio-chemicals
- 4.2.5 Global Expansion of Renewable Feedstock Availability
- 4.3 Market Restraints
- 4.3.1 Higher production costs
- 4.3.2 Feed-stock supply volatility and agri-price swings
- 4.3.3 Limited compatibility with legacy solvent-recovery units
- 4.4 Value Chain Analysis
- 4.5 Technological Outlook
- 4.6 Patent Analysis
- 4.7 Porter's Five Forces
- 4.7.1 Bargaining Power of Suppliers
- 4.7.2 Bargaining Power of Buyers
- 4.7.3 Threat of New Entrants
- 4.7.4 Threat of Substitutes
- 4.7.5 Degree of Competition
5 Market Size and Growth Forecasts (Value)
- 5.1 By Type
- 5.1.1 Bio-alcohols
- 5.1.1.1 Bio-ethanol
- 5.1.1.2 Bio-methanol
- 5.1.1.3 Bio-propanol
- 5.1.1.4 Bio-butanol
- 5.1.2 Bio-glycols
- 5.1.2.1 Bio-based Propylene Glycol
- 5.1.2.2 Bio-based Ethylene Glycol
- 5.1.3 Bio-diols
- 5.1.4 Ethyl Lactate
- 5.1.5 D-Limonene
- 5.1.6 Methyl Soyate
- 5.1.7 Other Types
- 5.1.1 Bio-alcohols
- 5.2 By Application
- 5.2.1 Paints and Coatings
- 5.2.2 Industrial and Domestic Cleaning
- 5.2.3 Printing Inks
- 5.2.4 Adhesives and Sealants
- 5.2.5 Pharmaceuticals
- 5.2.6 Cosmetics and Personal Care
- 5.2.7 Agriculture
- 5.2.8 Other Applications
- 5.3 By End-User Industry
- 5.3.1 Automotive
- 5.3.2 Construction
- 5.3.3 Pharmaceutical and Healthcare
- 5.3.4 Food and Beverages
- 5.3.5 Consumer Goods
- 5.3.6 Agriculture
- 5.3.7 Electronics
- 5.3.8 Others
- 5.4 By Geography
- 5.4.1 Asia Pacific
- 5.4.1.1 China
- 5.4.1.2 India
- 5.4.1.3 Japan
- 5.4.1.4 South Korea
- 5.4.1.5 Rest of APAC
- 5.4.2 North America
- 5.4.2.1 United States
- 5.4.2.2 Canada
- 5.4.2.3 Mexico
- 5.4.3 Europe
- 5.4.3.1 Germany
- 5.4.3.2 United Kingdom
- 5.4.3.3 France
- 5.4.3.4 Italy
- 5.4.3.5 Rest of Europe
- 5.4.4 South America
- 5.4.4.1 Brazil
- 5.4.4.2 Argentina
- 5.4.4.3 Rest of South America
- 5.4.5 Middle East and Africa
- 5.4.5.1 Saudi Arabia
- 5.4.5.2 South Africa
- 5.4.5.3 Rest of Middle East and Africa
- 5.4.1 Asia Pacific
6 Competitive Landscape
- 6.1 Market Concentration
- 6.2 Strategic Moves
- 6.3 Market Share Analysis
- 6.4 Company Profiles (includes Global level Overview, Market level overview, Core Segments, Financials as available, Strategic Information, Market Rank/Share for key companies, Products and Services, and Recent Developments)
- 6.4.1 ADM
- 6.4.2 BASF
- 6.4.3 Bio Brands LLC
- 6.4.4 Bioeutectics
- 6.4.5 Braskem
- 6.4.6 Cargill, Incorporated
- 6.4.7 Corbion
- 6.4.8 Covation Biomaterials
- 6.4.9 Dow
- 6.4.10 Elevance Renewable Sciences Inc.
- 6.4.11 Florachem Corp.
- 6.4.12 Florida Chemical Company
- 6.4.13 Galactic
- 6.4.14 Gevo
- 6.4.15 GFBIOCHEMICALS
- 6.4.16 LyondellBasell Industries Holdings B.V.
- 6.4.17 Merck
- 6.4.18 Peter Cremer Holding GmbH & Co. KG
- 6.4.19 Sekab
- 6.4.20 Solvay
- 6.4.21 Vertec BioSolvents Inc.
7 Market Opportunities and Future Outlook
- 7.1 White-space and Unmet-Need Assessment

