


 |
市场调查报告书
商品编码
1836645
高性能电动车:市场份额分析、行业趋势、统计数据和成长预测(2025-2030 年)Automotive High Performance Electric Vehicles - Market Share Analysis, Industry Trends & Statistics, Growth Forecasts (2025 - 2030) |
||||||
※ 本网页内容可能与最新版本有所差异。详细情况请与我们联繫。
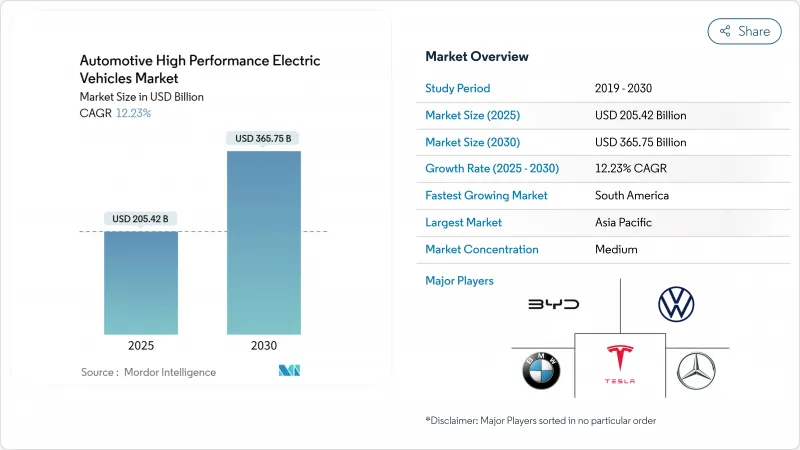
高性能电动车市场规模预计在 2025 年为 2,054.2 亿美元,预计到 2030 年将达到 3,657.5 亿美元,预测期内(2025-2030 年)的复合年增长率为 12.23%。
高性能电动车市场预计将持续保持两位数成长,这得益于电池组成本的持续下降、800V平台的快速普及以及三电机和四电机车型的兴起。消费者对兼具近乎静音驾驶和超级跑车级加速性能的汽车的兴趣正在增强高端车型的定价能力,而各国政府则正在利用零排放强制规定和购车补贴来刺激需求。
全球高性能电动车市场趋势与洞察
电池成本下降和800V的采用
随着特斯拉4680系列产品线投入量产,中国供应商实现6C充电包商业化,以及电池包级成本结构实现两位数缩减,NMC和NCA电芯价格将在2025年保持在90千瓦时以下。保时捷Taycan率先采用的800伏特架构现已渗透至高端市场,将直流快速充电器的数量减少了40%,并实现了更轻的线缆,以抵消增加的马达重量。英飞凌和Wolfspeed的碳化硅MOSFET逆变器降低了三马达和四马达布局中的开关损耗,支援10分钟充满电且不会出现热性能下降。这些共同效应将推动高性能电动车市场在维持高功率的同时,进一步提升其价格承受能力。
政府奖励和排放控制
美国《通膨削减法案》规定每辆车最高可获得7,500美元的津贴,政府退税则额外降低了15,000美元的实际交易价格。欧盟的「Fit-for-55」(适合55岁)计画规定,到2030年,车辆平均二氧化碳排放量将减少55%,这迫使汽车製造商专注于生产高性能电动车,以抵消剩余的内燃机汽车产量。中国的双积分计画使比亚迪在2024年实现了427万辆汽车的出货量,两年内电动车数量增加了一倍多。
温度控管限制
目前的锂离子电池组在60°C以上时容量会迅速衰减,而多重马达配置的极端工作循环会在几分钟内将电池单元推至此温度阈值。液体冷却板、相变复合材料和基于冷媒的冷却器会增加成本、重量和服务复杂性。在波斯湾地区,夏季环境温度在硬启动期间已导致续航里程缩短高达20%。原始设备製造商正在探索结构冷却和浸没式冷却方法,但短期资本投资仍然是高性能电动车市场发展的一大障碍。
报告中分析的其他驱动因素和限制因素
- 超快充走廊
- 卡车用 SiC 逆变器
- 稀土价格风险
細項分析
到2024年,纯电动车将占71.27%的收益,证实了买家对纯电动驱动和简化传动系统的偏好。纯电动车的优势在于瞬时扭力和精准的功率调节,小米SU7至尊版在纽柏林赛道的标竿圈速就反映了这一点。这一细分市场也受惠于低维护成本和无线效能调校。同时,插电式混合动力车的复合年增长率高达13.26%,对缺乏350kW公共充电桩的地区爱好者极具吸引力。
在欧洲,更严格的二氧化碳排放平均值使得插电式混合动力车(PHEV)在合规方面更具吸引力,高阶车型整合了赛道导向的电动增压模式,可提供持续的单圈性能。德国和英国的税收制度有利于企业车队使用插电式混合动力车,从而鼓励高阶主管购买。
到2024年,乘用车将占据高性能电动车市场84.74%的份额,其中运动型轿车和豪华SUV将超越传统超级跑车。落地式电池降低了重心,扭力向量控制则提升了操控性,使梅赛德斯-AMG、宝马M和奥迪运动版车型能够实现0-60英里/小时加速时间低于3秒,并兼具四门版的实用性。客户愿意为软体解锁的附加功能付费,这进一步提升了净利率。
以性能为导向的皮卡和送货车为主导的商用车,到2030年将达到12.75%的复合年增长率。车队管理者看重扭矩,以提升牵引力和负载容量,同时也能从更低的燃油和服务成本中受益。 Rivian的R1T和福特的F-150 Lightning证明了,主力车队可以从专为极端使用而设计的推进系统中获得更高的价值。随着工作週期资料被用于预测性维护,残值将会提升,从而吸引机构资本进入高性能电动车市场。
区域分析
2024年,亚太地区将占46.85%的销售份额,其中中国将占据主导地位。日本仍偏向混合动力车,但韩国和澳洲由于扩大购车返利政策以及350千瓦高速公路充电桩的部署,实现了两位数的成长。一体化供应链正在整合该地区的电池、逆变器和晶片供应商,从而缩短了前置作业时间,并确保了该地区高性能电动车市场的结构性价格优势。
在公私合作的支持下,欧洲的纯电动车销量在2024年暴跌后,于2025年第一季復苏,成长约30%。受益于残值担保和公共方程式赛车的技术溢出效应,德国和英国均实现了小幅成长。墨西哥计划于2030年建成的微型电动车中心将整合北美自由贸易组织(NAFTA)的内容规则和低廉的劳动力成本,以创造一个持续的供应带,从而增强区域竞争力。这种本地化建设趋势符合国家安全理念,可以保护高性能电动车市场免受远端供应中断的影响。
预计南美的复合年增长率将达到13.17%,该地区电动车註册量到2024年将翻倍。巴西已下调进口关税,以加速国内组装计划,巴拉圭则着眼于水力发电电池级锂离子电池业务。然而,大都市以外的充电普及率仍然较低,车队优先考虑在停车场充电。随着可再生能源发电的扩张,高性能电动车市场应该会为瞄准高端进口车的清洁能源品牌找到肥沃的土壤。
其他福利:
- Excel 格式的市场预测 (ME) 表
- 3个月的分析师支持
目录
第一章 引言
- 研究假设和市场定义
- 调查范围
第二章调查方法
第三章执行摘要
第四章 市场状况
- 市场概况
- 市场驱动因素
- 电池成本下降和800V的采用
- 政府奖励和排放控制
- 超快充走廊
- 卡车用 SiC 逆变器
- Halo 专为纯电动车赛车设计
- OTA性能改进收益
- 市场限制
- 温度控管限制
- 稀土价格风险
- 保险费上涨
- 兆瓦级充电桩的电网瓶颈
- 价值/供应链分析
- 监管状况
- 技术展望
- 波特五力分析
- 新进入者的威胁
- 买家/消费者的议价能力
- 供应商的议价能力
- 替代品的威胁
- 竞争对手之间的竞争
- 投资/融资趋势
第五章市场规模与成长预测:价值(美元)
- 按驱动类型
- 纯电动车 (BEV)
- 插电式混合动力车(PHEV)
- 按车辆类型
- 搭乘用车
- 商用车
- 依马达类型
- 永磁同步型
- 就职
- 开关磁阻
- 轴流
- 按电池化学
- 锂离子(NMC/NCA)
- 磷酸锂铁(LFP)
- 固体/固体
- 按动力传动系统架构
- 单马达FR
- 双马达全轮驱动
- 三/四马达全轮驱动
- 按地区
- 北美洲
- 美国
- 加拿大
- 北美其他地区
- 南美洲
- 巴西
- 阿根廷
- 其他南美
- 欧洲
- 德国
- 英国
- 法国
- 义大利
- 西班牙
- 俄罗斯
- 其他欧洲国家
- 亚太地区
- 中国
- 日本
- 印度
- 韩国
- 澳洲
- 其他亚太地区
- 中东和非洲
- 阿拉伯聯合大公国
- 沙乌地阿拉伯
- 南非
- 土耳其
- 其他中东和非洲地区
- 北美洲
第六章 竞争态势
- 市场集中度
- 策略趋势
- 市占率分析
- 公司简介
- Tesla
- BYD Auto
- Volkswagen Group
- BMW Group
- Mercedes-Benz Group
- General Motors
- Ford Motor Company
- Stellantis NV
- Hyundai Motor Group
- Toyota Motor Corporation
- Nissan Motor Co.
- Lucid Group
- Rivian Automotive
- Rimac Automobili
第七章 市场机会与未来展望
The Automotive High Performance Electric Vehicles Market size is estimated at USD 205.42 billion in 2025, and is expected to reach USD 365.75 billion by 2030, at a CAGR of 12.23% during the forecast period (2025-2030).
Continued cost declines in battery packs, rapid 800 V platform diffusion, and a new wave of tri- and quad-motor models position the automotive high performance EVs market for sustained double-digit expansion. Consumer interest in vehicles that deliver both near-silent operation and super-car-level acceleration is reinforcing premium pricing power, while governments use zero-emission mandates and purchase subsidies to pull forward demand.
Global Automotive High Performance Electric Vehicles Market Trends and Insights
Battery Cost Decline & 800 V Adoption
NMC and NCA cell prices continued falling below USD 90 kWh in 2025 as Tesla's 4680 line hit volume production and Chinese suppliers commercialized 6C-charge packs, shrinking pack-level cost structures by double digits. Eight-hundred-volt architectures pioneered by the Porsche Taycan now permeate premium segments, slicing DC fast-charge sessions by 40% and allowing lighter cabling that offsets added motor mass. Silicon-carbide MOSFET inverters from Infineon and Wolfspeed drop switching losses for tri- and quad-motor layouts, supporting 10-minute full charges without thermal derate. The combined effect propels the automotive high performance EVs market toward broader affordability while sustaining ultra-high power outputs.
Government Incentives & Emission Norms
The U.S. Inflation Reduction Act grants up to USD 7,500 per vehicle, complemented by state rebates that trim effective transaction prices by as much as USD 15,000. The European Union's Fit-for-55 package legally binds a 55% fleet-average CO2 cut by 2030, compelling OEMs to lean into high performance EV volume to counterbalance residual ICE output. China's dual-credit regime pushed BYD deliveries to 4.27 million units in 2024, more than doubling its EV tally in two years.
Thermal-management Limits
Current lithium-ion packs lose capacity rapidly above 60 °C, and extreme duty cycles in multi-motor setups can push cells to these thresholds in minutes. Liquid-cooling plates, phase-change composites, and refrigerant-based chillers add cost, weight, and service complexity. In the Persian Gulf, summer ambient temperatures already trim real-world range by up to 20% during spirited driving. OEMs are exploring structural cooling and immersion methods, yet short-term capex remains a hurdle for the automotive high performance EVs market.
Other drivers and restraints analyzed in the detailed report include:
- Ultra-fast Charging Corridors
- SiC Inverters for Track Duty
- Rare-earth Price Risk
For complete list of drivers and restraints, kindly check the Table Of Contents.
Segment Analysis
Battery Electric Vehicles secured 71.27% of 2024 revenue, underscoring buyer preference for pure-electric thrust and simplified drivetrains. BEVs exploit instant torque and finer power modulation, exemplified by the Xiaomi SU7 Ultra's Nurburgring benchmark lap. The segment also benefits from lighter maintenance demand and OTA-driven performance tuning. Meanwhile, Plug-in Hybrid Electric Vehicles are expanding at a 13.26% CAGR, appealing to enthusiasts in regions where 350 kW public chargers remain scarce.
Europe's stricter CO2 fleet averages make PHEVs attractive for compliance, and premium marques integrate track-oriented electric boost modes that deliver sustained lap performance. Tax regimes in Germany and the U.K. favor PHEVs for company fleets, propelling adoption among executive buyers.
Passenger cars commanded 84.74% of 2024 revenue of the automotive high performance EVs market size, propelled by sports sedans and luxury SUVs that now out-accelerate legacy supercars. Battery floor mounting drops centers of gravity, and torque vectoring enhances handling, enabling Mercedes-AMG, BMW M, and Audi Sport to offer sub-3-second 0-60 mph times with four-door practicality. Customer willingness to pay for software-unlock extras further fortifies margins.
Commercial vehicles, led by performance-oriented pickups and delivery vans, record a 12.75% CAGR through 2030. Fleet managers appreciate torque for towing and payload while benefiting from lower fuel and service bills. Rivian's R1T and Ford's F-150 Lightning prove that workhorse fleets can extract premium value from propulsion systems designed for extremes. As duty-cycle data feeds predictive maintenance, residuals improve, inviting institutional capital into the automotive high performance EVs market.
The Automotive High Performance EVs Market Report is Segmented by Drive Type (Battery Electric and Plug-In Hybrid Electric), Vehicle Type (Passenger Cars and Commercial Vehicles), Motor Type (Permanent-Magnet Synchronous, Induction, and More), Battery Chemistry (Lithium-Ion (NMC/NCA) and More), Powertrain Architecture (Single-Motor RWD and More), and Geography. The Market Forecasts are Provided in Terms of Value (USD).
Geography Analysis
Asia-Pacific dominated with 46.85% 2024 revenue share, anchored by China where electric vehicles are slated to reach 60% of total light-duty sales in 2025. Japan remains hybrid-skewed, yet South Korea and Australia witness double-digit growth under expanded purchase rebates and 350 kW highway charger deployments. Integrated supply chains allow battery, inverter, and chip suppliers to co-locate, compressing lead times and securing a structural price edge for the automotive high performance EVs market in the region.
Europe rebounded with around 30% BEV sales growth in Q1 2025 after a 2024 plateau, supported by joint public-private funding that targets one million public charge points by 2030. Germany and the U.K. posted a decent respective gains, benefiting from residual-value guarantees and Formula E technology spillovers. Mexico's planned mini-EV hub for 2030 integrates NAFTA content rules and low labor costs, creating a contiguous supply belt that reinforces regional competitiveness. Such build-local trends align with national security narratives, shielding the automotive high performance EVs market from distant supply disruptions.
South America delivered the fastest 13.17% CAGR outlook as Latin American EV registrations doubled units in 2024. Uruguay tops regional per-capita adoption; Brazil cut import tariffs to accelerate domestic assembly programs, and Paraguay eyes battery-grade lithium business anchored on hydropower. Yet charging coverage remains patchy outside capital corridors, prompting fleets to prioritize depot-based operations. As renewable generation expands, the automotive high performance EVs market should find fertile ground in clean-energy branding for premium imports.
- Tesla
- BYD Auto
- Volkswagen Group
- BMW Group
- Mercedes-Benz Group
- General Motors
- Ford Motor Company
- Stellantis NV
- Hyundai Motor Group
- Toyota Motor Corporation
- Nissan Motor Co.
- Lucid Group
- Rivian Automotive
- Rimac Automobili
Additional Benefits:
- The market estimate (ME) sheet in Excel format
- 3 months of analyst support
TABLE OF CONTENTS
1 Introduction
- 1.1 Study Assumptions & Market Definition
- 1.2 Scope of the Study
2 Research Methodology
3 Executive Summary
4 Market Landscape
- 4.1 Market Overview
- 4.2 Market Drivers
- 4.2.1 Battery cost decline & 800 V adoption
- 4.2.2 Government incentives & emission norms
- 4.2.3 Ultra-fast charging corridors
- 4.2.4 SiC inverters for track duty
- 4.2.5 EV-only racing halo
- 4.2.6 OTA performance-upgrade revenue
- 4.3 Market Restraints
- 4.3.1 Thermal-management limits
- 4.3.2 Rare-earth price risk
- 4.3.3 Insurance-premium spike
- 4.3.4 Grid bottlenecks for MW chargers
- 4.4 Value/Supply-Chain Analysis
- 4.5 Regulatory Landscape
- 4.6 Technological Outlook
- 4.7 Porter's Five Forces Analysis
- 4.7.1 Threat of New Entrants
- 4.7.2 Bargaining Power of Buyers/Consumers
- 4.7.3 Bargaining Power of Suppliers
- 4.7.4 Threat of Substitute Products
- 4.7.5 Intensity of Competitive Rivalry
- 4.8 Investment & Funding Trends
5 Market Size & Growth Forecasts (Value (USD))
- 5.1 By Drive Type
- 5.1.1 Battery Electric (BEV)
- 5.1.2 Plug-in Hybrid Electric (PHEV)
- 5.2 By Vehicle Type
- 5.2.1 Passenger Cars
- 5.2.2 Commercial Vehicles
- 5.3 By Motor Type
- 5.3.1 Permanent-Magnet Synchronous
- 5.3.2 Induction
- 5.3.3 Switched Reluctance
- 5.3.4 Axial Flux
- 5.4 By Battery Chemistry
- 5.4.1 Lithium-ion (NMC/NCA)
- 5.4.2 Lithium Iron Phosphate (LFP)
- 5.4.3 Solid-state & Semi-solid
- 5.5 By Powertrain Architecture
- 5.5.1 Single-Motor RWD
- 5.5.2 Dual-Motor AWD
- 5.5.3 Tri-/Quad-Motor AWD
- 5.6 Geography
- 5.6.1 North America
- 5.6.1.1 United States
- 5.6.1.2 Canada
- 5.6.1.3 Rest of North America
- 5.6.2 South America
- 5.6.2.1 Brazil
- 5.6.2.2 Argentina
- 5.6.2.3 Rest of South America
- 5.6.3 Europe
- 5.6.3.1 Germany
- 5.6.3.2 United Kingdom
- 5.6.3.3 France
- 5.6.3.4 Italy
- 5.6.3.5 Spain
- 5.6.3.6 Russia
- 5.6.3.7 Rest of Europe
- 5.6.4 Asia-Pacific
- 5.6.4.1 China
- 5.6.4.2 Japan
- 5.6.4.3 India
- 5.6.4.4 South Korea
- 5.6.4.5 Australia
- 5.6.4.6 Rest of Asia-Pacific
- 5.6.5 Middle East and Africa
- 5.6.5.1 United Arab Emirates
- 5.6.5.2 Saudi Arabia
- 5.6.5.3 South Africa
- 5.6.5.4 Turkey
- 5.6.5.5 Rest of Middle East and Africa
- 5.6.1 North America
6 Competitive Landscape
- 6.1 Market Concentration
- 6.2 Strategic Moves
- 6.3 Market Share Analysis
- 6.4 Company Profiles (Includes Global Level Overview, Market Level Overview, Core Segments, Financials as Available, Strategic Information, Market Rank/Share for Key Companies, Products and Services, SWOT Analysis, and Recent Developments)
- 6.4.1 Tesla
- 6.4.2 BYD Auto
- 6.4.3 Volkswagen Group
- 6.4.4 BMW Group
- 6.4.5 Mercedes-Benz Group
- 6.4.6 General Motors
- 6.4.7 Ford Motor Company
- 6.4.8 Stellantis NV
- 6.4.9 Hyundai Motor Group
- 6.4.10 Toyota Motor Corporation
- 6.4.11 Nissan Motor Co.
- 6.4.12 Lucid Group
- 6.4.13 Rivian Automotive
- 6.4.14 Rimac Automobili
7 Market Opportunities & Future Outlook
- 7.1 White-space & Unmet-Need Assessment
 全球电动车市场(至 2035 年):按车辆类型、推进系统细分、车辆连接性、零件、最终用户、PEV 市场、HEV 市场和地区划分
 全球电动车市场:机会与策略展望(至2034年)
 电动车市场(按车辆类型、电池技术、推进类型、组件类型、最终用户和销售管道划分)—2025-2032 年全球预测轻型电动车市场(按车辆类型、推进类型、电池容量、最终用户和分销管道划分)—2025-2032 年全球预测高性能电动车市场(按车辆类型、电池容量、动力传动系统类型和最终用户划分)—2025-2032 年全球预测
 全球电动车融资市场2025年全球小型电动车市场报告2025年全球电动车市场报告
 电动车市场:全球产业分析、市场规模、份额、成长、趋势和未来预测(2025-2032 年)
 2024-2031年印度电动车市场