


 |
市场调查报告书
商品编码
1836676
交通感测器:市场份额分析、行业趋势、统计数据和成长预测(2025-2030 年)Traffic Sensors - Market Share Analysis, Industry Trends & Statistics, Growth Forecasts (2025 - 2030) |
||||||
※ 本网页内容可能与最新版本有所差异。详细情况请与我们联繫。
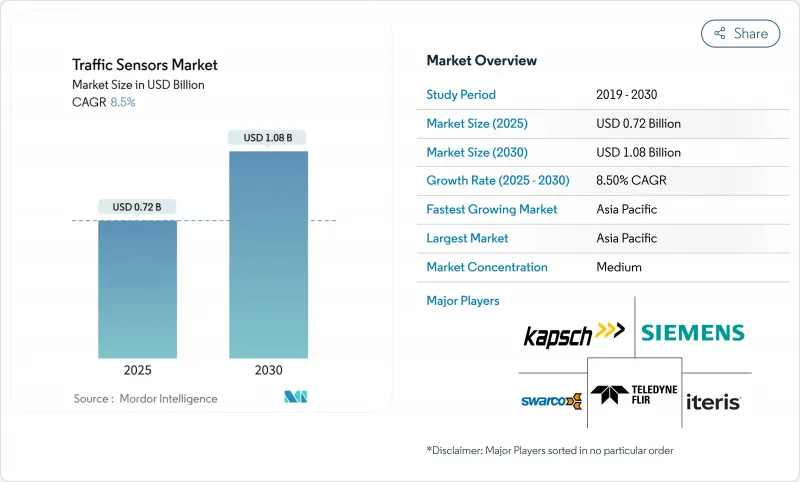
预计2025年交通感测器市场规模将达7.2亿美元,2030年将扩大至10.8亿美元。
随着城市扩展智慧交通系统以缓解交通拥堵并减少排放,以及国家机构获得多年期资金用于支援感测器的基础设施建设,需求将持续增长。边缘人工智慧和5G连线也正在将竞争焦点从独立硬体转移到资料丰富、可升级的平台。受中国和日本大规模智慧城市试点的推动,亚太地区在应用方面处于领先地位,而北美则优先考虑可最大程度减少车道封闭的维修。能够整合非侵入式侦测、预测分析和开放标准通讯的供应商拥有最广泛的可寻址客户群,尤其是在政府寻求将行人和微型行动装置纳入多模态覆盖范围的情况下。
全球交通感测器市场趋势与洞察
都市化与交通拥挤的压力
纽约大都会区交通拥堵每年对该市造成200亿美元的损失,促使其广泛部署感测器,以减少高达25%的旅行时间和高达20%的二氧化碳排放。 34亿美元的联邦公路安全改进基金正在将感测器纳入道路改善中,以减少死亡。中国约800个智慧城市试点计画将进一步加速在车辆、行人和微出行工具上的部署,从而将交通感测器市场扩展到道路车辆以外的领域。
智慧城市和ITS资金激增
到2024年,USD SMART Grants计画将向34个计划拨款5,000万美元,为感测器密集型交叉路口和边缘伺服器的建设开创先例。 「地平线欧洲」计画累计2.54亿欧元(约2.76亿美元),用于强制要求互通感测的数位交通基础建设。亚历山大市耗资500万美元的智慧运输计画等城市级倡议表明,资金筹措正迅速流向市政采购。
前期投资高
ITS America 估计,在美国为 25 万个交叉路口配备 V2X 技术将需要 65 亿美元,此外,铺设道路、人工和维护成本也增加了负担。新兴经济体面临资金缺口,导致低成本无线节点(例如奥克拉荷马州40 美元的原型)的部署速度放缓。罗德岛州 275.9 万美元的桥樑监控合约等合约凸显了巨大的资本投入,即使是单一资产也需要如此庞大的资本投入。
报告中分析的其他驱动因素和限制因素
- 强制收费和拥堵收费提供即时数据
- 边缘 AI 低功耗、非侵入式感测器
- 资料隐私和网路安全合规成本
細項分析
虽然感应线圈在2024年仍将维持38%的交通感测器市场份额,但雷射雷达12.2%的复合年增长率显示市场正向非侵入式高解析度测绘转变。随着越来越多的营运商寻求整合车辆分类和行人安全,预计与光达解决方案配套的交通感测器市场规模将超过感应线圈。 Seyond的系统拥有99%的车辆辨识准确率和92%的行人辨识率,超越了基于感应线圈的替代方案。雷达和热感成像技术在恶劣天气条件下可作为光达的补充,而压电阵列对于运动测量至关重要。具有组合模式的边缘就绪感测器能够以更低的生命週期成本收集更丰富的数据,这是联邦政府SMART指南的重点。
组件价格下降、尺寸缩小以及车规级可靠性支撑了雷射雷达的上升曲线。传统的环形感测器难以应对路面磨损和车道增设,而且无法探测自行车,因此不适用于多模态电网。由于成本和空间限制,红外线和地磁感测器的应用空间有限。一个多元化的供应商生态系统正在兴起,但整合能力是关键因素,因为各机构更倾向于提供承包分析服务,而非提供原始数据。
由于传统环形交叉路口号誌灯占主导地位,到2024年,侵入式安装将占到总收入的54%,携带式感测器的复合年增长率将达到12.0%。交通感测器市场越来越青睐太阳能装置,因为它们可以快速安装,避免车道关闭和沥青路面割裂。奥克拉荷马州州40美元的无线节点即使在资金紧张的地区也具有成本竞争力。可携式光达套件现在支援施工区域的情境察觉,使承包商更容易履行安全义务。
交通管理人员优先考虑灵活地调整感测器,以适应施工阶段、事件和临时公车道。非侵入式过载装置可覆盖并诊断多条车道,且不会干扰路面的完整性。长期环路维修则转向使用雷达和摄影机组合,以提高资料保真度并缩短使用寿命。
区域分析
2024年,亚太地区将贡献35%的收入,到2030年,复合年增长率将达到12.1%。中国製造2025计画下的智慧城市试点计画将继续推动城市基础设施预算朝向人工智慧感测方向发展。日本先进交通系统部门的目标是到2033年,为交通部批准的交通流量预测和可视化整合计划投入72.39亿美元。印度耗资1.4兆美元的国家基础设施管道项目表明,对多模态物流监控的需求日益增长。
儘管已拥有成熟的安装基础,北美仍在持续投资于改造升级。在纽约,每年1亿美元的SMART拨款和拥堵收费正在刺激边缘运算技术的替换。为了最大程度地减少车道关闭,采购工作倾向于选择适合改造的非侵入式感测器。加拿大正在透过联邦和省级政府分摊成本的方式实现走廊管理的现代化,而墨西哥则专注于与USMCA贸易流量相关的货运走廊。
欧洲正在将感测器计划与脱碳目标结合。 「地平线欧洲」和耗资10亿欧元的「互联、合作与自动化出行」计画正在资助多模态感测互通性。德国和英国正在投资铁路和公路基础设施,其中融入适用于未来自动驾驶的下一代感测器。中东和非洲正在与旗舰智慧城市计划相结合,进行选择性部署;而石油出口国则正在资助收费和动态称重网络,以保护重载走廊。
其他福利:
- Excel 格式的市场预测 (ME) 表
- 3个月的分析师支持
目录
第一章 引言
- 研究假设和市场定义
- 调查范围
第二章调查方法
第三章执行摘要
第四章 市场状况
- 市场概况
- 市场驱动因素
- 都市化与交通壅塞压力
- 智慧城市和智慧交通系统(ITS)资金激增
- 强制使用即时数据来收取通行费并缓解交通拥堵
- 与电气化相关的电网感知交通管理
- 边缘 AI 低功耗、非侵入式感测器
- 多模态微移动感测标准
- 市场限制
- 前期投资成本高
- 资料隐私和网路安全合规的成本
- 气候(高温和盐度)导致的感测器劣化
- 通讯协定碎片化阻碍互通性
- 价值/供应链分析
- 监管状况
- 技术展望
- 波特五力模型
- 新进入者的威胁
- 买方的议价能力
- 供应商的议价能力
- 替代品的威胁
- 竞争对手之间的竞争
第五章 市场规模及成长预测(金额)
- 依感测器类型
- 感应迴路
- 压电
- 弯板
- 磁力仪
- 图片/影片
- 基于雷达
- 红外线的
- LiDAR
- 依安装方式
- 侵入型(道路内)
- 非侵入式(道路上/路边)
- 可携式/临时
- 按用途
- 交通监控与交通流优化
- 体重测量
- 车辆分类与分析
- 自动动态收费
- 事件侦测与安全分析
- 按安装位置
- 城市交叉口
- 高速公路
- 桥樑和隧道
- 停车设施
- 按最终用户部门
- 政府和道路机构
- 收费公路业者/PPP特许经营
- 智慧城市解决方案整合商
- 物流和车队营运商
- 依连接技术
- 有线(CAN、乙太网路)
- 无线(DSRC/C-V2X)
- 蜂巢式物联网(NB-IoT/LTE-M/5G)
- 低功耗广域网路 (LoRa/Sigfox)
- 按地区
- 北美洲
- 美国
- 加拿大
- 墨西哥
- 南美洲
- 巴西
- 阿根廷
- 其他南美
- 欧洲
- 德国
- 英国
- 法国
- 西班牙
- 义大利
- 其他欧洲国家
- APAC
- 中国
- 日本
- 印度
- 澳洲
- 亚太地区其他国家
- 中东和非洲
- GCC
- 南非
- 其他中东和非洲地区
- 北美洲
第六章 竞争态势
- 策略趋势
- 市占率分析
- 公司简介
- Kapsch TrafficCom AG
- Siemens AG
- FLIR(Teledyne)
- Iteris Inc.
- Q-Free ASA
- SWARCO AG
- International Road Dynamics
- Sensys Networks Inc.
- Kistler Group
- Bosch Security & Safety Systems
- Axis Communications
- Smartmicro GmbH
- SICK AG
- EFKON GmbH
- Citilog(Swarco)
- Raytheon Technologies
- Sensata Technologies
- LeddarTech Inc.
- IHI Corporation
- Acyclica(FLIR)
第七章 市场机会与未来展望
The traffic sensors market size reached USD 0.72 billion in 2025 and is on course to expand to USD 1.08 billion by 2030, reflecting an 8.50% CAGR.
Demand rises as cities scale intelligent transportation systems to relieve congestion and cut emissions, and as national agencies lock in multi-year funding for sensor-enabled infrastructure. Statutory real-time data requirements for congestion pricing, dynamic tolling and safety programs anchor new procurement cycles, while edge-AI and 5G connectivity shift the competitive focus from stand-alone hardware to data-rich, upgrade-ready platforms. Asia-Pacific leads adoption on the back of China's and Japan's large-scale smart-city pilots, whereas North America prioritizes retrofits that minimize lane closures. Vendors able to bundle non-intrusive detection, predictive analytics and open-standards communications secure the widest addressable base, especially as governments press for multi-modal coverage that includes pedestrians and micromobility devices.
Global Traffic Sensors Market Trends and Insights
Urbanisation & Congestion Pressure
Metropolitan congestion costs New York USD 20 billion each year, prompting large-scale sensor roll-outs that shorten travel times by as much as 25% and trim CO2 output up to 20% trafficmobilityreviewboard. Federal Highway Safety Improvement funds of USD 3.4 billion embed detection into roadway upgrades to cut fatalities. China's nearly 800 smart-city pilots further accelerate deployments that span vehicles, pedestrians and micromobility users, broadening the traffic sensors market beyond road vehicles alone
Smart-City & ITS Funding Surge
The USD SMART Grants program disbursed USD 50 million across 34 projects in 2024, setting precedents for sensor-rich intersections and edge servers .Horizon Europe earmarked EUR 254 million (USD 276 million) to digital transport infrastructure that mandates interoperable detection. City-level initiatives, such as Alexandria's USD 5 million smart-mobility plan, confirm that funding is cascading rapidly to municipal procurement
High Up-Front Deployment CAPEX
ITS America estimates USD 6.5 billion is needed to equip 250,000 U.S. intersections with V2X technology, a burden intensified by paving, labor and maintenance costs . Developing economies face financing gaps that delay roll-outs, although low-cost wireless nodes such as Oklahoma's USD 40 prototype ease entry barriers Contracts like Rhode Island's USD 2.759 million bridge monitoring deal highlight the sizable capital commitment even for individual assets
Other drivers and restraints analyzed in the detailed report include:
- Mandated Real-Time Data for Tolling & Congestion Pricing
- Edge-AI Low-Power Non-Intrusive Sensors
- Data-Privacy & Cyber-Security Compliance Costs
For complete list of drivers and restraints, kindly check the Table Of Contents.
Segment Analysis
Inductive loops retained 38% traffic sensors market share in 2024, yet LiDAR's 12.2% CAGR signals a pivot to non-intrusive, high-resolution mapping. The traffic sensors market size attached to LiDAR solutions is projected to outpace loops as operators seek vehicle classification and pedestrian safety in one package. Seyond's system posts 99% vehicle accuracy and 92% pedestrian recognition, outperforming loop-based alternatives simpl.. Radar and thermal imaging complement LiDAR in adverse weather, while piezoelectric arrays remain vital for weigh-in-motion. Edge-ready sensors that combine modalities collect richer data with lower lifecycle cost, a priority under federal SMART guidance
LiDAR's upward curve is reinforced by falling component prices, smaller form factors and automotive-grade reliability. Traditional loops struggle with pavement wear and lane additions, and their inability to detect cyclists limits suitability for multimodal grids. Infrared and magnetometer solutions hold niche roles where cost or site constraints dictate. A diverse supplier ecosystem is emerging, yet integration skill remains a differentiator as agencies favor turnkey analytics over raw feed delivery.
Intrusive installs made up 54% revenue in 2024 as legacy loops dominate signalized junctions, but portable sensors are forecast for 12.0% CAGR. The traffic sensors market increasingly rewards quick-deploy, solar-powered units that avoid lane closures and asphalt cutting. Oklahoma's USD 40 wireless node underscores cost competitiveness even for cash-constrained districts. Portable LiDAR kits now underpin work-zone situational awareness, easing contractor compliance with safety mandates.
Traffic managers prioritize flexibility to realign sensors with construction phases, events or pop-up bus lanes. Non-intrusive over-road gear delivers multi-lane coverage and diagnostics without disturbing pavement integrity. Long-term, loop retrofits shift toward radar-camera combos delivering higher data fidelity and lower lifetime spend.
The Traffic Sensor Market is Segmented by Sensor Type (Inductive Loop, and More), Application ( Weigh in Motion and More), Installation Method (Intrusive (In-Road) and More), Deployment Location (Urban Intersections and More), End-Use Sector (Government and Road Agencies and More), Connectivity Technology (Wired and More) and by Geography. The Market Forecasts are Provided in Terms of Value (USD).
Geography Analysis
Asia-Pacific generated 35% 2024 revenue and posts a 12.1% CAGR through 2030. China's smart-city pilots, anchored in the Made in China 2025 program, keep urban infrastructure budgets flowing toward AI-enabled detection. Japan's advanced traffic systems sector targets USD 7.239 billion by 2033 as Ministry-approved projects integrate flow prediction and visualization. India's USD 1.4 trillion National Infrastructure Pipeline underlines rising demand for multimodal logistics monitoring .
North America commands mature install bases yet continues to invest in retrofit upgrades. USD 100 million annual SMART allocations and congestion pricing in New York spur edge-ready replacements. Retrofit-friendly, non-intrusive sensors dominate procurements that must minimize lane closures. Canada modernizes corridor management through federal-provincial cost sharing, whereas Mexico focuses on freight corridors linked to USMCA trade flows.
Europe links sensor projects to decarbonization targets. Horizon Europe and the EUR 1 billion Connected, Cooperative and Automated Mobility program fund multi-modal detection interoperability. Germany and the UK channel funds into rail and high-speed roadways that embed next-gen sensors suitable for future autonomous deployment. Middle East and Africa exhibit selective adoption tied to flagship smart-city schemes, though oil-exporting states fund toll and weigh-in-motion networks to safeguard heavy-load corridors.
- Kapsch TrafficCom AG
- Siemens AG
- FLIR (Teledyne)
- Iteris Inc.
- Q-Free ASA
- SWARCO AG
- International Road Dynamics
- Sensys Networks Inc.
- Kistler Group
- Bosch Security & Safety Systems
- Axis Communications
- Smartmicro GmbH
- SICK AG
- EFKON GmbH
- Citilog (Swarco)
- Raytheon Technologies
- Sensata Technologies
- LeddarTech Inc.
- IHI Corporation
- Acyclica (FLIR)
Additional Benefits:
- The market estimate (ME) sheet in Excel format
- 3 months of analyst support
TABLE OF CONTENTS
1 INTRODUCTION
- 1.1 Study Assumptions and Market Definition
- 1.2 Scope of the Study
2 RESEARCH METHODOLOGY
3 EXECUTIVE SUMMARY
4 MARKET LANDSCAPE
- 4.1 Market Overview
- 4.2 Market Drivers
- 4.2.1 Urbanisation and Congestion Pressure
- 4.2.2 Smart-City and ITS Funding Surge
- 4.2.3 Mandated Real-Time Data for Tolling and Congestion Pricing
- 4.2.4 Electrification-Linked Grid-Aware Traffic Management
- 4.2.5 Edge-AI Low-Power Non-Intrusive Sensors
- 4.2.6 Multimodal Micromobility Detection Standards
- 4.3 Market Restraints
- 4.3.1 High Up-Front Deployment CAPEX
- 4.3.2 Data-Privacy & Cyber-Security Compliance Costs
- 4.3.3 Climate-Driven Sensor Degradation (Heat and Salinity)
- 4.3.4 Fragmented Protocols Hindering Interoperability
- 4.4 Value / Supply-Chain Analysis
- 4.5 Regulatory Landscape
- 4.6 Technological Outlook
- 4.7 Porters Five Forces
- 4.7.1 Threat of New Entrants
- 4.7.2 Bargaining Power of Buyers
- 4.7.3 Bargaining Power of Suppliers
- 4.7.4 Threat of Substitutes
- 4.7.5 Competitive Rivalry
5 MARKET SIZE & GROWTH FORECASTS (VALUE)
- 5.1 By Sensor Type
- 5.1.1 Inductive Loop
- 5.1.2 Piezoelectric
- 5.1.3 Bending Plate
- 5.1.4 Magnetometer
- 5.1.5 Image / Video
- 5.1.6 Radar-Based
- 5.1.7 Infrared
- 5.1.8 LiDAR
- 5.2 By Installation Method
- 5.2.1 Intrusive (In-Road)
- 5.2.2 Non-Intrusive (Over-Road / Roadside)
- 5.2.3 Portable / Temporary
- 5.3 By Application
- 5.3.1 Traffic Monitoring and Flow Optimisation
- 5.3.2 Weigh-In-Motion
- 5.3.3 Vehicle Classification and Profiling
- 5.3.4 Automated and Dynamic Tolling
- 5.3.5 Incident Detection and Safety Analytics
- 5.4 By Deployment Location
- 5.4.1 Urban Intersections
- 5.4.2 Highways and Expressways
- 5.4.3 Bridges and Tunnels
- 5.4.4 Parking Facilities
- 5.5 By End-Use Sector
- 5.5.1 Government and Road Agencies
- 5.5.2 Toll Operators / PPP Concessions
- 5.5.3 Smart-City Solution Integrators
- 5.5.4 Logistics and Fleet Operators
- 5.6 By Connectivity Technology
- 5.6.1 Wired (CAN, Ethernet)
- 5.6.2 Wireless (DSRC / C-V2X)
- 5.6.3 Cellular-IoT (NB-IoT / LTE-M / 5G)
- 5.6.4 LPWAN (LoRa / Sigfox)
- 5.7 By Geography
- 5.7.1 North America
- 5.7.1.1 United States
- 5.7.1.2 Canada
- 5.7.1.3 Mexico
- 5.7.2 South America
- 5.7.2.1 Brazil
- 5.7.2.2 Argentina
- 5.7.2.3 Rest of South America
- 5.7.3 Europe
- 5.7.3.1 Germany
- 5.7.3.2 United Kingdom
- 5.7.3.3 France
- 5.7.3.4 Spain
- 5.7.3.5 Italy
- 5.7.3.6 Rest of Europe
- 5.7.4 APAC
- 5.7.4.1 China
- 5.7.4.2 Japan
- 5.7.4.3 India
- 5.7.4.4 Australia
- 5.7.4.5 Rest of APAC
- 5.7.5 Middle East and Africa
- 5.7.5.1 GCC
- 5.7.5.2 South Africa
- 5.7.5.3 Rest of Middle East and Africa
- 5.7.1 North America
6 COMPETITIVE LANDSCAPE
- 6.1 Strategic Moves
- 6.2 Market Share Analysis
- 6.3 Company Profiles (includes Global level Overview, Market level overview, Core Segments, Financials as available, Strategic Information, Market Rank/Share for key companies, Products & Services, and Recent Developments)
- 6.3.1 Kapsch TrafficCom AG
- 6.3.2 Siemens AG
- 6.3.3 FLIR (Teledyne)
- 6.3.4 Iteris Inc.
- 6.3.5 Q-Free ASA
- 6.3.6 SWARCO AG
- 6.3.7 International Road Dynamics
- 6.3.8 Sensys Networks Inc.
- 6.3.9 Kistler Group
- 6.3.10 Bosch Security & Safety Systems
- 6.3.11 Axis Communications
- 6.3.12 Smartmicro GmbH
- 6.3.13 SICK AG
- 6.3.14 EFKON GmbH
- 6.3.15 Citilog (Swarco)
- 6.3.16 Raytheon Technologies
- 6.3.17 Sensata Technologies
- 6.3.18 LeddarTech Inc.
- 6.3.19 IHI Corporation
- 6.3.20 Acyclica (FLIR)
7 MARKET OPPORTUNITIES AND FUTURE OUTLOOK
- 7.1 White-Space and Unmet-Need Assessment


