


 |
市场调查报告书
商品编码
1842498
丁烷:市场占有率分析、产业趋势、统计数据和成长预测(2025-2030 年)Butane - Market Share Analysis, Industry Trends & Statistics, Growth Forecasts (2025 - 2030) |
||||||
※ 本网页内容可能与最新版本有所差异。详细情况请与我们联繫。
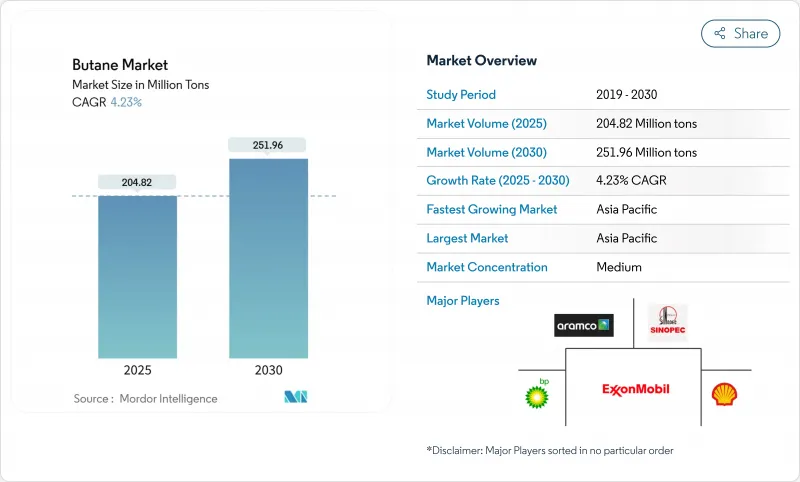
预计 2025 年丁烷市场规模为 2.0482 亿吨,到 2030 年将达到 2.5196 亿吨,预测期内(2025-2030 年)的复合年增长率为 4.23%。
这种碳氢化合物是民用液化石油气和石化原料的关键成分,特别是乙烯和丙烯链,亚太地区的营运商正在建造更多世界一流的裂解装置。
正丁烷支持冬季汽油调和,而异丁烷则增强高辛烷值烷基化油的流动性。正如达拉斯联邦储备银行指出的那样,北美页岩油生产促进了液态天然气的回收,抑制了价格飙升,并解决了区域供应紧张的问题。储存终端的数位孪生技术减少了处理损失,并优化了运输窗口。这些因素缓解了与原油相关的价格波动,并推动了对生产、物流和下游转化资产的投资。
全球丁烷市场趋势与洞察
石化产业需求不断成长
裂解装置产能扩张正在推动丁烷的结构性需求成长,预计2019年至2024年期间中国液化石油气(LPG)原料的消耗量将增加210万桶/日,到2030年还将进一步增加。国际能源总署(IEA)预测,2025年超过一半的液体燃料需求成长将来自丁烷等NGL原料。随着新建工厂稀释价差,下游利润率将收窄,迫使营运商签订长期承购协议并采取增效措施。
金属加工和建设产业的需求增加
丁烷燃烧式焊枪因其火焰温度稳定、烟尘减少、焊接品质和切割精度高等特点,深受工业用户的青睐。使用液化石油气(LPG)钢瓶的可携式加热器,可在寒冷气候下电力供应不稳定的现场作业。儘管高所得国家的电气化程度正在提高,但新兴市场的承包商仍然青睐经济高效的液化石油气解决方案,这推动了亚洲新建工程和非洲基础设施维修的成长。液化石油气的应用也依赖于能够缩短物流「最后一哩路」的钢瓶发行网络,为中游企业创造机会。
原物料价格波动
丁烷与原油和天然气指数的密切相关性,使用户面临价格突然波动的风险,并使采购预算更加复杂。原油价格下跌会导致天然气液体(NGL)价格下跌,而乙烷价格的突然下跌则会增强丁烷与丁烷的相关性,从而增加对冲的复杂性。美国生产者物价指数(PPI)从2025年1月的210.934点下跌至4月的144.296点,跌幅达32%,这给库存规划带来了不确定性。价格风险抑制了资金匮乏地区的新增产能,并推动了对灵活物流的投资,以套利区域价差。
报告中分析的其他驱动因素和限制因素
- 丁烷是汽油和柴油的更清洁的替代品,在汽车燃气。
- 液化石油气仓储物流数位双胞胎优化
- 替代燃料的可用性
細項分析
至2024年,正丁烷将占丁烷市场规模的56.19%,并以4.94%的最快复合年增长率成长至2030年。冬季级汽油需要更高的正丁烷混合比才能满足雷德蒸气压限值,从而确保炼油厂的稳定供应。石化製造商将正丁烷整合到蒸汽裂解装置中,引导C4抽提物流,从而实现丁二烯和抽余油生产之间的灵活切换。
丁烷市场报告按产品类型(正丁烷和异丁烷)、终端用户行业(住宅/商业、工业(包括化学原料)、发动机燃料、炼油厂和其他终端用户行业)、供应商(天然气和炼油厂)以及地区(亚太地区、北美、欧洲、南美、中东和非洲)对南美丁烷市场进行了细分。市场预测以产量(吨)为单位。
区域分析
2024年,亚太地区将占据丁烷市场的54.18%,维持5.28%的最快复合年增长率。中国蒸汽裂解装置的兴起将继续吸引美国NGL货物,到2024年,其将占中国液化石油气(LPG)进口量的56%。
北美仍然是主要的丁烷供应地区,充足的页岩油产量推动了出口成长。 2024年,美国丁烷出口量约50万桶/日,其中41%销往亚洲,36%销往非洲。欧洲市场呈现均衡态势。积极的气候政策正在抑制需求成长,但传统的石化资产正在稳定基准需求。
在中东,透过利用有利的原料,石化产品的扩张将得以维持;而在非洲和南美洲,在哥伦比亚和奈及利亚补贴框架的支持下,气瓶渗透率将会增加。
其他福利:
- Excel 格式的市场预测 (ME) 表
- 3个月的分析师支持
目录
第一章 引言
- 研究假设和市场定义
- 调查范围
第二章调查方法
第三章执行摘要
第四章 市场状况
- 市场概况
- 市场驱动因素
- 石化产业需求不断成长
- 金属加工和建设产业的需求增加
- 扩大丁烷在汽车燃气中的使用,作为汽油和柴油的更清洁的替代品
- 全球烹饪和取暖用液化石油气(LPG)消费量不断增加
- 液化石油气仓储物流数位双胞胎优化
- 市场限制
- 原物料价格波动
- 替代燃料的可用性
- 新兴市场的基础设施有限
- 价值链分析
- 五力分析
- 供应商的议价能力
- 买方的议价能力
- 新进入者的威胁
- 替代品的威胁
- 竞争程度
第五章市场规模及成长预测(数量)
- 依产品类型
- 正丁烷
- 异丁烷
- 按来源
- 天然气
- 纯化
- 按最终用户产业
- 住宅/商业
- 工业(含化工原料)
- 引擎燃料
- 纯化
- 其他最终用户产业
- 按地区
- 亚太地区
- 中国
- 印度
- 日本
- 韩国
- 其他亚太地区
- 北美洲
- 美国
- 加拿大
- 墨西哥
- 欧洲
- 德国
- 英国
- 法国
- 义大利
- 其他欧洲国家
- 南美洲
- 巴西
- 阿根廷
- 其他南美
- 中东和非洲
- 沙乌地阿拉伯
- 南非
- 其他中东和非洲地区
- 亚太地区
第六章 竞争态势
- 市场集中度
- 策略倡议
- 市占率(%)/排名分析
- 公司简介
- Bharat Petroleum Corporation Limited
- BP plc
- Chevron Phillips Chemical Company LLC
- China Petrochemical Corporation
- ConocoPhillips
- Dow
- Equinor ASA
- Exxon Mobil Corporation
- Gazprom
- Linde PLC
- Petroliam Nasional Berhad(PETRONAS)
- Petron Corporation
- Reliance Industries Limited
- Saudi Arabian Oil Co.
- Shell
- TotalEnergies
- Valero Energy Corporation
第七章 市场机会与未来展望
The Butane Market size is estimated at 204.82 Million tons in 2025, and is expected to reach 251.96 Million tons by 2030, at a CAGR of 4.23% during the forecast period (2025-2030).Hydrocarbons serve as key components for residential LPG and petrochemical feedstocks, particularly in ethylene and propylene chains, with Asia-Pacific operators adding world-scale crackers.
Normal butane supports winter gasoline blending, while isobutane enhances high-octane alkylate streams. North American shale output boosts natural gas liquids recovery, curbing price spikes and addressing regional tightness, as noted by the Dallas Fed. Digital twins at storage terminals reduce handling losses and optimize ship-loading windows. These factors mitigate crude-linked pricing volatility and drive investments in production, logistics, and downstream conversion assets.
Global Butane Market Trends and Insights
Growing Demand from the Petrochemical Industry
Expanding cracker capacity spurs structural butane uptake, with China's LPG feedstock pull rising 2.1 million b/d between 2019 and 2024 and more additions scheduled to 2030. The International Energy Agency projects that over half of the 2025 liquids-demand increase will come from NGL feedstocks such as butane. Downstream margins tighten as new plants dilute spreads, pushing operators toward long-term offtake contracts and efficiency measures.
Increasing Demand from the Metalworking and Construction Industry
Industrial users favour butane-fired torches for consistent flame temperatures and lower soot formation, enhancing weld quality and cutting precision. Portable heaters using LPG cylinders support site work in cold climates where the electric supply is unreliable. While electrification gains traction in high-income economies, emerging-market contractors still prefer cost-effective LPG solutions. Growth, therefore, tracks new-build activity in Asia and infrastructure upgrades in Africa. Adoption also hinges on cylinder distribution networks that shorten last-mile logistics, signalling opportunity for midstream players.
Volatility in Raw Material Prices
Butane's close linkage to crude and natural gas indices exposes users to rapid swings that complicate procurement budgets. Lower crude leads to softer NGL pricing, but sudden ethane weakness heightens co-movement with butane, increasing hedge complexity. The US producer-price index dropped from 210.934 in January 2025 to 144.296 in April 2025, a 32% slide that unsettled inventory planning. Price risk discourages greenfield capacity in capital-scarce zones and channels investment into flexible logistics that arbitrage regional spreads.
Other drivers and restraints analyzed in the detailed report include:
- Growing Usage of Butane in Autogas, a Cleaner Alternative to Gasoline and Diesel
- Digital Twin Optimisation of LPG Storage Logistics
- Availability of Fuel Alternatives
For complete list of drivers and restraints, kindly check the Table Of Contents.
Segment Analysis
n-Butane held 56.19% of the butane market size in 2024 and posts the fastest 4.94% CAGR to 2030. Winter-grade gasoline necessitates higher normal-butane blend ratios to meet Reid-vapor-pressure limits, securing consistent off-take from refiners. Petrochemical players integrate normal butane into steam crackers oriented toward C4 extraction streams that switch flexibly between butadiene and raffinate production.
The Butane Market Report Segments the Industry by Product Type (n-Butane and Iso-Butane), End-User Industry (Residential/Commercial, Industrial (Including Chemical Feed Stock), Engine Fuel, Refinery, and Other End-User Industries), by Source (Natural Gas and Refining), and by Geography (Asia-Pacific, North America, Europe, South America, and Middle East and Africa). The Market Forecasts are Provided in Terms of Volume (Ton).
Geography Analysis
Asia-Pacific commanded 54.18% butane market share in 2024 and sustained the fastest 5.28% CAGR. China's steam-cracker wave continues to pull US NGL cargoes, accounting for 56% of Chinese LPG imports in 2024.
North America remains the supply powerhouse, with ample shale-derived output feeding rising export volumes. The US shipped roughly 500 thousand b/d of butane in 2024, routing 41% to Asia and 36% to Africa. Europe presents a balanced picture: forward-looking climate policy checks demand growth, but legacy petrochemical assets keep baseline offtake steady.
The Middle East leverages advantaged feedstock to sustain petrochemical expansions, while Africa and South America see incremental cylinder penetration supported by subsidy frameworks in Colombia and Nigeria.
- Bharat Petroleum Corporation Limited
- BP plc
- Chevron Phillips Chemical Company LLC
- China Petrochemical Corporation
- ConocoPhillips
- Dow
- Equinor ASA
- Exxon Mobil Corporation
- Gazprom
- Linde PLC
- Petroliam Nasional Berhad (PETRONAS)
- Petron Corporation
- Reliance Industries Limited
- Saudi Arabian Oil Co.
- Shell
- TotalEnergies
- Valero Energy Corporation
Additional Benefits:
- The market estimate (ME) sheet in Excel format
- 3 months of analyst support
TABLE OF CONTENTS
1 Introduction
- 1.1 Study Assumptions and Market Definition
- 1.2 Scope of the Study
2 Research Methodology
3 Executive Summary
4 Market Landscape
- 4.1 Market Overview
- 4.2 Market Drivers
- 4.2.1 Growing Demand from the Petrochemcial Industry
- 4.2.2 Increasing Demand from the Metalworking and Construction Industry
- 4.2.3 Growing Usage of Butane in Autogas, a Cleaner Alternative to Gasoline and Diesel
- 4.2.4 Increasing global consumption of liquefied petroleum gas (LPG) for cooking and heating
- 4.2.5 Digital twin optimisation of LPG storage logistics
- 4.3 Market Restraints
- 4.3.1 Volatility in Raw Material Prices
- 4.3.2 Availability of Fuel Alternatives
- 4.3.3 Limited Infrastructure in Emerging Markets
- 4.4 Value Chain Analysis
- 4.5 Porter's Five Forces
- 4.5.1 Bargaining Power of Suppliers
- 4.5.2 Bargaining Power of Buyers
- 4.5.3 Threat of New Entrants
- 4.5.4 Threat of Substitutes
- 4.5.5 Degree of Competition
5 Market Size and Growth Forecasts (Volume)
- 5.1 By Product Type
- 5.1.1 n-Butane
- 5.1.2 Iso-butane
- 5.2 By Source
- 5.2.1 Natural Gas
- 5.2.2 Refining
- 5.3 By End-user Industry
- 5.3.1 Residential/Commercial
- 5.3.2 Industrial (Including Chemical Feedstock)
- 5.3.3 Engine Fuel
- 5.3.4 Refinery
- 5.3.5 Other End-user Industries
- 5.4 By Geography
- 5.4.1 Asia-Pacific
- 5.4.1.1 China
- 5.4.1.2 India
- 5.4.1.3 Japan
- 5.4.1.4 South Korea
- 5.4.1.5 Rest of Asia-Pacific
- 5.4.2 North America
- 5.4.2.1 United States
- 5.4.2.2 Canada
- 5.4.2.3 Mexico
- 5.4.3 Europe
- 5.4.3.1 Germany
- 5.4.3.2 United Kingdom
- 5.4.3.3 France
- 5.4.3.4 Italy
- 5.4.3.5 Rest of Europe
- 5.4.4 South America
- 5.4.4.1 Brazil
- 5.4.4.2 Argentina
- 5.4.4.3 Rest of South America
- 5.4.5 Middle East and Africa
- 5.4.5.1 Saudi Arabia
- 5.4.5.2 South Africa
- 5.4.5.3 Rest of Middle-East and Africa
- 5.4.1 Asia-Pacific
6 Competitive Landscape
- 6.1 Market Concentration
- 6.2 Strategic Moves
- 6.3 Market Share(%)/Ranking Analysis
- 6.4 Company Profiles {includes Global level Overview, Market level overview, Core Segments, Financials as available, Strategic Information, Market Rank/Share for key companies, Products and Services, and Recent Developments}
- 6.4.1 Bharat Petroleum Corporation Limited
- 6.4.2 BP plc
- 6.4.3 Chevron Phillips Chemical Company LLC
- 6.4.4 China Petrochemical Corporation
- 6.4.5 ConocoPhillips
- 6.4.6 Dow
- 6.4.7 Equinor ASA
- 6.4.8 Exxon Mobil Corporation
- 6.4.9 Gazprom
- 6.4.10 Linde PLC
- 6.4.11 Petroliam Nasional Berhad (PETRONAS)
- 6.4.12 Petron Corporation
- 6.4.13 Reliance Industries Limited
- 6.4.14 Saudi Arabian Oil Co.
- 6.4.15 Shell
- 6.4.16 TotalEnergies
- 6.4.17 Valero Energy Corporation
7 Market Opportunities and Future Outlook
- 7.1 White-space and Unmet-need Assessment
 丁烷气罐市场:2026-2032年全球市场预测(按气罐类型、气罐容量、材料类型、应用、分销管道和最终用户划分)
 丁烷市场分析及预测(至2035年):类型、产品类型、应用、最终用户、技术、形态、材质类型、製程、安装类型、设备
 异丁烷市场规模、份额、成长及全球产业分析:按类型和应用划分,区域洞察及2026-2034年预测
 2026年全球丁烷气瓶市场报告
 丁烷市场规模、份额及成长分析(按来源、应用及地区划分)-2026-2033年产业预测
 丁烷气瓶市场 - 全球产业规模、份额、趋势、机会和预测,按应用程式、类型、配销通路、最终用户、地区和竞争进行细分,2020-2030 年预测全球丁烷气筒市场规模(按类型、应用、地区、范围和预测)异丁烷市场-全球产业规模、份额、趋势、机会及预测(按销售管道、最终用途、地区和竞争细分,2020-2030 年)
 丁烷的全球市场:市场规模·占有率·趋势,产业分析 (各用途·各地区),未来预测 (2025年~2034年)全球丁烷市场预测(2025-2030年)