


 |
市场调查报告书
商品编码
1842503
车载连接:市场份额分析、行业趋势、统计数据和成长预测(2025-2030 年)Onboard Connectivity - Market Share Analysis, Industry Trends & Statistics, Growth Forecasts (2025 - 2030) |
||||||
※ 本网页内容可能与最新版本有所差异。详细情况请与我们联繫。
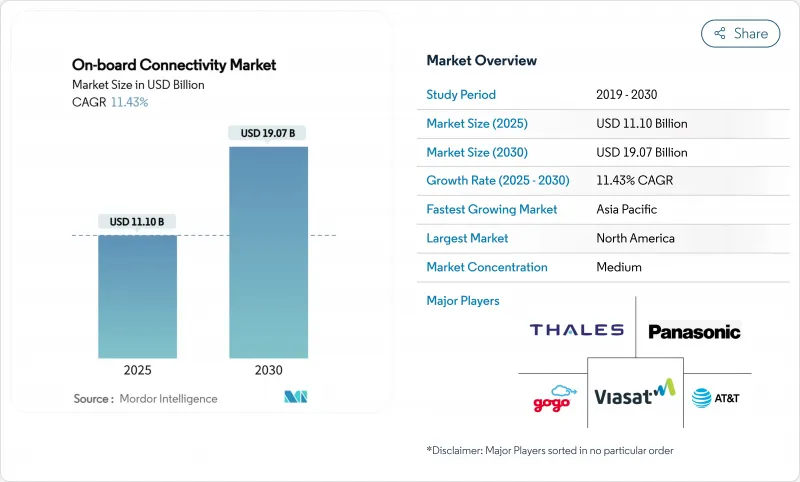
据估计,2025 年车载连接市场规模预计将达到 111 亿美元,预计到 2030 年将达到 190.7 亿美元,复合年增长率为 11.43%。
持续成长反映了从单纯依赖地球静止卫星的架构到整合低地球轨道 (LEO)、中地球轨道 (MEO) 和地球静止轨道 (GEO) 容量的混合架构的决定性转变,从而增强了低延迟和网路弹性。由联邦通讯委员会 (FCC) 的「太空补充覆盖」规则引领的监管势头,如今已实现卫星与地面融合,并开启了直接面向设备的经营模式。航空公司、铁路营运商和航运公司将利用广告支援的 Wi-Fi、整合 5G回程传输和预测性维护分析,将这些规则变化转化为新的收益源。设备供应商正在透过整合软体定义网路和多卫星群终端释放变化,其自适应路由可延长运作并降低单轨道故障的风险。
全球车载连接市场趋势与洞察
高速乘客Wi-Fi需求快速成长
87% 的乘客愿意观看广告以换取免费 Wi-Fi,收益模式正转向广告支援型存取。到 2035 年,宽频服务每年可为航空公司带来 300 亿美元的辅助收入。 ViaAsert 目前与 60 多家航空公司签订了广告协议,彰显了其规模。乘客调查显示,83% 的乘客表示愿意重新预订提供更优质 Wi-Fi 的航空公司的航班,巩固了连接性作为差异化优势的地位。嘉年华航空集团 (Carnival Corporation) 在整个机队部署了 Starlink 卫星网络,提高了乘客满意度和机组人员的社会福利。航空公司也将椅背显示器与个人装置结合,以提供有针对性的内容,从而提高品牌忠诚度和广告产量。
低地球卫星群的快速部署
Starlink 首批 12 颗直接存取基地台的卫星计画于 2024 年推出文字服务,并于 2025 年推出语音/资料功能,从而减少许多用例对星载天线的依赖。 Viasat 正在整合 Telesat Lightspeed 的容量,而 Hughes 的 Fusion 方案则为Delta航空融合了低地球轨道 (LEO) 和地球静止轨道 (GEO)频宽。通讯业者与行动通讯业者之间的直接接取设备协定消除了铁路和海事部门对专用终端的需求。 Eutelsat OneWeb 和国际通讯卫星组织 (Intelsat) 的北极演示改善了北极地区的覆盖范围。透过 3D 列印和垂直整合降低卫星製造成本,使其能够以低于传统地球静止轨道 (GEO) 经济的价格获得具有竞争力的价格。 FCC 频谱分配进一步简化了卫星群部署并加快了服务投入时间。
维修和认证成本高
根据美国联邦航空管理局(FAA)20-168号咨询通告,连接性维修需要进行测试,每架飞机耗时12至18个月,耗资数百万美元。欧洲航空安全局(EASA)的欧洲空中交通管制系统办公室(ETSO)框架也对跨境飞机设置了类似的障碍。电子导航天线引入了缺乏历史基准的新核准类别,并延长了审核流程。恶劣的海洋环境需要坚固的硬体和漫长的海上试验,从而提升单位经济效益。固定认证成本对小型航空公司负担最重,而大型业者则能提升规模经济效益。
报告中分析的其他驱动因素和限制因素
- 全球客运量成长
- 提高网路可靠性
- 严格的航空和海事法规
細項分析
2024年,硬体将占机上连接市场收入的45.98%,涵盖支撑机上连接市场实体链路的产品,例如天线、数据机和路由器。另一方面,服务预计将以12.60%的复合年增长率成长,这反映出营运商更倾向于基于结果的合同,将履约风险转移给供应商。随着多轨道复杂性超越内部技能水平,与託管服务相关的机载连接市场规模预计将扩大。
服务的成长与安装专业知识、端到端监控和运作保证的需求的不断增长同步。供应商正在将软体维护、网路安全和法规遵循捆绑在一起,从而实现可预测的总体拥有成本。航空公司和铁路公司越来越多地签订多年期服务合同,并根据乘客使用情况收取费用,而航运公司则正在寻求将机组人员社会福利和运营数据回程传输集成在一起的套餐。硬体供应商正在透过整合支援远距离诊断的软体功能来应对这项挑战,以确保设备在售出后持续的服务收入。
到2024年,卫星解决方案将占到总收入的75.65%,凸显了机上连接市场的历史根基。然而,混合轨道和多轨道架构正以16.54%的复合年增长率扩张,改变了竞争重心。由于营运商优先考虑弹性,单轨道模型的机载连接市场份额预计将有所下降。
混合网路的采用正在加速,因为低轨卫星段可以降低即时服务的延迟,而地球同步轨道(GEO)仍然是批量串流媒体的理想选择。软体定义无线电可以在几毫秒内切换卫星群,以支援不间断的会话。密集的铁路走廊正在部署地对车5G网络,以实现经济高效的容量,而卫星则是偏远地区的预设选择。供应商正在透过编配演算法实现差异化,这些演算法无需用户干预即可将流量分配到成本最低的路径。
区域分析
2024年,北美地区占比41.78%,显示该地区早期采用低地球轨道(LEO)服务、政策清晰,且航空公司升级预算雄厚。 Gogo的伽利略商务航空解决方案凸显了对全球漫游多轨功能的需求。美国铁路公司(Amtrak)为东北走廊计画提供的82亿美元联邦资金加速了车站到列车的Wi-Fi计划。墨西哥湾的能源资产正在利用Tamnet的海底光纤与AT&T的5G技术结合,实现海上覆盖。
预计亚太地区将以13.20%的复合年增长率成长,到2035年需要43兆美元的基础设施投资。东协的经济整合计画将数位互联互通置于基础之上,从而提升了乘客的期望。中国、日本和印度的高铁从设计阶段就已融入数Gigabit链路,以避免维修延误。新加坡航运公司正在部署可在低地球轨道(LEO)和地球静止轨道(GEO)之间自动切换的混合终端。该地区的年轻一代正在加速在旅行中使用连网娱乐和电子商务。
欧洲继续透过扩展跨欧洲铁路网和需要强大海上连接的北海可再生能源计划实现稳步增长。 Starline 的欧洲大陆铁路网蓝图凸显了欧盟委员会对无缝漫游的承诺。英国已同意一项公私协议,旨在消除主要铁路线上的移动盲点。邮轮和货运业者正在将Ka波段容量与传统的L波段安全频道结合,以平衡冗余和成本。日益严格的资料保护法将要求供应商预设采用高级加密技术。
其他福利:
- Excel 格式的市场预测 (ME) 表
- 3个月的分析师支持
目录
第一章 引言
- 研究假设和市场定义
- 调查范围
第二章调查方法
第三章执行摘要
第四章 市场状况
- 市场概况
- 市场驱动因素
- 高速乘客Wi-Fi需求快速成长
- 低地球卫星群的快速部署
- 全球旅客数量增加
- 广告支援的连结模型
- 提高多轨铁路网的可靠性
- 直接到设备的卫星服务
- 市场限制
- 维修和认证成本高
- 严格的航空和海事法规
- RF频谱拥塞 (Ku/Ka)
- 网路安全漏洞
- 价值链分析
- 监管状况
- 技术展望
- 波特五力分析
- 新进入者的威胁
- 买方的议价能力
- 供应商的议价能力
- 替代品的威胁
- 竞争对手之间的竞争
第五章市场规模及成长预测
- 按组件
- 硬体
- 天线系统
- 数据机和路由器
- 无线网路基地台
- 解决方案
- 网路管理平台
- 内容管理系统
- 服务
- 安装和集成
- 託管连线
- 支援和维护
- 硬体
- 依连接技术
- 卫星
- 空对地(ATG)
- 混合/多轨迹
- 透过交通平台
- 航空
- 商业航空
- 公务机
- 无人系统
- 海上运输
- 商船
- 游轮和渡轮
- 海上能源
- 铁路
- 高速铁路
- 通勤/地铁
- 航空
- 按用途
- 娱乐
- 通讯
- 安全与营运
- 其他的
- 按地区
- 北美洲
- 美国
- 加拿大
- 墨西哥
- 欧洲
- 德国
- 英国
- 法国
- 俄罗斯
- 其他欧洲国家
- 亚太地区
- 中国
- 日本
- 印度
- 澳洲
- 其他亚太地区
- 南美洲
- 巴西
- 其他南美
- 中东和非洲
- 中东
- 阿拉伯聯合大公国
- 沙乌地阿拉伯
- 其他中东地区
- 非洲
- 南非
- 其他非洲国家
- 北美洲
第六章 竞争态势
- 市场集中度
- 策略倡议
- 市占率分析
- 公司简介
- Panasonic Corporation
- Viasat, Inc.
- Intelsat
- Gogo Inc.
- Thales Group
- Honeywell International Inc.
- RTX Corporation
- ALE International
- Huawei Technologies Co., Ltd.
- AT&T Inc.
- Space Exploration Technologies Corp.
- Eutelsat OneWeb(Eutelsat Group)
- SES SA
- Cobham Limited
- Anuvu Operations LLC
- Iridium Communications Inc.
第七章 市场机会与未来展望
The onboard connectivity market size is estimated at USD 11.10 billion in 2025 and is forecast to reach USD 19.07 billion by 2030, representing an 11.43% CAGR.
Sustained growth reflects a decisive migration from sole reliance on geostationary satellites to hybrid architectures that merge LEO, MEO, and GEO capacity, delivering lower latency and stronger network resilience. Regulatory momentum-most notably the Federal Communications Commission's Supplemental Coverage-From-Space rules-now permits satellite-terrestrial convergence that unlocks direct-to-device business models. Airlines, rail operators, and shipping lines translate these rule changes into new revenue streams via advertising-supported Wi-Fi, integrated 5G backhaul, and predictive-maintenance analytics. Equipment vendors respond by embedding software-defined networking and multi-constellation terminals whose adaptive routing improves uptime and mitigates single-orbit failure risks.
Global Onboard Connectivity Market Trends and Insights
Surge in Demand for High-Speed Passenger Wi-Fi
Eighty-seven percent of passengers are willing to view adverts in exchange for free Wi-Fi, shifting revenue models toward advertising-supported access. Broadband-enabled services could generate USD 30 billion in ancillary airline revenue annually by 2035. Viasat now supports more than 60 airlines under advert-funded contracts, demonstrating scale. Passenger surveys indicate that 83% would rebook with carriers offering superior Wi-Fi, cementing connectivity as a differentiator. Maritime lines echo this trajectory; Carnival Corporation's fleet-wide Starlink rollout lifted guest satisfaction and crew welfare. Airlines also merge seatback displays with personal devices, delivering targeted content that boosts brand loyalty and advertising yield.
Rapid Deployment of LEO Constellations
Starlink's initial 12 Direct-to-Cell satellites began text services in 2024, aiming for voice/data capability in 2025, reducing reliance on cabin antennas for many use cases. Viasat integrates Telesat Lightspeed capacity, while Hughes' Fusion package blends LEO and GEO bandwidth for Delta Air Lines. Direct-to-device agreements between satellite and mobile operators eliminate specialized terminals for the rail and maritime sectors. Arctic-region coverage has improved following Eutelsat OneWeb and Intelsat demonstrations above the Arctic Circle. Falling satellite manufacturing costs from 3D printing and vertical integration support competitive pricing that undercuts traditional GEO economics. FCC spectrum allocations further streamline constellation rollouts, shortening time-to-service.
High Retrofit and Certification Costs
Connectivity retrofits can extend 12-18 months and cost millions per aircraft, driven by FAA Advisory Circular 20-168 test requirements. EASA's ETSO framework imposes parallel hurdles for cross-border fleets. Electronically steered antennas introduce new approval categories that lack historical benchmarks, prolonging reviews. Harsh maritime environments demand ruggedized hardware and prolonged sea trials, inflating unit economics. Fixed certification expenses weigh hardest on smaller carriers, reinforcing scale advantages for larger operators.
Other drivers and restraints analyzed in the detailed report include:
- Rising Global Passenger Volumes
- Multi-Orbit Network Reliability Gains
- Stringent Aviation and Maritime Regulation
For complete list of drivers and restraints, kindly check the Table Of Contents.
Segment Analysis
Hardware retained 45.98% of 2024 revenue, covering antennas, modems, and routers that anchor physical links within the onboard connectivity market. Services, however, are forecasted to grow at 12.60% CAGR, reflecting operator preference for outcome-based contracts that shift performance risk to vendors. The onboard connectivity market size attached to managed services is projected to widen as multi-orbit complexity outpaces in-house skill sets.
Service growth parallels rising demand for installation expertise, end-to-end monitoring, and guaranteed uptime. Providers bundle software maintenance, cybersecurity, and regulatory compliance, fostering predictable total cost of ownership. Airlines and rail operators increasingly sign multi-year service agreements that align fees with passenger usage, while maritime firms seek packages that merge crew welfare and operational data backhaul. Hardware vendors respond by embedding software functions that enable remote diagnostics, ensuring continual service revenue even after equipment sale.
Satellite solutions delivered 75.65% of 2024 revenue, underscoring the historical foundation of the onboard connectivity market. Yet, hybrid multi-orbit architectures are expanding at 16.54% CAGR, shifting the competitive center of gravity. The onboard connectivity market share commanded by single-orbit models is expected to narrow as operators prioritize resilience.
Hybrid adoption accelerates because LEO segments cut latency for real-time services, while GEO remains ideal for bulk streaming. Software-defined radios switch between constellations in milliseconds, supporting uninterrupted sessions. Rail corridors in dense geographies deploy ground-to-train 5G for cost-effective capacity, defaulting to satellite over remote stretches. Vendors differentiate via orchestration algorithms that allocate traffic to the lowest-cost path without user intervention.
The Onboard Connectivity Market is Segmented by Component (Hardware, Solution, and Services), Connectivity Technology (Satellite, Air-To-Ground, and Hybrid/Multi-Orbit), Transportation Platform (Aviation, Maritime, and Rail), Application (Entertainment, Communication, Safety and Operations, and Others), and Geography (North America, Europe, Asia-Pacific, and More). The Market Forecasts are Provided in Terms of Value (USD).
Geography Analysis
North America's 41.78% share in 2024 demonstrates the region's early embrace of LEO services, policy clarity, and significant airline upgrade budgets. Gogo's Galileo solution for business aviation highlights demand for globally roaming multi-orbit capability. Federal funding of USD 8.2 billion toward Amtrak's Northeast Corridor accelerates station-to-train Wi-Fi projects. Gulf of Mexico energy assets rely on Tampnet subsea fiber combined with AT&T 5G for offshore coverage.
Asia-Pacific is growing at 13.20% CAGR, powered by USD 43 trillion of infrastructure investment demands through 2035. ASEAN economic-integration plans position digital connectivity as foundational, fostering uniform passenger expectations. High-speed rail in China, Japan, and India embeds multi-gigabit links from design, avoiding retrofit delays. Shipping lines in Singapore retrofit fleets with hybrid terminals that auto-switch between LEO and GEO. The region's young demographic accelerates the adoption of connected entertainment and e-commerce during travel.
Europe maintains steady growth through Trans-European Rail Network expansions and North Sea renewable projects that require robust offshore links. The Starline blueprint for continent-wide rail coverage underlines the European Commission's commitment to seamless roaming. The UK has agreed a public-private deal to eradicate mobile dead zones on main rail routes. Cruise and cargo operators integrate Ka-band capacity with legacy L-band safety channels, balancing redundancy with cost. Stricter data-protection laws oblige suppliers to embed advanced encryption as a default.
- Panasonic Corporation
- Viasat, Inc.
- Intelsat
- Gogo Inc.
- Thales Group
- Honeywell International Inc.
- RTX Corporation
- ALE International
- Huawei Technologies Co., Ltd.
- AT&T Inc.
- Space Exploration Technologies Corp.
- Eutelsat OneWeb (Eutelsat Group)
- SES S.A.
- Cobham Limited
- Anuvu Operations LLC
- Iridium Communications Inc.
Additional Benefits:
- The market estimate (ME) sheet in Excel format
- 3 months of analyst support
TABLE OF CONTENTS
1 INTRODUCTION
- 1.1 Study Assumptions and Market Definition
- 1.2 Scope of the Study
2 RESEARCH METHODOLOGY
3 EXECUTIVE SUMMARY
4 MARKET LANDSCAPE
- 4.1 Market Overview
- 4.2 Market Drivers
- 4.2.1 Surge in demand for high-speed passenger Wi-Fi
- 4.2.2 Rapid deployment of LEO constellations
- 4.2.3 Rising global passenger volumes
- 4.2.4 Advertising-supported connectivity models
- 4.2.5 Multi-orbit network reliability gains
- 4.2.6 Direct-to-device satellite services
- 4.3 Market Restraints
- 4.3.1 High retrofit and certification costs
- 4.3.2 Stringent aviation and maritime regulation
- 4.3.3 RF spectrum congestion (Ku/Ka)
- 4.3.4 Cyber-security vulnerabilities
- 4.4 Value Chain Analysis
- 4.5 Regulatory Landscape
- 4.6 Technological Outlook
- 4.7 Porter's Five Forces Analysis
- 4.7.1 Threat of New Entrants
- 4.7.2 Bargaining Power of Buyers
- 4.7.3 Bargaining Power of Suppliers
- 4.7.4 Threat of Substitutes
- 4.7.5 Competitive Rivalry
5 MARKET SIZE AND GROWTH FORECASTS (VALUE)
- 5.1 By Component
- 5.1.1 Hardware
- 5.1.1.1 Antenna Systems
- 5.1.1.2 Modems and Routers
- 5.1.1.3 Wireless Access Points
- 5.1.2 Solution
- 5.1.2.1 Network-Management Platforms
- 5.1.2.2 Content Management Systems
- 5.1.3 Services
- 5.1.3.1 Installation and Integration
- 5.1.3.2 Managed Connectivity
- 5.1.3.3 Support and Maintenance
- 5.1.1 Hardware
- 5.2 By Connectivity Technology
- 5.2.1 Satellite
- 5.2.2 Air-to-Ground (ATG)
- 5.2.3 Hybrid/Multi-Orbit
- 5.3 By Transportation Platform
- 5.3.1 Aviation
- 5.3.1.1 Commercial Airlines
- 5.3.1.2 Business Jets
- 5.3.1.3 Unmanned Systems
- 5.3.2 Maritime
- 5.3.2.1 Commercial Shipping
- 5.3.2.2 Cruise and Ferry
- 5.3.2.3 Offshore Energy
- 5.3.3 Rail
- 5.3.3.1 High-Speed
- 5.3.3.2 Commuter and Metro
- 5.3.1 Aviation
- 5.4 By Application
- 5.4.1 Entertainment
- 5.4.2 Communication
- 5.4.3 Safety and Operations
- 5.4.4 Others
- 5.5 By Geography
- 5.5.1 North America
- 5.5.1.1 United States
- 5.5.1.2 Canada
- 5.5.1.3 Mexico
- 5.5.2 Europe
- 5.5.2.1 Germany
- 5.5.2.2 United Kingdom
- 5.5.2.3 France
- 5.5.2.4 Russia
- 5.5.2.5 Rest of Europe
- 5.5.3 Asia-Pacific
- 5.5.3.1 China
- 5.5.3.2 Japan
- 5.5.3.3 India
- 5.5.3.4 Australia
- 5.5.3.5 Rest of Asia-Pacific
- 5.5.4 South America
- 5.5.4.1 Brazil
- 5.5.4.2 Rest of South America
- 5.5.5 Middle East and Africa
- 5.5.5.1 Middle East
- 5.5.5.1.1 United Arab Emirates
- 5.5.5.1.2 Saudi Arabia
- 5.5.5.1.3 Rest of Middle East
- 5.5.5.2 Africa
- 5.5.5.2.1 South Africa
- 5.5.5.2.2 Rest of Africa
- 5.5.1 North America
6 COMPETITIVE LANDSCAPE
- 6.1 Market Concentration
- 6.2 Strategic Moves
- 6.3 Market Share Analysis
- 6.4 Company Profiles (includes Global level Overview, Market level overview, Core Segments, Financials as available, Strategic Information, Market Rank/Share, Products and Services, Recent Developments)
- 6.4.1 Panasonic Corporation
- 6.4.2 Viasat, Inc.
- 6.4.3 Intelsat
- 6.4.4 Gogo Inc.
- 6.4.5 Thales Group
- 6.4.6 Honeywell International Inc.
- 6.4.7 RTX Corporation
- 6.4.8 ALE International
- 6.4.9 Huawei Technologies Co., Ltd.
- 6.4.10 AT&T Inc.
- 6.4.11 Space Exploration Technologies Corp.
- 6.4.12 Eutelsat OneWeb (Eutelsat Group)
- 6.4.13 SES S.A.
- 6.4.14 Cobham Limited
- 6.4.15 Anuvu Operations LLC
- 6.4.16 Iridium Communications Inc.
7 MARKET OPPORTUNITIES AND FUTURE OUTLOOK
- 7.1 White-space and Unmet-Need Assessment


