


 |
市场调查报告书
商品编码
1842511
资料分类:市场占有率分析、产业趋势、统计资料、成长预测(2025-2030)Data Classification - Market Share Analysis, Industry Trends & Statistics, Growth Forecasts (2025 - 2030) |
||||||
※ 本网页内容可能与最新版本有所差异。详细情况请与我们联繫。
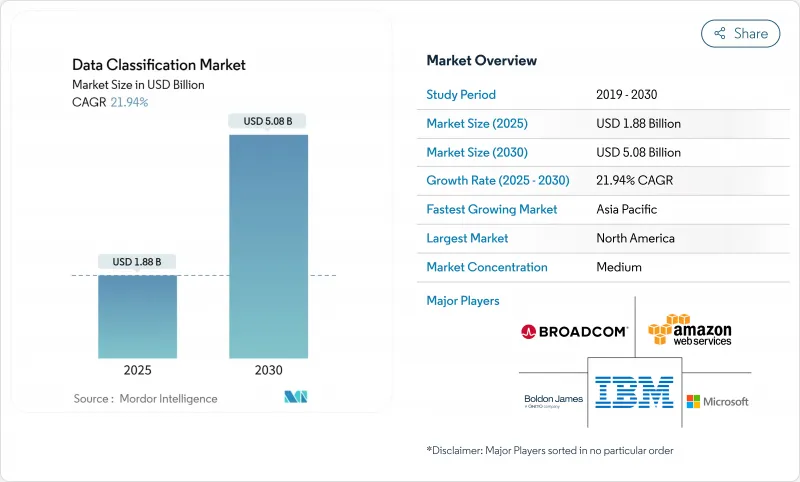
数据分类市场预计在 2025 年创造 18.8 亿美元的收入,到 2030 年将达到 50.8 亿美元,复合年增长率为 21.9%。
资料快速成长(估计每天产生 3.2877 亿 TB)以及全球隐私法规的加强,正在推动企业采用即时、人工智慧驱动的资料标记技术,该技术可在混合云中扩展。嵌入云端原生架构的人工智慧分类引擎正在非结构化储存库中发现敏感讯息,而亚太地区的主权云端计画正在推动需求。到 2024 年,能源产业资料外洩的平均成本将达到 478 万美元,这一威胁日益严重,进一步凸显了自动化管治的迫切性。 AWS 和微软等超大规模企业对区域资料中心的投资正透过降低延迟和满足居住法规而获得发展势头。
全球数据分类市场趋势与洞察
扩大全球隐私义务
欧洲 DORA 法规和更新的 HIPAA 标准正在将合规性从定期审核转变为持续检验,要求公司将分类逻辑直接建置到资料处理工作流程中。在多个司法管辖区营运的跨国公司通常以最严格的全球要求为基准,从而加速统一分类架构的采用。金融机构必须在几分钟内完成洗钱防制报告,这增加了对政策主导发现的需求。与 GDPR 相符的拉丁美洲资料主权法也施加了类似的压力。这些要求正在缩短采购週期,推动中型市场公司转向基于 SaaS 的工具来自动更新政策。
非结构化资料的爆炸性成长与外洩风险
非结构化储存库每年成长62%,导致安全团队无法确定敏感记录的持有者。企业报告称,82%的文件共用权限过高,导致宝贵的设计和客户资料外洩。能源和公用事业公司目前每周遭受1100次网路攻击,漏洞调查发现,文件分类错误是根本原因。律师事务所也同样受到共用磁碟机上未标记的客户文件的影响。静态规则集无法跟上动态协作平台的步伐,因此基于人工智慧的模式识别日益成为首选解决方案。
缺乏跨行业分类标准
金融监管机构对风险资料的分类与医疗保健机构不同,要求供应商维护特定产业的规则库。跨国公司在传输文件时必须将GDPR术语与中国对「敏感资料」的定义相协调。这种分散化增加了客製化编码的工作量,引发了对供应商锁定的担忧,并减缓了采购决策。产业联盟正在起草开放架构提案,但采用情况仍参差不齐。因此,整合商从映射研讨会而非纯粹的软体授权中获得了大量收益。
細項分析
软体将继续创造最高收益,到 2024 年将占资料分类市场的 68.5%。许可证销售主要集中在策略引擎、发现爬虫类和 SaaS 仪表板上。儘管如此,随着企业寻求指导以清除长期存在的分类债务,专业服务和託管服务正以 23.9% 的复合年增长率扩张。合约通常从多Petabyte扫描开始,造成补救积压并使内部资源紧张。託管服务提供者透过提供基于订阅的模型再培训、监管更新和工单分类来填补技能差距。这些合约可以跨越多年,将支出从一次性资本支出转变为经常性营运支出。这种方法与寻求可预测预算和可审核证据的董事会产生了共鸣。服务可能占数据分类市场的 21.5 亿美元,反映了它们的战略重要性。因此,软体供应商将咨询功能捆绑到高阶层以确保净利率。
第二代实施依赖持续调优,而非年度健康检查。服务合作伙伴建立 DevSecOps 管线,并在新资料进入物件储存时启动分类。在业务部门之间制定共用分类法还可以缩短收购期间的部署时间。这一趋势扩大了数据分类市场,使中型企业能够租用专业知识,而不是僱用稀缺的专家。供应商市场现在提供符合 ISO 27001、HIPAA 或 PCI 模板的服务包,进一步实现了采用的民主化。随着服务收益的成长,系统整合商正在收购精品咨询顾问,以增强其领域知识并巩固市场份额。
基于内容的检测,利用正规表示式和指纹辨识来标记智慧财产权,将在2024年占支出的43.2%。然而,机器主导的语意模型(从数百万个标记文件中学习情境)的复合年增长率为22.8%。诸如变压器网路之类的模式盲功能可以分析句子结构,从而提高召回率并减少误报。 Microsoft Purview基于全球远端检测进行学习,并定期更新其模型,无需客户操作。 Digital Guardian将位置和装置姿态等上下文讯号迭加在内容线索之上,以实现风险加权标记。结合这些方法,管理员可以在不中断业务的情况下逐步引入新引擎。
机器学习的早期采用者报告称,由于需要人工判断的项目减少,审核人员的工作效率提高了35%。拥有多语言檔案的组织看到了显着的效益,因为语义模型比手动关键字清单更能处理语言差异。供应商正在开放API,用于整合客户特定的本体,从而无需进行新的开发即可实现客製化的准确性。这种转变正在推动资料分类市场的发展,将曾经的精英能力转变为SaaS的可选项。即便如此,训练资料仍然是利基领域的瓶颈,一些公司正在根据互惠协议共用匿名语料库。未来预测表明,机器学习的采用将使价值实现时间从几个季度缩短至几週,使机器学习成为预设方法。
区域分析
北美维持领先地位,占2024年总收入的41.0%。严格的监管和早期人工智慧的采用促使企业对其发现项目进行现代化改造。 BigID在2025年完成的6,000万美元资金筹措表明,新创公司对在SEC新资讯揭露规则出台前实现资料卫生自动化的解决方案充满热情。金融机构实施标籤以支援日内报告,医疗保健提供者将标籤整合到电子健康记录中,以符合不断发展的《健康保险流通与责任法案》(HIPAA) 扩展规定。加拿大各省的隐私权法与联邦要求相呼应,这进一步增强了市场对此类方案的持续需求。墨西哥的高科技产业丛集正在采用云端託管平台以满足USMCA的资料传输规定,但目前这类方案的采用主要集中在跨国子公司。
亚太地区成长最快,复合年增长率达22.5%,这反映了主权云的授权以及超超大规模资料中心业者在基础设施方面的巨额支出。 AWS已向马来西亚投资60亿美元,NTT则向曼谷资料中心投资9,000万美元,用于建置本地运算,以降低策略引擎的延迟。中国提案放宽对出站资料的核准,但仍将许多资料集归类为「关键」资料集,并实施双重控制。日本和韩国正在引入5G製造分类,以保护商业机密。印度IT服务出口商要求使用多租户标记来隔离客户数据,从而扩大可寻址的云端用户池。
欧洲在以金额为准方面排名第二,这得益于《数位营运弹性法案》,该法案要求到 2025 年必须进行持续控制测试。德国工业 4.0 工厂正在标记营运数据,以保护智慧财产权并遵守供应链安全审核。英国在脱欧后的正当性与国内创新规则之间取得平衡,而企业则在双重政策下监控跨境流动。法国推广主权云区来託管公共部门工作负载,义大利则加强关键基础设施保护。北欧国家是 GDPR 的早期采用者,正在试行机密运算晶片,这种晶片可以在不暴露明文的情况下进行内联标记,为下一波创新浪潮做好准备。
其他福利:
- Excel 格式的市场预测 (ME) 表
- 3个月的分析师支持
目录
第一章 引言
- 研究假设和市场定义
- 调查范围
第二章调查方法
第三章执行摘要
第四章 市场状况
- 市场概况
- 市场驱动因素
- 扩大全球隐私保护范围
- 非结构化资料爆炸性成长,资料外洩风险
- 云端原生资料分类的需求
- 基于AI/ML的自动分类进入大规模生产
- 机密运算晶片组支援内嵌标记
- GenAI 安全需要细粒度的资料标记
- 市场限制
- 缺乏跨行业分类标准
- 与遗留资产的整合成本高
- 由于合成资料的盛行而导致的资料分类错误
- 同态加密减慢明文检查速度
- 价值链分析
- 监管状况
- 技术展望
- 波特五力分析
- 供应商的议价能力
- 消费者议价能力
- 新进入者的威胁
- 替代品的威胁
- 竞争对手之间的竞争强度
- 评估宏观经济趋势对市场的影响
第五章市场规模及成长预测
- 按组件
- 软体
- 服务
- 按分类方法
- 基于内容
- 基于上下文
- 基于使用者/角色
- 机器学习驱动和语义
- 按组织规模
- 大公司
- 中小企业
- 按用途
- 存取控制和 IAM
- 管治与合规
- 电子邮件和行动保护
- 按行业
- BFSI
- 医疗保健和生命科学
- 政府和国防
- IT和电信
- 能源与公共产业
- 其他行业
- 按地区
- 北美洲
- 美国
- 加拿大
- 墨西哥
- 欧洲
- 德国
- 英国
- 法国
- 义大利
- 西班牙
- 其他欧洲国家
- 亚太地区
- 中国
- 日本
- 印度
- 韩国
- 澳洲
- 其他亚太地区
- 南美洲
- 巴西
- 阿根廷
- 其他南美
- 中东和非洲
- 中东
- 沙乌地阿拉伯
- 阿拉伯聯合大公国
- 土耳其
- 其他中东地区
- 非洲
- 南非
- 埃及
- 奈及利亚
- 其他非洲国家
- 北美洲
第六章 竞争态势
- 市场集中度
- 策略倡议
- 市占率分析
- 公司简介
- Amazon Web Services
- Microsoft Corporation
- IBM Corporation
- Broadcom(Symantec)
- Google LLC
- OpenText(TITUS)
- Thales Group
- Fortra(Boldon James)
- SECLORE
- Digital Guardian
- Forcepoint
- Varonis Systems
- BigID Inc.
- Concentric AI
- Netwrix Corporation
- Spirion LLC
- Immuta Inc.
- OneTrust LLC
- PKWARE Inc.
- Palo Alto Networks
第七章 市场机会与未来展望
The data classification market size is currently generating USD 1.88 billion in 2025 and is forecast to reach USD 5.08 billion by 2030, translating into a 21.9% CAGR.
Rapid data growth, estimated at 328.77 million TB created every day, and tougher global privacy mandates are pushing enterprises to adopt real-time, AI-enabled data labeling that scales across hybrid cloud estates. AI-powered classification engines embedded in cloud-native architectures now detect sensitive information across unstructured repositories, while sovereign-cloud initiatives in Asia-Pacific propel regional demand. The rising threat landscape, where the average energy-sector breach cost hit USD 4.78 million in 2024, further underscores the urgency of automated governance. Investments by hyperscalers such as AWS and Microsoft in regional data centers add momentum by lowering latency and meeting residency rules.
Global Data Classification Market Trends and Insights
Expanding Global Privacy Mandates
European DORA rules and updated HIPAA standards shift compliance from scheduled audits to continuous verification, obliging firms to embed classification logic directly into data processing workflows. Multinational enterprises operating in multiple jurisdictions often apply the strictest global requirement as the baseline, which accelerates deployment of unified classification architectures. Financial institutions must meet anti-money-laundering reporting within minutes, increasing demand for policy-driven discovery. Similar pressure comes from Latin American data sovereignty statutes that align with GDPR. Together these mandates shorten procurement cycles, nudging even mid-sized firms toward SaaS-based tools that update policies automatically.
Explosive Growth of Unstructured Data and Breach Risk
Unstructured repositories grow 62% each year, leaving security teams blind to who holds sensitive records. Enterprises report excessive permissions on 82% of file shares, which exposes valuable designs and customer data. Energy utilities now see 1,100 weekly cyberattacks, and breach investigations show mis-classified documents as a root cause. Law practices suffer similar exposure because client files sit in shared drives without labels. AI-driven pattern recognition is increasingly chosen because static rule sets cannot keep pace with dynamic collaboration platforms.
Lack of Cross-Industry Taxonomy Standards
Financial regulators classify risk data differently from medical authorities, forcing vendors to maintain sector-specific rule libraries. Multinationals must reconcile GDPR terminology with China's definition of "important data" when transferring files. This fragmentation drives custom coding effort, increases vendor lock-in fears, and slows purchasing decisions. Industry alliances are drafting open schema proposals but adoption remains uneven. As a result, integrators earn sizeable revenue from mapping workshops rather than from pure software licenses.
Other drivers and restraints analyzed in the detailed report include:
- Cloud-Native Data Classification Demand
- AI/ML-Powered Auto-Classification Hitting Production at Scale
- High Integration Cost in Legacy Estates
For complete list of drivers and restraints, kindly check the Table Of Contents.
Segment Analysis
Software continued to generate the highest revenue, translating into 68.5% of the data classification market in 2024. License sales centered on policy engines, discovery crawlers, and SaaS dashboards. Even so, professional and managed services are scaling at a 23.9% CAGR because enterprises need guidance to clear long-standing classification debt. Engagements often begin with multi-petabyte scans that feed remediation backlogs and stretch internal resources. Managed service providers supplement skill shortages by handling model retraining, regulatory updates, and ticket triage on a subscription basis. These contracts can span several years, which shifts spending from one-time capital expense to recurring OPEX. The approach resonates with boards seeking predictable budgets and audit-ready evidence. In monetary terms, services could represent USD 2.15 billion of the data classification market size by 2030, reflecting their strategic importance. Software vendors are therefore bundling advisory capacity into premium tiers to protect margins.
Second-generation implementations rely on continuous tuning rather than annual health checks. Service partners build DevSecOps pipelines that trigger classification whenever new data lands in object storage. They also codify shared taxonomies across business units, which compresses onboarding timelines for acquisitions. The trend broadens the data classification market because mid-tier firms can rent expertise instead of hiring scarce specialists. Vendor marketplaces now list curated service bundles that align to ISO 27001, HIPAA, or PCI templates, further democratizing adoption. As services revenue accelerates, system integrators are acquiring boutique consultancies to strengthen domain knowledge and secure wallet share.
Content-based inspection held 43.2% of spending in 2024 by leveraging regex and fingerprinting to flag intellectual property. Yet ML-driven and semantic models are compounding at a 22.8% CAGR by learning context from millions of labeled documents. Pattern-blind capabilities, such as transformer networks that analyze sentence structure, lift recall rates and cut false alerts. Microsoft Purview trains on global telemetry, which fuels regular model refreshes without customer action. Digital Guardian layers contextual signals like location and device posture on top of content clues, enabling risk-weighted tagging. Combined approaches now ship as pre-configured bundles so administrators can phase in new engines without business disruption.
Early adopters report that ML lifts reviewer productivity by 35%, as fewer items require human adjudication. Organizations with multilingual archives gain measurable benefit because semantic models handle language variance better than manual keyword lists. Vendors are opening APIs to integrate customer-specific ontologies, bringing bespoke accuracy without ground-up development. The shift boosts the data classification market because it turns what was once an elite capability into a SaaS checkbox. Training data nevertheless remains a bottleneck for niche domains, prompting some firms to share anonymized corpora under mutual-benefit agreements. Over the forecast horizon, ML adoption is expected to reduce time-to-value from quarters to weeks, cementing its role as the default methodology.
The Data Classification Market Report is Segmented by Component (Software and Services), Classification Method (Content-Based, Context-Based, and More), Organization Size (Large Enterprises and Small and Medium Enterprises (SMEs)), Application (Access Control and IAM, Governance and Compliance, and More), Industry Vertical (BFSI, and More), and Geography. The Market Forecasts are Provided in Terms of Value (USD).
Geography Analysis
North America retained leadership with 41.0% of 2024 revenue because stringent regulations and early AI adoption pushed enterprises to modernize discovery programs. BigID's USD 60 million funding round in 2025 exemplifies venture appetite for solutions that automate data hygiene ahead of new SEC disclosure rules. Financial institutions deploy labeling to meet intraday reporting, while healthcare providers integrate tags into electronic medical records to comply with evolving HIPAA expansions. Canada's provincial privacy acts mirror federal requirements, reinforcing consistent demand. Mexico's tech clusters adopt cloud-hosted platforms to meet USMCA data-transfer clauses, though uptake concentrates in multinational subsidiaries.
Asia-Pacific is the fastest-growing region with a 22.5% CAGR, reflecting sovereign-cloud mandates and heavy infrastructure spending by hyperscalers. AWS pledged USD 6 billion to Malaysia and NTT committed USD 90 million to Bangkok data centers, creating local compute that reduces latency for policy engines. China proposes easing outbound data approval but still labels many datasets as "important," forcing dual controls. Japan and South Korea deploy classification in 5G manufacturing to protect trade secrets. India's IT-services exporters demand multi-tenant tagging to segregate client data, expanding the addressable pool of cloud subscribers.
Europe ranks a solid second by value, propelled by the Digital Operational Resilience Act that requires continuous control testing by 2025. Germany's Industry 4.0 plants tag operational data to safeguard intellectual property and comply with supply-chain security audits. The United Kingdom balances post-Brexit adequacy with domestic innovation rules, so firms monitor cross-border flows under dual policies. France promotes sovereign cloud zones to host public-sector workloads, while Italy tightens critical-infrastructure protections. Nordic countries, early GDPR adopters, now pilot confidential-computing chips that enable inline tagging without exposing clear text, positioning the region for next-wave innovation.
- Amazon Web Services
- Microsoft Corporation
- IBM Corporation
- Broadcom (Symantec)
- Google LLC
- OpenText (TITUS)
- Thales Group
- Fortra (Boldon James)
- SECLORE
- Digital Guardian
- Forcepoint
- Varonis Systems
- BigID Inc.
- Concentric AI
- Netwrix Corporation
- Spirion LLC
- Immuta Inc.
- OneTrust LLC
- PKWARE Inc.
- Palo Alto Networks
Additional Benefits:
- The market estimate (ME) sheet in Excel format
- 3 months of analyst support
TABLE OF CONTENTS
1 INTRODUCTION
- 1.1 Study Assumptions and Market Definition
- 1.2 Scope of the Study
2 RESEARCH METHODOLOGY
3 EXECUTIVE SUMMARY
4 MARKET LANDSCAPE
- 4.1 Market Overview
- 4.2 Market Drivers
- 4.2.1 Expanding global privacy mandates
- 4.2.2 Explosive growth of unstructured data and breach risk
- 4.2.3 Cloud-native data classification demand
- 4.2.4 AI/ML-powered auto-classification hitting production at scale
- 4.2.5 Confidential-computing chipsets enabling inline tagging
- 4.2.6 GenAI safety requiring fine-grained data labeling
- 4.3 Market Restraints
- 4.3.1 Lack of cross-industry taxonomy standards
- 4.3.2 High integration cost in legacy estates
- 4.3.3 "Classification debt" from synthetic data proliferation
- 4.3.4 Homomorphic encryption delaying clear-text inspection
- 4.4 Value Chain Analysis
- 4.5 Regulatory Landscape
- 4.6 Technological Outlook
- 4.7 Porter's Five Forces Analysis
- 4.7.1 Bargaining Power of Suppliers
- 4.7.2 Bargaining Power of Consumers
- 4.7.3 Threat of New Entrants
- 4.7.4 Threat of Substitute Products
- 4.7.5 Intensity of Competitive Rivalry
- 4.8 Assessment of the Impact of Macroeconomic Trends on the Market
5 MARKET SIZE AND GROWTH FORECASTS (VALUE)
- 5.1 By Component
- 5.1.1 Software
- 5.1.2 Services
- 5.2 By Classification Method
- 5.2.1 Content-based
- 5.2.2 Context-based
- 5.2.3 User-/Role-based
- 5.2.4 ML-driven and Semantic
- 5.3 By Organization Size
- 5.3.1 Large Enterprises
- 5.3.2 Small and Medium Enterprises (SMEs)
- 5.4 By Application
- 5.4.1 Access Control and IAM
- 5.4.2 Governance and Compliance
- 5.4.3 Email and Mobile Protection
- 5.5 By Industry Vertical
- 5.5.1 BFSI
- 5.5.2 Healthcare and Life Sciences
- 5.5.3 Government and Defence
- 5.5.4 IT and Telecom
- 5.5.5 Energy and Utilities
- 5.5.6 Other Industry Verticals
- 5.6 By Geography
- 5.6.1 North America
- 5.6.1.1 United States
- 5.6.1.2 Canada
- 5.6.1.3 Mexico
- 5.6.2 Europe
- 5.6.2.1 Germany
- 5.6.2.2 United Kingdom
- 5.6.2.3 France
- 5.6.2.4 Italy
- 5.6.2.5 Spain
- 5.6.2.6 Rest of Europe
- 5.6.3 Asia-Pacific
- 5.6.3.1 China
- 5.6.3.2 Japan
- 5.6.3.3 India
- 5.6.3.4 South Korea
- 5.6.3.5 Australia
- 5.6.3.6 Rest of Asia-Pacific
- 5.6.4 South America
- 5.6.4.1 Brazil
- 5.6.4.2 Argentina
- 5.6.4.3 Rest of South America
- 5.6.5 Middle East and Africa
- 5.6.5.1 Middle East
- 5.6.5.1.1 Saudi Arabia
- 5.6.5.1.2 United Arab Emirates
- 5.6.5.1.3 Turkey
- 5.6.5.1.4 Rest of Middle East
- 5.6.5.2 Africa
- 5.6.5.2.1 South Africa
- 5.6.5.2.2 Egypt
- 5.6.5.2.3 Nigeria
- 5.6.5.2.4 Rest of Africa
- 5.6.1 North America
6 COMPETITIVE LANDSCAPE
- 6.1 Market Concentration
- 6.2 Strategic Moves
- 6.3 Market Share Analysis
- 6.4 Company Profiles (includes Global level Overview, Market level overview, Core Segments, Financials as available, Strategic Information, Market Rank/Share for key companies, Products and Services, and Recent Developments)
- 6.4.1 Amazon Web Services
- 6.4.2 Microsoft Corporation
- 6.4.3 IBM Corporation
- 6.4.4 Broadcom (Symantec)
- 6.4.5 Google LLC
- 6.4.6 OpenText (TITUS)
- 6.4.7 Thales Group
- 6.4.8 Fortra (Boldon James)
- 6.4.9 SECLORE
- 6.4.10 Digital Guardian
- 6.4.11 Forcepoint
- 6.4.12 Varonis Systems
- 6.4.13 BigID Inc.
- 6.4.14 Concentric AI
- 6.4.15 Netwrix Corporation
- 6.4.16 Spirion LLC
- 6.4.17 Immuta Inc.
- 6.4.18 OneTrust LLC
- 6.4.19 PKWARE Inc.
- 6.4.20 Palo Alto Networks
7 MARKET OPPORTUNITIES AND FUTURE OUTLOOK
- 7.1 White-Space and Unmet-Need Assessment
 资料分类市场预测至 2032 年:按组件、资料类型、组织规模、部署类型、安全性与合规重点、最终用户和地区分類的全球分析
 资料分类市场 - 全球产业规模、份额、趋势、机会和预测(按组件、类型、垂直行业、地区和竞争细分,2020-2030 年)
 2026 年至 2032 年资料分类市场(按组件、方法、应用、最终用户产业和地区划分)
 全球资料分类市场规模研究,按组件、分类、应用、垂直和区域预测 2022-2032 年
 全球资料分类市场规模、份额和趋势分析报告(按组成部分、按应用、按分类、按行业、按地区、展望和预测,2024-2031)
 资料分类市场规模、份额和趋势分析报告:2024-2030 年按组件、分类、应用、行业、地区和细分市场进行的预测