


 |
市场调查报告书
商品编码
1842544
分析仪器:市场份额分析、行业趋势、统计数据和成长预测(2025-2030 年)Analytical Instrumentation - Market Share Analysis, Industry Trends & Statistics, Growth Forecasts (2025 - 2030) |
||||||
※ 本网页内容可能与最新版本有所差异。详细情况请与我们联繫。
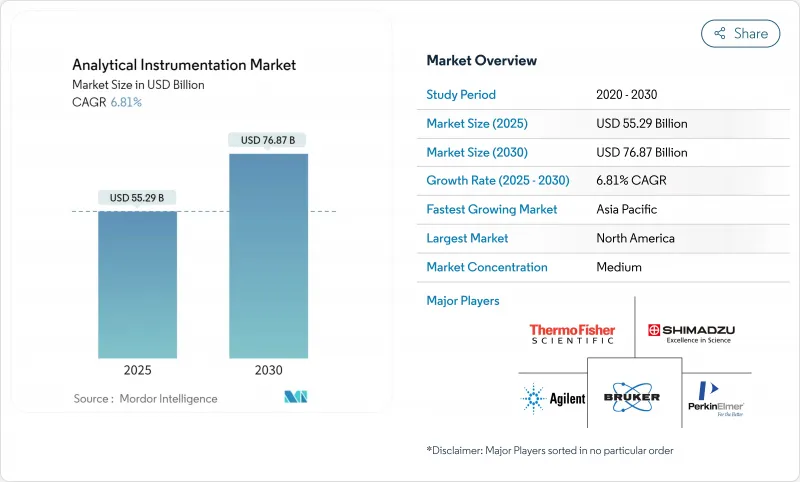
分析仪器市场预计在 2025 年达到 552.9 亿美元,在 2030 年达到 768.7 亿美元,复合年增长率为 6.81%,显示高精度测量工具将强劲扩张。
製药和环境监测领域监管力度的加强、3奈米以下半导体节点的快速扩展以及人工智慧与实验室硬体的融合,正在推动所有主要终端用户群体的采用。供应商正在加大对用于连续製药生产的即时放行检测解决方案、用于PFAS控制的超痕量光谱平台以及支援生技药品研发的多组体学质谱仪的投资。同时,氦气供应的不稳定性正在重塑气相层析法工作流程,持续的分析化学人才短缺推高了外包成本,并促使买家转向自动化。这些因素共同作用,使分析设备市场保持价格竞争力,并加速其升级换代。
全球分析仪器市场趋势与洞察
生技药品品质保证/品质控制中越来越多地采用联用技术
对复杂生技药品的需求日益增长,促使製造商用联用液相层析法-质谱平台取代单维方法。目前,近78%的生物製药厂在其品质营运中至少拥有一个联用工作流程,高于2023年的水平,从而能够对关键品质属性进行多属性监控,并将批次拒收率降低15%。增强的系统整合能够即时分析转译后修饰,加速生产规模扩大和产品发布进度。增强的系统整合能够即时分析转译后修饰,加速生产规模扩大和产品发布进度。这些优势正在推动资本预算转向高解析度液相层析串联质谱(LC-MS/MS),并加强供应商对自动化资料流程的投资。
全球对 PFAS 和微塑胶的监管趋严推动超微量分析
欧洲指令中关于万亿分之一(PPT)的法规,与2024年美国饮用水法规并行,迫使实验室添置下一代高分辨率质谱仪以及能够识别小至1微米颗粒的拉曼或傅立叶变换红外线显微镜。随着超短链PFAS检测成为强制性要求,这一趋势可能会持续下去。市场领导目前正在捆绑自动化样品製备,以延长运行间隔并降低检测阈值,从而增强耗材的经常性收益。
高分辨率 MS 的总体拥有成本较高
旗舰质谱仪的价格在50万美元到150万美元之间,但由于服务合约、基础设施维修和专用耗材等因素,五年营运成本往往超过购买价格。由于关税和本地服务能力有限,新兴市场的实验室面临的总体拥有成本(TCO)高出30%到45%。即使监管趋严,这些障碍也减缓了水质和食品安全领域应用该技术的速度,促使供应商部署精简的「价值工程」模型和共用服务中心。
細項分析
层析法系统将在 2024 年创造 154.8 亿美元的收益,占分析仪器市场份额的 28%。人工智慧校准程序可将吞吐量提高高达 70%,而预测演算法可以指示维护需求并支援 HPLC 和气相层析的持续升级。在环境实验室中,对 PFAS 进行分析的需求正在重新激发对先进色谱柱化学和串联检测器的需求。同时,质谱仪是成长最快的产品领域,预计到 2030 年将以 7.1% 的复合年增长率增长,因为离子淌度创新(例如具有淌度匹配碎裂的并行累积)可将试样处理通量提高五倍并突破灵敏度的上限。
质谱分析仪器市场在需要更深入的分子层面洞察的行业中日益增长,例如临床蛋白质组学、食品真伪鑑定和电池材料。三重四极和Q-TOF配置因其速度和分辨率的平衡而占据了新安装设备的大多数。供应商的蓝图以超高场Orbitrap和timsTOF架构为中心,将硬体进步与云端基础的反捲积平台相结合,以缩短资料处理时间并释放宝贵的分析师时间。虽然分子光谱仍然是常规品质保证/品质控制的核心收益支柱,但拉曼光谱在製药连续生产领域正逐渐兴起,其中线上探针可以即时检验混合均匀性。
高效液相层析和超高效液相层析法系统占该类别的56%,达到86.7亿美元,这得益于其卓越的重现性和基质耐受性,使其成为效价、杂质和稳定性测试的关键。人工智慧外挂程式可自动执行梯度设计、流动相选择和故障预测,使试样处理通量提高高达70%,同时消除色谱柱浪费。微流体晶片色谱柱正被引入蛋白质组学工作流程,实现与快速扫描质谱仪同步的亚分钟分离,以支援数据丰富的多组体学研究。
预计到2030年,超临界流体层析的复合年增长率将达到7.3%,成为成长最快的液相分离技术。使用二氧化碳和少量助溶剂可以实现绿色化学目标,降低单位样品的溶剂成本,从而在掌性药物筛检和杂质分离领域提供极具吸引力的投资回报率。气相层析法是挥发性物质分析的关键,但氦气短缺推高了营业成本,加速了氢载体和微通道层析法的转变。随着监管机构加强对饮用水和工业废水中离子污染物的限制,离子层析法正重新受到人们的关注。公用事业单位被要求添加自动化线上抑制器系统,以实现全天候监控。
区域分析
2024年,北美市场将达到193.5亿美元,占分析仪器市场的35%。 FDA主导的即时排放检测、EPA强制执行的万亿分之几PFAS法规,以及520亿美元的《晶片法案》(CHIPS Act)——该法案将资助采用亚奈米计量技术的新工厂——将推动需求成长。实验室正在透过采用氢能气相层析和低废物高效液相层析泵来降低氦气成本和溶剂浪费,展现其对更绿色工作流程的承诺。
亚太地区预计将以7.6%的复合年增长率成长,这反映了中国和印度製药製造业的规模扩张,以及台湾和韩国先进逻辑和记忆体生产的扩大。地区政府正在加强水质和工业排放标准,鼓励国有实验室竞标ICP-MS、LC-MS/MS、手持式拉曼光谱仪等设备的多年期采购合约。随着晶圆代工厂竞相开发环栅电晶体和高频宽记忆体,亚太地区用于半导体品质保证/品质控制的分析设备市场规模预计将超过所有其他垂直领域。
欧洲保持着强而有力的监管主导立场。 《欧洲绿色交易》正在资助全国的PFAS监测、循环经济研究和无溶剂层析法试点计画。德国、爱尔兰和瑞士的製药中心正在整合包含PAT分析的连续生产线。同时,随着炼油厂、农产品出口商和矿业公司对实验室进行现代化升级以满足国际贸易认证,南美洲和中东/非洲地区正在实现稳定但温和的成长。由于高昂的TCO仍然是一个障碍,经销商越来越多地推广先租后买和按样品付费的模式,以降低首次购买者的准入门槛。
其他福利:
- Excel 格式的市场预测 (ME) 表
- 3个月的分析师支持
目录
第一章 引言
- 研究假设和市场定义
- 调查范围
第二章调查方法
第三章执行摘要
第四章 市场状况
- 市场概况
- 市场驱动因素
- 生技药品品质保证/品质控制中越来越多地采用联用技术
- 全球对 PFAS 和微塑胶的监管日益严格,推动超微量分析方法的发展
- 药品生产转向即时放行测试(RTRT)
- 将半导体节点缩小到 3 奈米以下需要超灵敏的表面分析。
- 扩大可再生航空燃料计划以促进原料认证
- 透过实验室分析,电池超级工厂的品质保证快速成长
- 市场限制
- 新兴市场高解析度质谱的整体拥有成本较高
- 熟练分析化学家的短缺导致外包成本上升
- 氦气供应链波动影响气相层析操作
- 受监管领域新分析方法的验证週期较长
- 产业生态系统分析
- 监理展望
- 技术展望
- 波特五力分析
- 供应商的议价能力
- 买方的议价能力
- 新进入者的威胁
- 替代品的威胁
- 竞争程度
第五章 市场规模及成长预测(金额)
- 依产品类型
- 层析法设备
- 气相层析法(GC)系统
- 高效/超高效液相层析(HPLC/UHPLC)
- 离子层析法(IC)系统
- 超临界流体层析(SFC)系统
- 分子光谱学
- 紫外可见光谱仪
- 傅立叶转换红外线(FT-IR)光谱仪
- 近红外线(NIR)光谱仪
- 拉曼光谱仪
- 萤光光谱仪
- 元素光谱学
- 原子吸收光谱仪(AAS)
- 电感耦合等离子体发射光谱仪(ICP-OES)
- 电感耦合等离子体质谱仪(ICP-MS)
- X光萤光(XRF)光谱仪
- 质谱法
- 单四极质谱系统
- 四极质谱系统
- 四极飞行时间(Q-TOF) 质谱系统
- Orbitrap 和 FT-MS 系统
- MALDI-TOF质谱系统
- 分析显微镜和成像系统
- 扫描电子显微镜(SEM)
- 穿透式电子显微镜(TEM)
- 原子力显微镜(AFM)
- 共聚焦显微镜和光学显微镜
- 表面、热和颗粒表征设备
- X射线衍射(XRD)系统
- 热分析设备(DSC、TGA等)
- 粒度和ZETA电位分析仪
- 耗材及配件
- 资料管理软体和服务
- 层析法设备
- 按最终用户产业
- 製药和生物製药
- 药物发现与开发
- 製造品质保证/品质控制
- 临床和诊断实验室
- 环境测试实验室
- 食品和饮料测试
- 化工/石化
- 石油和天然气(上游、中游、下游)
- 材料科学/冶金学
- 半导体和电子
- 学术和政府研究机构
- 取证与安全
- 用水和污水业务
- 製药和生物製药
- 按地区
- 北美洲
- 美国
- 加拿大
- 墨西哥
- 欧洲
- 德国
- 英国
- 法国
- 义大利
- 西班牙
- 北欧的
- 其他欧洲国家
- 亚太地区
- 中国
- 日本
- 韩国
- 印度
- 东南亚
- 澳洲
- 其他亚太地区
- 南美洲
- 巴西
- 南美洲其他地区
- 中东和非洲
- 中东
- 阿拉伯聯合大公国
- 沙乌地阿拉伯
- 其他中东地区
- 非洲
- 南非
- 其他非洲国家
- 北美洲
第六章 竞争态势
- 市场集中度
- 策略性倡议(併购、合作、资金筹措)
- 市占率分析
- 公司简介
- Agilent Technologies, Inc.
- Thermo Fisher Scientific Inc.
- Shimadzu Corporation
- Danaher Corporation(SCIEX, Leica Microsystems)
- Bruker Corporation
- Waters Corporation
- PerkinElmer Inc.
- Metrohm AG
- Mettler Toledo International Inc.
- Malvern Panalytical Ltd.(Spectris)
- Hitachi High-Tech Corporation
- HORIBA, Ltd.
- JEOL Ltd.
- Anton Paar GmbH
- Bio-Rad Laboratories, Inc.
- ZEISS Group
- Oxford Instruments plc
- Nikon Instruments Inc.
- Rigaku Corporation
- LECO Corporation
- Sartorius AG
- Merck KGaA(MilliporeSigma)
第七章 市场机会与未来展望
The analytical instrumentation market is valued at USD 55.29 billion in 2025 and is projected to reach USD 76.87 billion by 2030, reflecting a 6.81% CAGR and signaling robust expansion in high-precision measurement tools.
Increasing regulatory oversight in pharmaceuticals and environmental monitoring, rapid semiconductor node shrinkage below 3 nm, and the convergence of artificial intelligence with laboratory hardware are boosting adoption across every major end-user group. Vendors are intensifying investments in real-time release testing solutions for continuous pharmaceutical manufacturing, ultra-trace spectrometry platforms for PFAS control, and multi-omics mass spectrometry to support biologics pipelines. Simultaneously, helium supply volatility is reshaping gas chromatography workflows, while persistent talent shortages in analytical chemistry elevate outsourcing costs and nudge buyers toward automation. Together, these forces are sustaining pricing power and fueling incremental upgrades in the analytical instrumentation market.
Global Analytical Instrumentation Market Trends and Insights
Rising Adoption of Hyphenated Techniques for Biologics QA/QC
Growing demand for complex biologics is encouraging manufacturers to replace single-dimension methods with hyphenated liquid chromatography-mass spectrometry platforms. Nearly 78% of biopharmaceutical plants now deploy at least one hyphenated workflow in quality operations, up from 2023 levels, enabling multi-attribute monitoring of critical quality attributes and trimming batch rejection rates by 15%.Enhanced system integration allows real-time profiling of post-translational modifications, accelerating scale-up and release schedules. These gains are pushing capital budgets toward high-resolution LC-MS/MS and reinforcing supplier investments in automated data pipelines.
Stringent Global Limits on PFAS and Micro-plastics Boosting Ultra-Trace Spectrometry
Parts-per-trillion limits in the 2024 U.S. drinking-water rule and parallel European directives are forcing laboratories to add next-generation high-resolution mass spectrometers and Raman or FTIR microscopes capable of identifying particles down to 1 µm. Environmental labs increased capital outlays for such systems by 34% in 2024 alone, a trend likely to continue as ultrashort-chain PFAS detection becomes compulsory.Market leaders now bundle automated sample preparation that extends run-time intervals and lowers detection thresholds, thereby strengthening recurring consumables revenue.
High Total Cost of Ownership for High-Resolution MS
Pricing for flagship mass spectrometers ranges between USD 500,000 and USD 1.5 million, yet five-year operating expenses often exceed purchase price because of service contracts, infrastructure retrofits, and specialized consumables. Emerging-market labs face 30% to 45% higher TCO due to tariffs and limited local service capacity. These barriers delay adoption in water-quality and food-safety settings even as regulations tighten, prompting vendors to roll out streamlined "value-engineered" models and shared-service hubs.
Other drivers and restraints analyzed in the detailed report include:
- Shift Toward Real-Time Release Testing in Pharma Production
- Semiconductor Node Shrinkage Less than 3 nm Requiring Ultra-Sensitive Surface Analysis
- Shortage of Skilled Analytical Chemists Elevating Outsourcing Costs
For complete list of drivers and restraints, kindly check the Table Of Contents.
Segment Analysis
Chromatography systems generated USD 15.48 billion in revenue and commanded 28% of analytical instrumentation market share in 2024. AI-enabled calibration routines now boost throughput by up to 70% while predictive algorithms flag maintenance needs, supporting sustained upgrades in both HPLC and gas chromatograph. In environmental labs, the need to profile PFAS has revived demand for advanced column chemistries and tandem detectors. Mass spectrometry, meanwhile, represents the fastest-expanding product family, slated for 7.1% CAGR through 2030 as ion-mobility innovations such as parallel accumulation with mobility-aligned fragmentation quintuple sample throughput and push sensitivity ceilings .
The analytical instrumentation market size for mass spectrometers is benefiting from cross-industry uptake-clinical proteomics, food authenticity, and battery materials all require deeper molecular insight. Triple-quadrupole and Q-TOF configurations account for the bulk of new installations owing to their balance between speed and resolution. Supplier roadmaps center on ultrahigh-field Orbitrap and timsTOF architectures that couple hardware advances with cloud-based deconvolution platforms, trimming data-processing times and freeing scarce analyst hours. Molecular spectroscopy remains a core revenue pillar for routine QA/QC, though Raman is gaining ground in pharmaceutical continuous manufacturing, where in-line probes verify blend uniformity in real time.
High-performance and ultra-high-performance liquid chromatography systems commanded 56% of this category, valued at USD 8.67 billion, as their reproducibility and matrix tolerance make them indispensable for potency, impurity, and stability testing. Artificial-intelligence plug-ins now automate gradient design, mobile-phase selection, and fault prediction, boosting sample throughput by up to 70% while reducing column waste. Microfluidic chip columns are entering proteomic workflows, delivering sub-minute separations that synchronize with fast-scanning mass spectrometers and support data-rich multi-omics studies.
Supercritical-fluid chromatography is projected to advance at 7.3% CAGR through 2030, the quickest cadence within liquid-phase separations. Its use of CO2 and minimal co-solvent meets green-chemistry targets and lowers per-sample solvent cost, creating attractive payback in chiral drug screening and impurity isolation. Gas chromatography remains vital for volatile analyses, yet helium scarcity elevates operating expenses, accelerating migration to hydrogen carriers and micro-channel alternatives. Ion chromatography is back in focus as regulators tighten ionic-contaminant limits in drinking water and industrial effluent, prompting utilities to add automated inline suppressor systems that can handle 24/7 monitoring.
The Analytical Instrumentation Market Report is Segmented by Product Type (Chromatography Instruments, Molecular Spectroscopy, Elemental Spectroscopy, Mass Spectrometry, and More), End-User Industry (Pharmaceuticals and Biopharmaceuticals, Clinical and Diagnostics Laboratories, Environmental Testing Laboratories, Chemical and Petrochemical, and More), and Geography. The Market Forecasts are Provided in Terms of Value (USD).
Geography Analysis
North America generated USD 19.35 billion in 2024, equivalent to 35% of the analytical instrumentation market. Demand is anchored in FDA-driven real-time release testing, EPA-mandated parts-per-trillion PFAS limits, and a USD 52 billion CHIPS Act outlay that funds new fabs, each specifying sub-nanometer metrology. Laboratories adopt hydrogen-ready gas chromatographs and low-dead-volume HPLC pumps to mitigate helium costs and solvent waste, illustrating an appetite for greener workflows.
Asia-Pacific is forecast to deliver a 7.6% CAGR, reflecting pharmaceutical manufacturing scale-ups in China and India, plus advanced logic and memory production in Taiwan and South Korea. Regional governments tighten water-quality and industrial-emission standards, encouraging state-owned labs to tender multi-year procurement contracts for ICP-MS, LC-MS/MS, and handheld Raman. The analytical instrumentation market size allocated to semiconductor QA/QC in Asia-Pacific is projected to outgrow every other vertical as foundries race for gate-all-around transistors and high-bandwidth memory.
Europe maintains a robust, regulation-driven posture. The European Green Deal funds nationwide PFAS monitoring, circular-economy research, and solvent-free chromatography pilots. Pharmaceutical hubs in Germany, Ireland, and Switzerland integrate continuous-manufacturing lines that embed PAT analytics. Meanwhile, South America and the Middle East and Africa record steady but smaller gains as refineries, agro-exporters, and mining firms modernize labs to meet international trade certifications. High TCO remains a hurdle, so distributors increasingly promote lease-to-own and pay-per-sample schemes that lower entry barriers for first-time buyers.
- Agilent Technologies, Inc.
- Thermo Fisher Scientific Inc.
- Shimadzu Corporation
- Danaher Corporation (SCIEX, Leica Microsystems)
- Bruker Corporation
- Waters Corporation
- PerkinElmer Inc.
- Metrohm AG
- Mettler Toledo International Inc.
- Malvern Panalytical Ltd. (Spectris)
- Hitachi High-Tech Corporation
- HORIBA, Ltd.
- JEOL Ltd.
- Anton Paar GmbH
- Bio-Rad Laboratories, Inc.
- ZEISS Group
- Oxford Instruments plc
- Nikon Instruments Inc.
- Rigaku Corporation
- LECO Corporation
- Sartorius AG
- Merck KGaA (MilliporeSigma)
Additional Benefits:
- The market estimate (ME) sheet in Excel format
- 3 months of analyst support
TABLE OF CONTENTS
1 INTRODUCTION
- 1.1 Study Assumptions and Market Definition
- 1.2 Scope of the Study
2 RESEARCH METHODOLOGY
3 EXECUTIVE SUMMARY
4 MARKET LANDSCAPE
- 4.1 Market Overview
- 4.2 Market Drivers
- 4.2.1 Rising Adoption of Hyphenated Techniques for Biologics QA/QC
- 4.2.2 Stringent Global Limits on PFAS and Micro-plastics Boosting Ultra-Trace Spectrometry
- 4.2.3 Shift Toward Real-Time Release Testing (RTRT) in Pharma Production
- 4.2.4 Semiconductor Node Shrinkage < 3 nm Requiring Ultra-Sensitive Surface Analysis
- 4.2.5 Expansion of Renewable Aviation Fuel Programs Driving Feedstock Certification
- 4.2.6 In-Lab Analytics Surge for Battery Gigafactory Quality Assurance
- 4.3 Market Restraints
- 4.3.1 High Total Cost of Ownership of High-Resolution MS in Emerging Markets
- 4.3.2 Shortage of Skilled Analytical Chemists Elevating Outsourcing Costs
- 4.3.3 Helium Supply-Chain Volatility Impacting GC Operations
- 4.3.4 Lengthy Validation Cycles for Novel Analytical Methods in Regulated Sectors
- 4.4 Industry Ecosystem Analysis
- 4.5 Regulatory Outlook
- 4.6 Technological Outlook
- 4.7 Porter's Five Forces Analysis
- 4.7.1 Bargaining Power of Suppliers
- 4.7.2 Bargaining Power of Buyers
- 4.7.3 Threat of New Entrants
- 4.7.4 Threat of Substitutes
- 4.7.5 Degree of Competition
5 MARKET SIZE AND GROWTH FORECASTS (VALUES)
- 5.1 By Product Type
- 5.1.1 Chromatography Instruments
- 5.1.1.1 Gas Chromatography (GC) Systems
- 5.1.1.2 High-/Ultra-High-Performance Liquid Chromatography (HPLC/UHPLC)
- 5.1.1.3 Ion Chromatography (IC) Systems
- 5.1.1.4 Supercritical Fluid Chromatography (SFC) Systems
- 5.1.2 Molecular Spectroscopy
- 5.1.2.1 UV-Visible Spectrometers
- 5.1.2.2 Fourier Transform Infrared (FT-IR) Spectrometers
- 5.1.2.3 Near-Infrared (NIR) Spectrometers
- 5.1.2.4 Raman Spectrometers
- 5.1.2.5 Fluorescence Spectrometers
- 5.1.3 Elemental Spectroscopy
- 5.1.3.1 Atomic Absorption Spectrometers (AAS)
- 5.1.3.2 ICP-Optical Emission Spectrometers (ICP-OES)
- 5.1.3.3 ICP-Mass Spectrometers (ICP-MS)
- 5.1.3.4 X-Ray Fluorescence (XRF) Spectrometers
- 5.1.4 Mass Spectrometry
- 5.1.4.1 Single Quadrupole MS Systems
- 5.1.4.2 Triple Quadrupole MS Systems
- 5.1.4.3 Quadrupole-Time-of-Flight (Q-TOF) MS Systems
- 5.1.4.4 Orbitrap and FT-MS Systems
- 5.1.4.5 MALDI-TOF MS Systems
- 5.1.5 Analytical Microscopes and Imaging Systems
- 5.1.5.1 Scanning Electron Microscopes (SEM)
- 5.1.5.2 Transmission Electron Microscopes (TEM)
- 5.1.5.3 Atomic Force Microscopes (AFM)
- 5.1.5.4 Confocal and Optical Microscopes
- 5.1.6 Surface, Thermal and Particle Characterisation Instruments
- 5.1.6.1 X-Ray Diffraction (XRD) Systems
- 5.1.6.2 Thermal Analysis Instruments (DSC, TGA, etc.)
- 5.1.6.3 Particle Size and Zeta Potential Analysers
- 5.1.7 Consumables and Accessories
- 5.1.8 Data Management Software and Services
- 5.1.1 Chromatography Instruments
- 5.2 By End-User Industry
- 5.2.1 Pharmaceuticals and Biopharmaceuticals
- 5.2.1.1 Drug Discovery and Development
- 5.2.1.2 Manufacturing QA/QC
- 5.2.2 Clinical and Diagnostics Laboratories
- 5.2.3 Environmental Testing Laboratories
- 5.2.4 Food and Beverage Testing
- 5.2.5 Chemical and Petrochemical
- 5.2.6 Oil and Gas (Upstream, Midstream, Downstream)
- 5.2.7 Materials Science and Metallurgy
- 5.2.8 Semiconductor and Electronics
- 5.2.9 Academic and Government Research Institutes
- 5.2.10 Forensic and Security
- 5.2.11 Water and Wastewater Utilities
- 5.2.1 Pharmaceuticals and Biopharmaceuticals
- 5.3 By Geography
- 5.3.1 North America
- 5.3.1.1 United States
- 5.3.1.2 Canada
- 5.3.1.3 Mexico
- 5.3.2 Europe
- 5.3.2.1 Germany
- 5.3.2.2 United Kingdom
- 5.3.2.3 France
- 5.3.2.4 Italy
- 5.3.2.5 Spain
- 5.3.2.6 Nordics
- 5.3.2.7 Rest of Europe
- 5.3.3 Asia-Pacific
- 5.3.3.1 China
- 5.3.3.2 Japan
- 5.3.3.3 South Korea
- 5.3.3.4 India
- 5.3.3.5 South East Asia
- 5.3.3.6 Australia
- 5.3.3.7 Rest of Asia-Pacific
- 5.3.4 South America
- 5.3.4.1 Brazil
- 5.3.4.2 Rest of South America
- 5.3.5 Middle East and Africa
- 5.3.5.1 Middle East
- 5.3.5.1.1 United Arab Emirates
- 5.3.5.1.2 Saudi Arabia
- 5.3.5.1.3 Rest of Middle East
- 5.3.5.2 Africa
- 5.3.5.2.1 South Africa
- 5.3.5.2.2 Rest of Africa
- 5.3.1 North America
6 COMPETITIVE LANDSCAPE
- 6.1 Market Concentration
- 6.2 Strategic Moves (M&A, Partnerships, Funding)
- 6.3 Market Share Analysis
- 6.4 Company Profiles (includes Global level Overview, Market level overview, Core Segments, Financials as available, Strategic Information, Market Rank/Share for key companies, Products and Services, and Recent Developments)
- 6.4.1 Agilent Technologies, Inc.
- 6.4.2 Thermo Fisher Scientific Inc.
- 6.4.3 Shimadzu Corporation
- 6.4.4 Danaher Corporation (SCIEX, Leica Microsystems)
- 6.4.5 Bruker Corporation
- 6.4.6 Waters Corporation
- 6.4.7 PerkinElmer Inc.
- 6.4.8 Metrohm AG
- 6.4.9 Mettler Toledo International Inc.
- 6.4.10 Malvern Panalytical Ltd. (Spectris)
- 6.4.11 Hitachi High-Tech Corporation
- 6.4.12 HORIBA, Ltd.
- 6.4.13 JEOL Ltd.
- 6.4.14 Anton Paar GmbH
- 6.4.15 Bio-Rad Laboratories, Inc.
- 6.4.16 ZEISS Group
- 6.4.17 Oxford Instruments plc
- 6.4.18 Nikon Instruments Inc.
- 6.4.19 Rigaku Corporation
- 6.4.20 LECO Corporation
- 6.4.21 Sartorius AG
- 6.4.22 Merck KGaA (MilliporeSigma)
7 MARKET OPPORTUNITIES AND FUTURE OUTLOOK
- 7.1 White-Space and Unmet-Need Assessment
 分析仪器市场机会、成长驱动因素、产业趋势分析及预测(2026-2035年)
 分析仪器市场规模、份额和成长分析(按产品、技术、应用、最终用途和地区划分)-产业预测,2025-2032年
 分析仪器市场按技术、产品类型、最终用户、应用和部署方式划分-2025-2032年全球预测
 美国分析仪器市场:市场规模、份额和趋势分析(按产品、技术和应用划分),细分市场预测(2025-2033 年)催化剂筛检合成设备市场(按产品类型、催化剂类型、操作、应用和最终用户划分)—全球预测 2025-2030流程分析仪器市场(按仪器类型、分析类型、测量参数、最终用户和部署类型)—2025-2030 年全球预测食品检测和分析设备市场(按产品类型、食品类型、应用和最终用户划分)—2025-2030 年全球预测
 全球分析仪器市场
 2025年全球燃料特性分析仪市场报告分析仪器市场规模、份额和趋势分析报告:按产品、技术、应用、地区和细分市场预测,2025 年至 2033 年