


 |
市场调查报告书
商品编码
1842581
机器人废弃物分类系统:市场份额分析、行业趋势、统计数据和成长预测(2025-2030 年)Robotic Waste Sorting System - Market Share Analysis, Industry Trends & Statistics, Growth Forecasts (2025 - 2030) |
||||||
※ 本网页内容可能与最新版本有所差异。详细情况请与我们联繫。
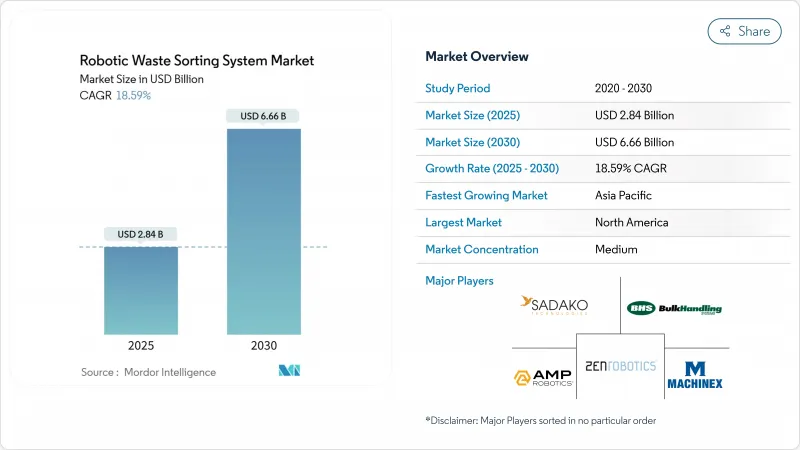
预计 2025 年机器人废弃物分类系统市场规模将达到 28.4 亿美元,到 2030 年将达到 66.6 亿美元,预测期内复合年增长率为 18.59%。
机器人废弃物分类系统市场的成长动力源自于日益严格的掩埋转移法规、生产者责任要求以及对人工智慧硬体的持续投资。自动化分类已成为应对材料回收设施(MRF)劳动力短缺和中国低品位进口限制的战略倡议,而这两项措施正在提升高纯度可回收物的价值。多感测器融合技术的快速发展使机器人能够识别超过500种废弃物类别,准确率高达99%,从而提高了回收率并降低了残余废弃物费。基于服务的租赁模式的普及缓解了资本限制,同时,由于互联互通的车队使设施面临工业控制威胁,网路安全支出也在增加。因此,在已开发经济体中,机器人废弃物分类系统市场正持续从先导计画转型为核心基础设施投资策略。
全球机器人废弃物分类系统市场趋势与洞察
掩埋转移和加强的EPR法规
生产者延伸责任 (EPR) 法规将成本从市政当局转移到品牌所有者,而欧盟 2024 年包装措施则加速了自动化的采用,该措施要求所有包装必须可回收,并在 2030 年和 2040 年达到一定的回收内容阈值。市政当局和生产商目前正在部署机器人,以确保更高的材料纯度并避免 EPR 处罚。经合组织指出,设计可回收产品的公司将获得不同程度的 EPR 奖励,这进一步刺激了对精确分类的需求。部署机器人系统的设施报告称,在试运行后的 12 个月内,回收率提高了 20 个百分点。随着新的区域授权复製欧盟模式,这种回报将加强机器人废弃物分类系统的市场。
中国等国禁止进口低品位废弃物
中国的国家利剑政策规定了0.5%的污染物限值,迫使西方塑胶回收厂升级设备以恢復出口收入。机器人提供了满足新品质标准所需的精度,将大批量工厂的投资回收期缩短至24个月以内。马来西亚、泰国和越南也实施了类似的禁令,进一步加剧了影响。因此,机器人废弃物分类系统市场正在重新定位,转向国内产能投资,例如北美营运商自2018年以来就在混合塑胶生产线上添加人工智慧分类机,以弥补商品利润的损失。
资本投入高,投资报酬率不确定性
一条完整的机器人生产线成本在200万至500万美元之间,相当于10万吨MRF 8至12个月的收益。大宗商品价格波动延长了投资回收期,减缓了新兴市场的投资。租赁和机器人即服务 (RaaS) 透过将支出从资本支出转向营运支出,缓解了这项限制因素,但在新兴经济体以外的地区,以美元计价的租赁管道仍然有限。因此,不同地区由于资本管道条件不同,机器人废弃物分类系统产业发展不均衡。
細項分析
到2024年,市政垃圾处理厂(MRF)将占据机器人废弃物分类系统市场的38.5%。由于这些工厂的目标是将污染阈值控制在1%以下,管理人员正在残渣线上部署人工智慧机器人,以提高纯度并减少掩埋附加税。预计到2030年,市政MRF机器人废弃物分类系统的市场规模将以15%的复合年增长率稳步增长,这得益于美国州级资助项目和加拿大省级补贴。
塑胶再加工商虽然绝对规模较小,但以21.4%的复合年增长率加速成长。这个细分市场抓住了追求闭合迴路策略的消费品品牌的需求。机器人专门从事聚合物分离,提取按颜色分类的PET和HDPE。因此,预计到2030年,塑胶再加工商将占据机器人废弃物分类系统市场份额的22%,缩小与市政MRF的差距。
塑胶将继续成为应用速度最快的产业,到2024年将占销售额的39%。人工智慧系统目前能够以接近实验室层级的精度识别多层薄膜和彩色PET。从价值链的角度来看,塑胶包装的污染物每减少1%,转售价格就会上涨25美元/吨,进而支持投资。纸张和纸板是稳定的类别,因为光学扫描器可以根据油墨和残留物进行调整。金属具有强大的涡流捕获能力,而机器人则透过分离高级铝合金来增加价值。玻璃分选正受益于人工智慧颜色检测模型,该模型正在将斯堪地那维亚工厂的回收率从70%提高到85%。
预计到2030年,光是塑胶废弃物分类机器人系统市场规模就将超过26亿美元,占全球整体的39%。机器人对复杂树脂进行分类的能力将推动该领域持续保持两位数的成长。
机器人废弃物分类系统市场按终端设施(市政垃圾回收站、工业/商业回收厂等)、分类废弃物类型(塑胶、纸张/纸板等)、组件(硬体、软体、服务)、分类技术(仅人工智慧视觉、近红外线/高光谱遥测光学等)和地区细分。市场预测以美元计算。
区域分析
到2024年,北美将占全球销售额的33%。早期采用机器人技术的公司将在加州、奥勒冈州和科罗拉多扩大机器人队伍规模,以弥补劳动力短缺并满足回收要求。光是废弃物管理公司就将在2024年至2025年初期间投资14亿美元用于人工智慧设施。由于该地区拥有超过400台AMP Robotics机器人,预计到2030年,美国机器人废弃物分类系统市场规模将超过20亿美元。
亚太地区是成长最快的地区,复合年增长率高达18.7%。中国国内政策从进口国向回收国的转变,带动了产能扩张,包括上海的ZenRobotics建筑废弃物线。一家日本市政工厂引进了一台人工智慧玻璃分类机,以提高琥珀和燧石玻璃屑的回收率,支持日本实现「瓶到瓶」的目标。韩国的ATron机器人的准确率高达99.3%,预示在东协地区具有出口潜力。因此,亚太地区在机器人废弃物分类系统市场的份额预计将从2025年的27%上升到2030年的33%。
欧洲受益于成熟的EPR法规,这些法规为资本投资提供了资金。丹麦一家自主建筑废弃物厂实现了98%的再生骨材纯度,树立了循环经济的新标竿。 Urbaser在西班牙推出的首个人工智慧分类倡议,标誌着伊比利亚半岛的人工智慧应用日益普及。虽然该地区的成长率比亚太地区更稳定,但该地区仍然是技术的试验田,先导计画和专利高度集中,为机器人废弃物分类系统市场树立了全球标准。
其他福利:
- Excel 格式的市场预测 (ME) 表
- 3个月的分析师支持
目录
第一章 引言
- 研究假设和市场定义
- 调查范围
第二章调查方法
第三章执行摘要
第四章 市场状况
- 市场概况
- 市场驱动因素
- 掩埋转移和加强的EPR法规
- 中国等国禁止进口低品位废弃物
- 劳动力短缺和MRF营运成本上升
- 再生材料包装要求激增
- 人工智慧闭合迴路数据的需求
- 基于OEM服务的机器人租赁模式
- 市场限制
- 资本投入高,投资报酬率不确定性
- OandM的技术人才有限
- 二级商品价格波动
- 工业物联网机器人暴露网路安全问题
- 价值/供应链分析
- 监管状况
- 技术展望
- 波特五力分析
- 新进入者的威胁
- 买方的议价能力
- 供应商的议价能力
- 替代品的威胁
- 竞争对手之间的竞争强度
第五章市场规模及成长预测
- 按最终用途设施
- 市政 MRF
- 工业和商业回收工厂
- 建筑和拆除设施
- 塑胶再处理器
- 电子垃圾回收商
- 按类型分类废弃物
- 塑胶
- 纸和纸板
- 金属
- 玻璃
- 有机垃圾和厨余垃圾
- 混合废弃物
- 按组件
- 硬体
- 软体
- 服务(安装、维运、租赁)
- 依排序技术
- 人工智慧视觉
- 近红外线/高光谱遥测光学
- 3D雷射和X射线
- 混合多感测器
- 按地区
- 北美洲
- 美国
- 加拿大
- 墨西哥
- 南美洲
- 巴西
- 阿根廷
- 智利
- 其他南美
- 欧洲
- 德国
- 英国
- 法国
- 义大利
- 西班牙
- 俄罗斯
- 其他欧洲国家
- APAC
- 中国
- 印度
- 日本
- 韩国
- 澳洲和纽西兰
- ASEAN-6
- 亚太地区其他国家
- 中东和非洲
- 中东
- 海湾合作委员会(沙乌地阿拉伯、阿联酋、卡达)
- 土耳其
- 其他中东地区
- 非洲
- 南非
- 埃及
- 奈及利亚
- 其他非洲国家
- 北美洲
第六章 竞争态势
- 市场集中度
- 策略倡议
- 市占率分析
- 公司简介
- AMP Robotics Corporation
- ZenRobotics Ltd
- TOMRA Systems ASA
- Bulk Handling Systems(BHS)
- Machinex Industries Inc
- Waste Robotics Inc
- Sadako Technologies
- General Kinematics
- Pellenc ST
- Green Machine LLC
- STADLER Anlagenbau
- Bollegraaf Group
- Everest Labs
- Glacier AI
- Greyparrot
- JONO Environmental
- FANUC Corp.
- ABB Ltd.
- KUKA AG
- SUEZ Group(AI sorting JV)
- Veolia Environnement(robotic pilots)
第七章 市场机会与未来展望
The robotic waste sorting system market size stood at USD 2.84 billion in 2025 and is projected to reach USD 6.66 billion by 2030, reflecting an 18.59% CAGR during the forecast period.
Growth momentum in the robotic waste sorting system market is driven by tightening landfill-diversion rules, producer responsibility mandates, and sustained investment in artificial-intelligence hardware. Automated sorting has become a strategic response to labor scarcity at Material Recovery Facilities (MRFs) and to China's restrictions on low-grade imports, both of which have raised the value of high-purity recyclables. Rapid improvements in multi-sensor fusion now allow robots to recognize more than 500 waste categories with 99% accuracy, lifting recovery rates and lowering residual disposal fees. Service-based leasing is gaining traction, easing capital constraints, while cybersecurity spending is rising as interconnected fleets expose facilities to industrial control threats. As a result, the robotic waste sorting system market continues to shift from pilot projects to core infrastructure investment strategies across advanced economies.
Global Robotic Waste Sorting System Market Trends and Insights
Stricter Landfill Diversion and EPR Regulations
Extended Producer Responsibility rules shift cost burdens from municipalities to brand owners, and the EU's 2024 packaging measure requires all packaging to be recyclable and to hit specific recycled-content thresholds by 2030 and 2040, accelerating automation adoption. Municipalities and producers now deploy robots to secure higher material purity and avoid EPR penalties. The OECD notes that variable EPR fees reward companies that design recyclable products, which further sharpens demand for precision sortation. Facilities deploying robotic systems report recovery-rate jumps of 20 percentage points within 12 months of commissioning. These returns strengthen the robotic waste sorting system market as new regional mandates replicate the EU model.
Ban on Low-Grade Waste Imports by China and Others
China's National Sword policy requires sub-0.5% contamination, forcing Western MRFs to upgrade equipment to regain export revenue. Robots provide the accuracy needed to meet the new quality bar, and payback periods have fallen to under 24 months in high-volume plants. Similar bans in Malaysia, Thailand, and Vietnam magnify the driver. Consequently, the robotic waste sorting system market has realigned toward domestic capacity investment, with North American operators adding AI sorters at mixed-plastic lines to recapture commodity margins lost after 2018.
High Capex and Payback Uncertainty
Complete robotic lines cost USD 2-5 million, equal to 8-12 months of revenue for a 100,000-tonne MRF. Commodity-price swings elongate payback, delaying investment in emerging markets. Leasing and Robotics-as-a-Service (RaaS) are mitigating this restraint by shifting spending from capex to opex, yet access to dollar-denominated leases remains limited outside developed economies. The robotic waste sorting system industry therefore advances unevenly across regions with different capital-access profiles.
Other drivers and restraints analyzed in the detailed report include:
- Labor Shortages and Rising MRF Operating Costs
- Surge in Recycled-Content Packaging Mandates
- Cyber-Security Exposure of IIoT Robots
For complete list of drivers and restraints, kindly check the Table Of Contents.
Segment Analysis
Municipal MRFs managed 38.5% of the robotic waste sorting system market in 2024, reflecting the largest installed base and the highest mix-waste volumes. As these plants target contamination thresholds below 1%, managers install AI robots on residual lines to boost purity and reduce landfill levies. The robotic waste sorting system market size for Municipal MRFs is projected to grow at a steady 15% CAGR through 2030, supported by state-level funding programs in the United States and provincial grants in Canada.
Plastic Re-processors, while smaller in absolute terms, are accelerating at 21.4% CAGR. The segment captures demand from consumer-packaged-goods brands pursuing closed-loop strategies. Robots specialize in polymer separation, extracting color-sorted PET and HDPE that command price premiums of up to 30% over mixed-bale equivalents. As a result, Plastic Re-processors are expected to hold a 22% robotic waste sorting system market share by 2030, narrowing the gap with Municipal MRFs.
Plastics accounted for 39% of revenue in 2024 and continue to exhibit the fastest uptake. AI systems now identify multilayer films and colored PET with near-laboratory precision. In value-chain terms, each percentage-point reduction in plastic bale contamination lifts resale prices by USD 25 per tonne, supporting investment cases. Paper and cardboard remain a stable category as optical scanners adjust for ink and residue. Metals enjoy robust capture using eddy currents, yet robots add value by isolating high-grade aluminum alloys. Glass sorting gains from AI color-detection models that lift recovery from 70% to 85% in Scandinavian plants.
The robotic waste sorting system market size for plastics alone is projected to exceed USD 2.6 billion by 2030, equal to 39% of global value. Robots' ability to sort complex resins positions the segment for sustained double-digit expansion.
Robotic Waste Sorting System Market is Segmented by End-Use Facility (Municipal MRFs, Industrial and Commercial Recycling Plants, and More), Waste Type Sorted (Plastics, Paper and Cardboard, and More), Component (Hardware, Software, Services), Sorting Technology (AI Vision-Only, NIR / Hyperspectral Optical, and More), Geography. The Market Forecasts are Provided in Terms of Value (USD).
Geography Analysis
North America accounted for 33% of global revenue in 2024, with early robot adopters scaling fleets to offset labor churn and to hit recycling-rate mandates in California, Oregon, and Colorado. Waste Management alone invested USD 1.4 billion in AI-enabled facilities between 2024 and early 2025. The region hosts over 400 AMP Robotics units, and robotic waste sorting system market size in the United States is projected to exceed USD 2 billion by 2030.
Asia-Pacific is the fastest-growing region at 18.7% CAGR. China's domestic policy pivot from importer to recycler triggered a surge in capacity adds, including ZenRobotics construction-waste lines in Shanghai. Japan's municipal plants deploy AI glass sorters that lift recovery rates for amber and flint cullet, supporting the country's bottle-to-bottle targets. South Korea's ATron robots demonstrate 99.3% precision and showcase export potential across ASEAN. Consequently, Asia-Pacific's share of the robotic waste sorting system market is forecast to rise from 27% in 2025 to 33% in 2030.
Europe benefits from mature EPR regulations that fund capital investment. Denmark's autonomous construction-waste plant achieves 98% purity for recycled aggregates, setting new circular-economy benchmarks. Spain's first AI sorting initiative under Urbaser signals wider Iberian adoption. Although growth is steadier than in Asia-Pacific, the region remains a technology test bed, sustaining a high concentration of pilot projects and patents that inform global standards for the robotic waste sorting system market.
- AMP Robotics Corporation
- ZenRobotics Ltd
- TOMRA Systems ASA
- Bulk Handling Systems (BHS)
- Machinex Industries Inc
- Waste Robotics Inc
- Sadako Technologies
- General Kinematics
- Pellenc ST
- Green Machine LLC
- STADLER Anlagenbau
- Bollegraaf Group
- Everest Labs
- Glacier AI
- Greyparrot
- JONO Environmental
- FANUC Corp.
- ABB Ltd.
- KUKA AG
- SUEZ Group (AI sorting JV)
- Veolia Environnement (robotic pilots)
Additional Benefits:
- The market estimate (ME) sheet in Excel format
- 3 months of analyst support
TABLE OF CONTENTS
1 INTRODUCTION
- 1.1 Study Assumptions and Market Definition
- 1.2 Scope of the Study
2 RESEARCH METHODOLOGY
3 EXECUTIVE SUMMARY
4 MARKET LANDSCAPE
- 4.1 Market Overview
- 4.2 Market Drivers
- 4.2.1 Stricter landfill diversion and EPR regulations
- 4.2.2 Ban on low-grade waste imports by China and others
- 4.2.3 Labour shortages and rising MRF operating costs
- 4.2.4 Surge in recycled-content packaging mandates
- 4.2.5 Demand for AI-enabled closed-loop data (under-reported)
- 4.2.6 OEM service-based robot leasing models (under-reported)
- 4.3 Market Restraints
- 4.3.1 High capex and payback uncertainty
- 4.3.2 Limited technical talent for OandM
- 4.3.3 Volatile secondary-commodity prices
- 4.3.4 Cyber-security exposure of IIoT robots (under-reported)
- 4.4 Value / Supply-Chain Analysis
- 4.5 Regulatory Landscape
- 4.6 Technological Outlook
- 4.7 Porter's Five Forces Analysis
- 4.7.1 Threat of New Entrants
- 4.7.2 Bargaining Power of Buyers
- 4.7.3 Bargaining Power of Suppliers
- 4.7.4 Threat of Substitutes
- 4.7.5 Intensity of Competitive Rivalry
5 MARKET SIZE AND GROWTH FORECASTS (VALUE)
- 5.1 By End-use Facility
- 5.1.1 Municipal MRFs
- 5.1.2 Industrial and Commercial Recycling Plants
- 5.1.3 Construction and Demolition Facilities
- 5.1.4 Plastic Re-processors
- 5.1.5 E-waste Recyclers
- 5.2 By Waste Type Sorted
- 5.2.1 Plastics
- 5.2.2 Paper and Cardboard
- 5.2.3 Metals
- 5.2.4 Glass
- 5.2.5 Organic and Food Waste
- 5.2.6 Mixed CandD Debris
- 5.3 By Component
- 5.3.1 Hardware
- 5.3.2 Software
- 5.3.3 Services (Installation, OandM, Leasing)
- 5.4 By Sorting Technology
- 5.4.1 AI Vision-only
- 5.4.2 NIR / Hyperspectral Optical
- 5.4.3 3-D Laser and X-ray
- 5.4.4 Hybrid Multi-Sensor
- 5.5 By Geography
- 5.5.1 North America
- 5.5.1.1 United States
- 5.5.1.2 Canada
- 5.5.1.3 Mexico
- 5.5.2 South America
- 5.5.2.1 Brazil
- 5.5.2.2 Argentina
- 5.5.2.3 Chile
- 5.5.2.4 Rest of South America
- 5.5.3 Europe
- 5.5.3.1 Germany
- 5.5.3.2 United Kingdom
- 5.5.3.3 France
- 5.5.3.4 Italy
- 5.5.3.5 Spain
- 5.5.3.6 Russia
- 5.5.3.7 Rest of Europe
- 5.5.4 APAC
- 5.5.4.1 China
- 5.5.4.2 India
- 5.5.4.3 Japan
- 5.5.4.4 South Korea
- 5.5.4.5 Australia and New Zealand
- 5.5.4.6 ASEAN-6
- 5.5.4.7 Rest of APAC
- 5.5.5 Middle East and Africa
- 5.5.5.1 Middle East
- 5.5.5.1.1 GCC (Saudi Arabia, UAE, Qatar)
- 5.5.5.1.2 Turkey
- 5.5.5.1.3 Rest of Middle East
- 5.5.5.2 Africa
- 5.5.5.2.1 South Africa
- 5.5.5.2.2 Egypt
- 5.5.5.2.3 Nigeria
- 5.5.5.2.4 Rest of Africa
- 5.5.1 North America
6 COMPETITIVE LANDSCAPE
- 6.1 Market Concentration
- 6.2 Strategic Moves
- 6.3 Market Share Analysis
- 6.4 Company Profiles (includes Global level Overview, Market level overview, Core Segments, Financials as available, Strategic Information, Market Rank/Share for key companies, Products and Services, and Recent Developments)
- 6.4.1 AMP Robotics Corporation
- 6.4.2 ZenRobotics Ltd
- 6.4.3 TOMRA Systems ASA
- 6.4.4 Bulk Handling Systems (BHS)
- 6.4.5 Machinex Industries Inc
- 6.4.6 Waste Robotics Inc
- 6.4.7 Sadako Technologies
- 6.4.8 General Kinematics
- 6.4.9 Pellenc ST
- 6.4.10 Green Machine LLC
- 6.4.11 STADLER Anlagenbau
- 6.4.12 Bollegraaf Group
- 6.4.13 Everest Labs
- 6.4.14 Glacier AI
- 6.4.15 Greyparrot
- 6.4.16 JONO Environmental
- 6.4.17 FANUC Corp.
- 6.4.18 ABB Ltd.
- 6.4.19 KUKA AG
- 6.4.20 SUEZ Group (AI sorting JV)
- 6.4.21 Veolia Environnement (robotic pilots)
7 MARKET OPPORTUNITIES AND FUTURE OUTLOOK
- 7.1 White-space and Unmet-Need Assessment
 机器人垃圾分类市场,按产品、按分类材料、按应用、按最终用户、按国家和地区 - 2025 年至 2032 年全球行业分析、市场规模、市场份额和预测
 废弃物分类机器人市场规模、份额、成长分析、按废弃物类型、按机器人类型、按应用、按最终用途、按地区 - 行业预测,2024-2031 年
 全球废弃物分类机器人市场,2024-2028
 机器人垃圾分类市场(提供:硬体、软体和解决方案;以及分类材料:塑胶垃圾、纸张垃圾、金属垃圾、食物垃圾和电子垃圾)-全球产业分析、规模、份额、成长、趋势和预测, 2024- 2034
 到 2030 年机器人废弃物分类系统的全球市场预测:按类型、废弃物分类类型、回收设施中安装的机器人、应用和区域进行全球分析到 2030 年废弃物分类机器人的市场预测:按类型、废弃物分类类型、应用和区域进行全球分析