


 |
市场调查报告书
商品编码
1842631
水肥一体化和化学灌溉:市场份额分析、行业趋势、统计数据和成长预测(2025-2030 年)Fertigation And Chemigation - Market Share Analysis, Industry Trends & Statistics, Growth Forecasts (2025 - 2030) |
||||||
※ 本网页内容可能与最新版本有所差异。详细情况请与我们联繫。
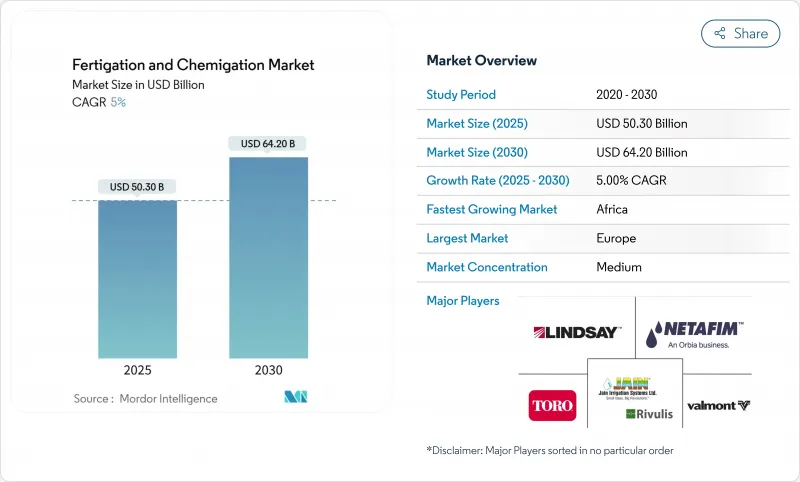
预计到 2025 年,水肥一体化和化学灌溉市场规模将达到 503 亿美元,到 2030 年将以 5.0% 的复合年增长率增长至 642 亿美元。
推动这一成长的因素包括日益增长的水资源短缺问题、日益攀升的肥料成本(凸显了对效率的追求)以及物联网和人工智慧技术在营养输送系统中的整合。这些因素正在改变农场管理实践,减少营运浪费,并提高对气候变迁的适应能力。企业正在投资研发水溶性配方、云端基础控制系统以及即时监测水分、盐分和养分水平的感测器技术。已开发国家和开发中国家的政府都在扩大微灌溉补贴,鼓励设备升级,并支持国内创新。投入品製造商正在整合软体解决方案、农艺服务和维护支持,以提高客户保留率和价值。
全球水肥一体化和化学灌溉市场趋势和洞察
对粮食安全和产量最大化的需求不断增加
全球卡路里需求的成长速度快于可耕地供应的成长速度,这要求农民最大限度地提高单位水、养分和劳动力的产量。灌溉施肥技术透过将氮、磷、钾与植物发育阶段同步,将养分直接输送到植物根部,已被证明可使高价值作物的产量提高15-35%。据报导,商业果园和蔬菜农场的肥料利用率提高了高达30%,在投入品价格波动期间降低了成本,并减少了养分流失。灌溉施肥技术与气候智慧型农业结合,可以用数据主导的持续施肥方案取代定期的一次性施肥。
政府补贴和微灌溉奖励
政府政策透过津贴、税额扣抵和补贴贷款等方式支持农业技术的应用。美国农业部(USDA)25财政年度预算为自然资源保护局(NRCS)拨款105亿美元,该局专注于精准水资源管理系统。印度和中国也推出了类似的项目,为低压滴灌设备提供高达55%的补贴,鼓励中小型农户采用该设备。这些倡议正在推动农艺咨询、感测器製造和基于软体的灌溉管理等支援服务的发展。
资本和营运维护成本高
先进的滴灌系统需要大量的基础设施,包括压力调节主管道、双重过滤、防回流和可程式控制器。这些要求使得初始成本超出了许多小农户的承受能力。经济分析表明,对于经济作物,变流量灌溉系统的投资回收期超过27年,而固定流量枢轴灌溉系统的投资回收期仅为10年。在农场规模较小、信贷管道有限的低收入地区,财务挑战尤其严峻。此外,持续的维护成本(例如係统清洁、酸处理和感测器校准)也带来了额外的经济压力,阻碍了系统升级和新采购。
細項分析
肥料将主导灌溉施肥和化学灌溉市场,到2024年将占46.0%的收入份额。这种主导地位主要归功于水溶性NPK配方,这些配方溶解迅速,沉淀极少。领先的製造商正在开发螯合微量营养素混合物,以解决密集园艺实践中的营养缺乏问题。
生物刺激素和微量营养素正成为关键驱动因素,预计2025年至2030年的复合年增长率将达到10.2%。这一增长主要源自于农民在变幻莫测的天气条件下寻求可靠的产量。研究表明,与传统施肥相比,植物来源和微生物菌群可提高30%的养分利用效率,这促使大型生菜和浆果种植者在其整个种植过程中实施这些解决方案。专为低压滴灌系统设计的新型液体接种剂可促进土壤与微生物的相互作用,且不会堵塞发送器。
由于灌溉施肥系统能够在整个浓密的作物座舱罩均匀施药,杀虫剂和杀菌剂保持了适度的增长速度,从而减少了化学品的总体使用量,同时保持了有效的病虫害防治水平。除草剂产业虽然由于使用限製而规模较小,但在控制Glyphosate抗性杂草族群方面表现出适度的成长。
到2024年,水果和蔬菜将保持最大的市场份额,达到38.0%,这得益于灌溉系统能够有效满足作物对养分定时施用的高需求。滴灌系统已证明可使作物、草莓和叶菜类的产量提高15-35%,尤其是在土地成本高、生产力需求高的郊区。谷物和谷类生产商正在从试点项目转向商业性化应用,玉米和小麦种植者已在轮作计划中采用低压系统。该技术也越来越多地应用于作物和豆类作物,在这些作物中,分次施氮可以减少因挥发造成的养分损失,尤其是在缺水地区。
茶叶、咖啡、可可、椰子和橡胶等种植作物表现出独特的施肥模式。儘管目前市场份额较小,但预计2025年至2030年期间种植作物的灌溉和化学灌溉市场将以8.0%的复合年增长率成长。这些作物生产週期长,根系多年生,因此低剂量、高频率的施肥方式对其大有裨益。种植者报告称,在降雨量大的地区,滴灌技术可以减少养分流失,从而改善叶片发育,并提高豆类品质的一致性。种植作物的寿命延长,有助于在多年内累积收益,并提高整体投资收益,从而支持初始资本投资。
区域分析
到 2024 年,欧洲将占灌溉施肥和化学灌溉市场收入的 34.0%。橄榄树、葡萄园和温室蔬菜种植者正在采用基于感测器的灌溉系统,以满足欧盟硝酸盐指令的要求,同时提高产量稳定性和产品品质。通用农业政策提供政府补贴和低利率贷款,以支持采用结合土壤湿度感测器、自动过滤和数位监控平台的先进系统,儘管人事费用增加,但仍缩短了投资回收期。荷兰、西班牙和义大利的大型温室设施正在刺激技术应用,因为受控环境可最大限度地提高精确营养施用和 pH 值管理的有效性。市场成长由成熟的服务网络支持,农业投入品供应商与技术公司合作,提供从设计到维护的完整解决方案包,目标客户是需要遵守法规而又不增加技术人员的中型农业合作社。
北美占据第二大市场以金额为准,这得益于广泛的数位技术和成熟的技术支援网路。该地区的收益预计将从2023年的2.6382亿美元增长到2030年的4.3374亿美元,主要得益于中西部农民对化肥价格波动的积极响应。调查结果显示,78.6%的玉米和大豆种植者重视化肥效率,导致其变数灌溉系统的应用日益广泛。联邦水土保持资金和严格的径流管理也增强了其应用的可行性。
非洲显示出最高的成长潜力,2025年至2030年的复合年增长率为9.4%。非洲肥料与土壤健康高峰会和区域智慧灌溉倡议强调了灌溉的节水和养分效益。在南非的Vhembe地区,24%的农场采用气候智慧灌溉,而Capricorn地区的比例为68%。基于简讯和低频宽的数位推广服务正在帮助弥合知识差距。肯亚和坦尚尼亚的精准施肥计画显示了该地区对用于养分管理指导的行动应用程式的兴趣。
其他福利:
- Excel 格式的市场预测 (ME) 表
- 3个月的分析师支持
目录
第一章 引言
- 研究假设和市场定义
- 调查范围
第二章调查方法
第三章执行摘要
第四章 市场状况
- 市场概况
- 市场驱动因素
- 对粮食安全和产量最大化的需求不断增加
- 政府补贴和微灌溉奖励
- 水资源短缺加剧推动营养供应效率
- 水溶性专用肥料快速推广
- 物联网变量灌溉系统
- 劳动和成本效率
- 市场限制
- 资本和营运维护成本高
- 农民缺乏技术知识
- 沉积物或生物膜导致发送器堵塞
- 加强对营养物质淋失的监管
- 监管状况
- 技术展望
- 波特五力分析
- 新进入者的威胁
- 买方的议价能力
- 供应商的议价能力
- 替代品的威胁
- 竞争对手之间的竞争强度
第五章市场规模及成长预测
- 按输入类型
- 肥料
- 杀虫剂
- 消毒剂
- 除草剂
- 生物刺激素和微量营养素
- 其他输入类型
- 按作物类型
- 粮食
- 油籽和豆类
- 水果和蔬菜
- 种植作物
- 草坪和观赏作物
- 其他作物
- 按用途
- 露天耕作
- 温室和水耕
- 苗圃和园林绿化
- 城市垂直农业
- 其他用途
- 按灌溉类型
- 滴灌
- 喷水灌溉
- 其他灌溉类型
- 按地区
- 北美洲
- 美国
- 加拿大
- 墨西哥
- 北美其他地区
- 欧洲
- 德国
- 英国
- 法国
- 义大利
- 西班牙
- 俄罗斯
- 其他欧洲国家
- 亚太地区
- 中国
- 印度
- 日本
- 澳洲
- 韩国
- 其他亚太地区
- 南美洲
- 巴西
- 阿根廷
- 其他南美
- 中东和非洲
- 土耳其
- 沙乌地阿拉伯
- 阿拉伯聯合大公国
- 南非
- 埃及
- 肯亚
- 其他中东和非洲地区
- 北美洲
第六章 竞争态势
- 市场集中度
- 策略倡议
- 市占率分析
- 公司简介
- Netafim Limited(An Orbia Business)
- Jain Irrigation Systems Limited(Rivulis Irrigation Ltd.)
- Lindsay Corporation
- Valmont Industries, Inc.
- The Toro Company
- Rain Bird Corporation
- Automat Industries Private Limited
- Mahindra EPC Irrigation Limited
- Hunter Industries Inc.
- Irritec SpA
第七章 市场机会与未来展望
The fertigation and chemigation market reached USD 50.3 billion in 2025 and is projected to grow at a CAGR of 5.0%, reaching USD 64.2 billion by 2030.
This growth is driven by increasing water scarcity concerns, rising fertilizer costs emphasizing efficiency needs, and the integration of IoT and AI technologies in nutrient delivery systems. These factors are transforming farm management practices, reducing operational waste, and improving adaptability to climate change. Companies are investing in research and development of water-soluble formulations, cloud-based control systems, and sensor technologies that monitor moisture, salinity, and nutrient levels in real-time. Governments across developed and developing nations are expanding micro-irrigation subsidies, facilitating equipment upgrades, and supporting domestic innovation. Input manufacturers are integrating software solutions, agronomic services, and maintenance support to enhance customer retention and value.
Global Fertigation And Chemigation Market Trends and Insights
Rising Demand for Food Security and Yield Maximization
The global demand for calories is increasing faster than the availability of arable land, requiring farmers to maximize output per unit of water, nutrients, and labor. Fertigation, which delivers nutrients directly to plant root zones, increases crop yields by 15-35% in high-value crops by synchronizing nitrogen, phosphorus, and potassium delivery with plant developmental stages. Commercial orchards and vegetable farms report up to 30% improvement in fertilizer use efficiency, reducing costs during periods of volatile input prices while decreasing nutrient run-off. Fertigation, when integrated with climate-smart farming practices, enables farms to implement data-driven, continuous nutrition programs instead of periodic bulk fertilizer applications.
Government Subsidies and Micro-Irrigation Incentives
Government policies support agricultural technology adoption through grants, tax credits, and subsidized loans. The USDA's 2025 budget allocates USD 10.5 billion to the Natural Resources Conservation Service, focusing on precision water management systems.Similar programs in India and China provide reimbursements of up to 55% for low-pressure drip irrigation equipment, encouraging adoption among small and medium-scale farmers. These initiatives have fostered the development of supporting services, including agronomic consulting, sensor production, and software-based irrigation management.
High Capital and O&M Costs
Drip fertigation systems with advanced features require significant infrastructure, including pressure-regulated mainlines, dual filtration, backflow prevention, and programmable controllers. These requirements increase initial costs beyond what many smallholder farmers can afford. Economic analyses indicate that variable-rate fertigation systems have payback periods of over 27 years for commodity crops, while fixed-rate pivot systems achieve payback in 10 years. The financial barriers are particularly challenging in low-income regions with small farm sizes and limited credit access. The ongoing maintenance costs, including system flushing, acid treatment, and sensor calibration, create additional financial pressure, which reduces system upgrades and new purchases.
Other drivers and restraints analyzed in the detailed report include:
- Rapid Adoption of Water-Soluble Specialty Fertilizers
- Growing Water Scarcity Heightens Efficient Nutrient Delivery
- Less Technical Knowledge Among Farmers
For complete list of drivers and restraints, kindly check the Table Of Contents.
Segment Analysis
The fertigation and chemigation market is dominated by fertilizers, which accounted for 46.0% of revenue share in 2024. This dominance is primarily due to water-soluble NPK formulations that offer rapid dissolution and minimal line precipitation. Major manufacturers are developing chelated micronutrient blends to address nutrient deficiencies in intensive horticultural operations.
Biostimulants and micronutrients are emerging as significant growth drivers, with projections indicating a 10.2% CAGR from 2025-2030. This growth is driven by farmers seeking consistent yields during unpredictable weather conditions. Research indicates that plant-based extracts and microbial consortia improve nutrient-use efficiency by 30% compared to conventional fertilizer applications, leading major lettuce and berry producers to implement these solutions across their operations. New liquid inoculants designed for low-pressure drip systems enhance soil-microbe interactions without emitter blockage.
Insecticides and fungicides maintain moderate growth rates, as fertigation systems enable uniform distribution throughout dense crop canopies, reducing overall chemical usage while maintaining effective pest control levels. The herbicide segment, though smaller due to application limitations, shows gradual growth in managing glyphosate-resistant weed populations.
Fruits and vegetables maintain the largest market share at 38.0% in 2024, driven by their high nutrient timing requirements that fertigation effectively addresses. Drip line fertigation systems demonstrate yield increases of 15-35% in vine crops, strawberries, and leafy greens, particularly in peri-urban areas where high land costs necessitate increased productivity. Cereal and grain producers are transitioning from pilot programs to commercial implementation, with maize and wheat farmers adopting low-pressure systems within crop rotation schedules. The technology also shows increasing adoption in oil crops and pulses, especially in water-scarce regions where split nitrogen applications reduce nutrient loss through volatilization.
Plantation crops, including tea, coffee, cocoa, coconut, and rubber, exhibit unique fertigation adoption patterns. While currently holding a smaller market share, the fertigation and chemigation market for plantation crops is projected to grow at an 8.0% CAGR from 2025-2030. These crops benefit significantly from low-volume, high-frequency nutrient delivery due to their long production cycles and perennial root systems, particularly during extended dry periods. Growers report improved leaf development and bean quality uniformity after implementing drip fertigation, which reduces nutrient leaching in high-rainfall areas. The extended lifespan of plantation crops supports the initial capital investment, as the revenue benefits accumulate over multiple years, improving the overall return on investment.
The Fertigation and Chemigation Market is Segmented by Input Type (Fertilizers, Insecticides, and More), by Crop Type (Grains and Cereals, and More), by Application (Open-Field Agriculture, and More), by Irrigation Type (Drip Irrigation, and More), and by Geography (North America and More). The Market Forecasts are Provided in Terms of Value (USD).
Geography Analysis
Europe holds a 34.0% share of the fertigation and chemigation market revenue in 2024. Growers of olives, vineyards, and greenhouse vegetables have implemented sensor-based fertigation systems to meet EU nitrate-directive requirements while improving yield consistency and product quality. The Common Agricultural Policy provides government grants and low-interest loans that support the adoption of advanced systems incorporating soil-moisture sensors, automated filtration, and digital monitoring platforms, reducing return-on-investment periods despite increasing labor costs. The extensive greenhouse facilities in the Netherlands, Spain, and Italy drive technology adoption, as controlled environments maximize the effectiveness of precise nutrient application and pH management. The market growth is supported by an established service network, where agricultural input suppliers collaborate with technology companies to deliver complete solution packages, from design through maintenance, targeting medium-sized farming cooperatives that require regulatory compliance without expanding their technical staff.
North America holds the second-largest market share by value, supported by widespread digital technology adoption and established technical support networks. Regional revenue is anticipated to grow from USD 263.82 million in 2023 to USD 433.74 million by 2030, driven by Midwestern farmers responding to fertilizer price fluctuations. Research indicates 78.6% of corn and soybean farmers prioritize fertilizer efficiency, increasing the implementation of variable-rate pivot fertigation. Federal conservation funding and strict runoff regulations strengthen the implementation rationale.
Africa demonstrates the highest growth potential with a 9.4% CAGR from 2025-2030. The Africa Fertilizer and Soil Health Summit and regional smart-irrigation initiatives highlight fertigation's water conservation and nutritional advantages. Implementation varies significantly-24% of farms in South Africa's Vhembe district utilize climate-smart irrigation, compared to 68% in Capricorn. SMS-based and low-bandwidth digital extension services help address knowledge gaps. Precision-fertilization programs in Kenya and Tanzania demonstrate regional interest in mobile applications for nutrient management guidance.
- Netafim Limited (An Orbia Business)
- Jain Irrigation Systems Limited (Rivulis Irrigation Ltd.)
- Lindsay Corporation
- Valmont Industries, Inc.
- The Toro Company
- Rain Bird Corporation
- Automat Industries Private Limited
- Mahindra EPC Irrigation Limited
- Hunter Industries Inc.
- Irritec S.p.A
Additional Benefits:
- The market estimate (ME) sheet in Excel format
- 3 months of analyst support
TABLE OF CONTENTS
1 Introduction
- 1.1 Study Assumptions and Market Definition
- 1.2 Scope of the Study
2 Research Methodology
3 Executive Summary
4 Market Landscape
- 4.1 Market Overview
- 4.2 Market Drivers
- 4.2.1 Rising Demand for Food Security and Yield Maximization
- 4.2.2 Government Subsidies and Micro-Irrigation Incentives
- 4.2.3 Growing Water Scarcity Heightens Efficient Nutrient Delivery
- 4.2.4 Rapid Adoption of Water-Soluble Specialty Fertilizers
- 4.2.5 IoT-enabled variable-rate fertigation systems
- 4.2.6 Labor and Cost Efficiency
- 4.3 Market Restraints
- 4.3.1 High Capital and O&M Costs
- 4.3.2 Less Technical Knowledge Among Farmers
- 4.3.3 Emitter Clogging from Precipitates and Biofilms
- 4.3.4 Increasing Regulatory Scrutiny on Nutrient Leaching
- 4.4 Regulatory Landscape
- 4.5 Technological Outlook
- 4.6 Porter's Five Forces Analysis
- 4.6.1 Threat of New Entrants
- 4.6.2 Bargaining Power of Buyers
- 4.6.3 Bargaining Power of Suppliers
- 4.6.4 Threat of Substitute Products
- 4.6.5 Intensity of Competitive Rivalry
5 Market Size and Growth Forecasts (Value)
- 5.1 By Input Type
- 5.1.1 Fertilizers
- 5.1.2 Insecticides
- 5.1.3 Fungicides
- 5.1.4 Herbicides
- 5.1.5 Biostimulants and Micronutrients
- 5.1.6 Other Input Types
- 5.2 By Crop Type
- 5.2.1 Cereals and Grains
- 5.2.2 Oilseeds and Pulses
- 5.2.3 Fruits and Vegetables
- 5.2.4 Plantation Crops
- 5.2.5 Turf and Ornamentals
- 5.2.6 Other Crop Types
- 5.3 By Application
- 5.3.1 Open-Field Agriculture
- 5.3.2 Greenhouse and Hydroponics
- 5.3.3 Nursery and Landscaping
- 5.3.4 Urban Vertical Farming
- 5.3.5 Other Applications
- 5.4 By Irrigation Type
- 5.4.1 Drip Irrigation
- 5.4.2 Sprinkler Irrigation
- 5.4.3 Other Irrigation Types
- 5.5 By Geography
- 5.5.1 North America
- 5.5.1.1 United States
- 5.5.1.2 Canada
- 5.5.1.3 Mexico
- 5.5.1.4 Rest of North America
- 5.5.2 Europe
- 5.5.2.1 Germany
- 5.5.2.2 United Kingdom
- 5.5.2.3 France
- 5.5.2.4 Italy
- 5.5.2.5 Spain
- 5.5.2.6 Russia
- 5.5.2.7 Rest of Europe
- 5.5.3 Asia-Pacific
- 5.5.3.1 China
- 5.5.3.2 India
- 5.5.3.3 Japan
- 5.5.3.4 Australia
- 5.5.3.5 South Korea
- 5.5.3.6 Rest of Asia-Pacific
- 5.5.4 South America
- 5.5.4.1 Brazil
- 5.5.4.2 Argentina
- 5.5.4.3 Rest of South America
- 5.5.5 Middle East and Africa
- 5.5.5.1 Turkey
- 5.5.5.2 Saudi Arabia
- 5.5.5.3 United Arab Emirates
- 5.5.5.4 South Africa
- 5.5.5.5 Egypt
- 5.5.5.6 Kenya
- 5.5.5.7 Rest of Middle East and Africa
- 5.5.1 North America
6 Competitive Landscape
- 6.1 Market Concentration
- 6.2 Strategic Moves
- 6.3 Market Share Analysis
- 6.4 Company Profiles (includes Global level Overview, Market level overview, Core Segments, Financials as available, Strategic Information, Market Rank/Share for key companies, Products and Services, and Recent Developments)
- 6.4.1 Netafim Limited (An Orbia Business)
- 6.4.2 Jain Irrigation Systems Limited (Rivulis Irrigation Ltd.)
- 6.4.3 Lindsay Corporation
- 6.4.4 Valmont Industries, Inc.
- 6.4.5 The Toro Company
- 6.4.6 Rain Bird Corporation
- 6.4.7 Automat Industries Private Limited
- 6.4.8 Mahindra EPC Irrigation Limited
- 6.4.9 Hunter Industries Inc.
- 6.4.10 Irritec S.p.A
7 Market Opportunities and Future Outlook
 化肥、灌溉和化学喷洒市场:2026-2032年全球市场预测(按设备类型、作物类型、组件、应用、最终用户和分销渠道划分)
 2026年全球施肥和化学灌溉市场报告
 全球施肥灌溉与化学灌溉市场,2026-2030年果树肥料市场按产品类型、应用阶段、来源、水果类型、销售管道和最终用户划分-全球预测(2026-2032 年)液态硫代硫酸钾市场:按应用、等级、最终用途、通路和形态划分 - 全球预测 2026-2032
 化学肥料和化学灌溉市场规模、份额和成长分析(按农业投入、作物类型、应用、灌溉系统和地区划分)-2026-2033年产业预测
 全球水肥一体化和化学灌溉市场:预测至 2032 年—按投入类型、作物类型、灌溉技术、应用、最终用户和地区进行分析
 水肥一体化和化学灌溉市场,按农业投入、作物类型、应用、灌溉类型、地区、机会和预测,2018-2032 年
 施肥系统的全球市场:2024年