


 |
市场调查报告书
商品编码
1844536
植物营养素:市场份额分析、行业趋势、统计数据和成长预测(2025-2030 年)Phytonutrients - Market Share Analysis, Industry Trends & Statistics, Growth Forecasts (2025 - 2030) |
||||||
※ 本网页内容可能与最新版本有所差异。详细情况请与我们联繫。
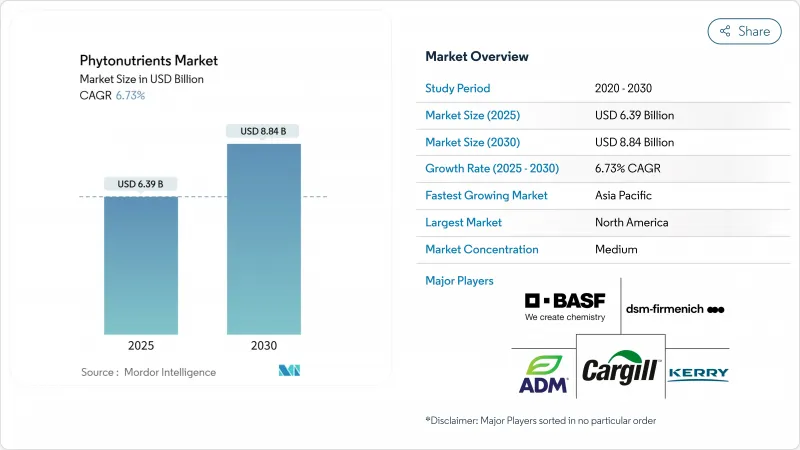
植物营养素市场规模预计在 2025 年为 63.9 亿美元,预计到 2030 年将达到 88.4 亿美元,复合年增长率为 6.73%。
消费者越来越多地将「天然」与「健康」联繫起来,监管机构持续将合成添加剂从核准名单中移除,超临界二氧化碳和无溶剂发酵等萃取技术则降低了生产成本。 2025年2月,FDA的一项新规将根据营养密度而非单一营养素重新定义「健康」已调理食品,为富含植物营养素的产品开闢新的标籤检视机会铺平道路。同时,蝶豆花蓝色色素和栀子花萃取物的新核准标誌着官方对植物来源成分的支持。日益加重的慢性病负担正加速科学界和商业性对多酚、类胡萝卜素和植物固醇预防性健康益处的兴趣,动物饲料製造商正在采用复合植物营养素混合物来改善牲畜的肠道屏障功能和生长性能。
全球植物营养素市场趋势与洞察
对洁净标示食品和饮料的需求不断增长
美国食品药物管理局 (FDA) 宣布将于 2024 年将红色染料 3 号从食品中移除,这促使製造商使用天然替代品重新生产产品。食品和饮料公司正在加入螺旋藻、甜菜红和类胡萝卜素等天然色素成分,以满足品牌推广、监管和感官要求。到 2025 年,製造商已成功透过提供 12-15% 的零售价溢价来抵消不断上涨的原材料成本。先进萃取方法的引入,尤其是天然深共熔溶剂,与传统乙醇製程相比,已使产量提高了 10% 以上,同时支持了永续性发展目标。该行业向洁净标示成分的转变已显着从一个专业市场领域发展成为消费者关注的主要问题,并将继续支持植物营养素市场的持续成长。这种转变反映了消费者对天然成分和食品透明度的普遍偏好。
消费者对预防性医疗保健和健康的意识不断增强
预防性医疗保健意识的不断增强,推动了各年龄层消费者对富含植物营养素的产品的需求增加。这种转变反映了消费者健康意识的广泛转变,消费者积极寻求天然化合物来补充他们的健康习惯。研究显示植物营养素对发炎和免疫功能的影响,这为寻求实证健康解决方案的消费者提供了科学检验,并吸引了他们。多项临床研究表明,这些化合物能够调节各种生物过程并支持整体健康。植物体等先进的输送系统可以改善植物营养素的吸收,满足消费者对有效产品的需求,并支援更高的价格分布。这些技术进步使製造商能够开发出更有效率的配方,最大限度地发挥植物来源化合物的治疗潜力,同时确保更高的生物可利用性。
萃取和加工植物营养素的生产成本高
高昂的生产成本限制了市场成长,因为它限制了价格敏感型消费者的获取,并降低了製造商的利润。传统的萃取方法需要大量的能源和专用设备,尤其是超临界二氧化碳系统,需要製造商投入大量的资金。亚临界水处理和天然深共晶溶剂等新型萃取技术有可能在维持产品品质和环境标准的同时降低成本。由于不同应用和地区的需求分散,许多植物营养素类别难以实现规模经济。微生物发酵和植物细胞培养等生物技术方法有可能降低长期生产成本并克服农业的限制,但需要大量的初步投资。利用农产品作为植物营养素有助于降低成本并永续性。
細項分析
类胡萝卜素将占2024年植物营养素市场份额的38.45%,这得益于其长期以来在食品和补充剂中用作色素和抗氧化剂的趋势。由于其氧化物清除能力和维生素原A的功能,其需求将保持稳定。同时,由于越来越多的证据显示多酚具有心臟保护和神经保护作用,其复合年增长率将达到9.55%。基于发酵的合成过程可以避免季节性采收限制,提高批次间一致性,并减少残留溶剂。
类胡萝卜素仍然是植物营养素市场的收益支柱,这得益于其强大的临床检验和经济高效的生产。然而,富含没食子酰的单宁、白藜芦醇类似物和黄酮醇配糖体的创新将推动多酚实现两位数增长,并可能在未来五年超越其主导地位。随着精准营养平台将基因变异与氧化压力标记物联繫起来,针对个体健康状况量身定制的多酚混合物将获得发展动力。这些趋势预示着整个植物营养素市场的产品结构将逐步调整。
在规模化农业生产和消费者信任的推动下,水果和蔬菜将在2024年占据植物营养素市场的53.75%。番茄渣、洋葱皮和葡萄渣等食品加工产品越来越多地被用作原料,将废弃物转化为有价值的产品,同时减少对环境的影响。根据美国农业部(USDA)的报告,2023年蔬菜产量将达到7.58亿吨,确保充足的原料供应。
草药和树木将经历最快的复合年增长率,达到8.45%,这得益于人们对睡茄、人参和绿茶儿茶素中适应原化合物的兴趣。标准化的萃取通讯协定确保了一致的效力,并减轻了以往的品管问题。谷类、豆类和油籽具有成本效益,但必须与食品应用需求竞争。海洋藻类和合成生物学平台是长期替代方案,有望实现纯度和环境控制,但需要进一步优化成本才能再形成植物营养素市场。
区域分析
到2024年,北美将占据植物营养素市场的41.65%,这得益于其清晰的监管体系、对研发的投入以及消费者支付溢价的意愿。美国食品药物管理局(FDA)近期核准了源自蝶豆花和日本栀子花的蓝色色素,这将增加天然色素的供应,进一步增强市场信心。该地区的农业生产——2023年蔬菜产量将达到7.58亿吨——确保了稳定的原料供应。电子商务和个人化营养订阅模式将加速超级食品混合物和定向软糖的直销。
亚太地区是成长最快的地区,复合年增长率达8.65%,这得益于不断增长的中阶人口、不断改进的法规以及传统医药传统。中国核准微藻类油和原花青素等新型保健食品成分,扩大了可接受成分的范围,并拓宽了产品创新的空间。 cfda.com。印度的阿育吠陀食品和日本的功能性食品进一步将植物营养素的使用推向主流,而当地的契约製造系统则降低了生产成本,增强了出口竞争力。
在严格的品质和永续性标准的支撑下,欧洲将实现稳步增长。绿色提取技术和生命週期评估报告的采用有助于提升品牌定位,但欧盟成员国之间的监管协调较为分散、耗时且成本高昂。南美洲、中东和非洲市场前景广阔,但仍处于发展阶段。巴西丰富的农业资源以及波湾合作理事会对膳食补充剂的新兴需求,为植物营养素市场的未来扩张创造了肥沃的土壤。
其他福利:
- Excel 格式的市场预测 (ME) 表
- 3个月的分析师支持
目录
第一章 引言
- 研究假设和市场定义
- 调查范围
第二章调查方法
第三章执行摘要
第四章 市场状况
- 市场概况
- 市场驱动因素
- 洁净标示食品和饮料强化剂的需求激增
- 消费者对预防性医疗保健和健康的意识不断增强
- 慢性病和健康状况的盛行率不断上升
- 对增强免疫力产品的需求不断增加
- 食品中对天然和植物来源的需求不断增加
- 将植物营养素融入饲料
- 市场限制
- 萃取和加工植物营养素的生产成本高
- 由于季节和农业限制,原材料供应有限
- 复杂的区域监管要求和核准流程
- 来自生产成本较低的合成替代品的竞争
- 供应链分析
- 监管状况
- 技术展望
- 波特五力分析
- 新进入者的威胁
- 买方的议价能力
- 供应商的议价能力
- 替代品的威胁
- 竞争对手之间的竞争
第五章市场规模及成长预测
- 按类型
- 类胡萝卜素
- 多酚
- 植物固醇
- Omega-3和Omega-6脂肪酸
- 维他命
- 其他的
- 按原料
- 水果和蔬菜
- 谷类、豆类和油籽
- 香草和树木
- 其他的
- 按形式
- 粉末
- 液体
- 其他的
- 按用途
- 饮食
- 营养补充品
- 动物营养
- 化妆品和个人护理
- 製药
- 按地区
- 北美洲
- 美国
- 加拿大
- 墨西哥
- 北美其他地区
- 欧洲
- 德国
- 英国
- 义大利
- 法国
- 西班牙
- 荷兰
- 其他欧洲国家
- 亚太地区
- 中国
- 印度
- 日本
- 澳洲
- 韩国
- 其他亚太地区
- 南美洲
- 巴西
- 阿根廷
- 南美洲其他地区
- 中东和非洲
- 南非
- 沙乌地阿拉伯
- 阿拉伯聯合大公国
- 其他中东和非洲地区
- 北美洲
第六章 竞争态势
- 市场集中度
- 策略倡议
- 市场排名分析
- 公司简介
- Cargill Inc.
- BASF SE
- Archer Daniels Midland Company
- DSM-Firmenich
- Kerry Group
- Givaudan SA
- Kemin Industries
- Lycored Ltd.
- Sabinsa Corp.
- Indena SpA
- International Flavors and Fragrances Inc.
- Ingredion Inc.
- Tate and Lyle PLC
- Arla Foods amba
- Roquette Freres
- Kalsec Inc.
- Prinova Group
- Foodchem International
- Zhejiang Medicine Co.
- Guangzhou Leader Bio-Tech
第七章 市场机会与未来展望
The phytonutrients market size is estimated at USD 6.39 billion in 2025 and is expected to reach USD 8.84 billion by 2030, reflecting a 6.73% CAGR.
Growth stems from three converging forces: consumers now equate "natural" with "healthy," regulators continue to remove synthetic additives from approved lists, and extraction technologies such as supercritical CO2 and solvent-free fermentation are lowering production costs. February 2025 FDA rules that redefine "healthy" prepared foods around nutrient density rather than single nutrients open new label-claim pathways for products fortified with phytonutrients. Meanwhile, fresh approvals of butterfly pea flower and Galdieria extract blue colorants signal official support for plant-derived ingredients. Intensifying chronic-disease burdens accelerate scientific and commercial interest in polyphenols, carotenoids, and phytosterols for preventive health, while animal-feed manufacturers adopt complex phytonutrient blends to improve gut barrier function and growth performance in livestock
Global Phytonutrients Market Trends and Insights
Surging Demand for Clean-Label Food and Beverage Fortification
The FDA's delisting of Red Dye No. 3 for food applications in 2024 prompted manufacturers to reformulate their products with natural alternatives. Food and beverage companies are increasingly incorporating natural color ingredients such as spirulina, beetroot red, and carotenoids to meet their branding, regulatory, and sensory requirements. Manufacturers have successfully offset the increased raw material costs through retail price premiums of 12-15% in 2025. The implementation of advanced extraction methods, particularly natural deep eutectic solvents, has achieved yield improvements exceeding 10% compared to traditional ethanol processes while supporting sustainability goals. The industry's transition toward clean-label ingredients has evolved significantly from a specialized market segment to become a primary consumer consideration, which continues to support sustained growth in the phytonutrients market. This shift reflects broader consumer preferences for natural ingredients and transparency in food products.
Heightened Consumer Awareness About Preventive Healthcare and Wellness
Growing awareness of preventive healthcare has increased consumer demand for phytonutrient-enriched products across all demographics. This shift reflects a broader transformation in health consciousness, where consumers actively seek natural compounds for their wellness routines. Research demonstrating phytonutrients' effects on inflammation and immune function has provided scientific validation that appeals to consumers seeking evidence-based health solutions. Multiple clinical studies have shown these compounds can help regulate various biological processes and support overall health maintenance. Advanced delivery systems like phytosomes improve the absorption of phytonutrients, meeting consumer requirements for effective products and supporting higher price points. These technological improvements have enabled manufacturers to develop more efficient formulations that maximize the therapeutic potential of plant-based compounds while ensuring better bioavailability.
High Production Costs Associated with Phytonutrient Extraction and Processing
High production costs limit market growth by restricting access to price-sensitive consumers and reducing manufacturer profits. Traditional extraction methods require substantial energy and specialized equipment, particularly supercritical CO2 systems that demand significant capital investment from manufacturers. New extraction technologies, such as subcritical water processing and natural deep eutectic solvents, may reduce costs while maintaining product quality and environmental standards. Many phytonutrient categories struggle to achieve economies of scale due to scattered demand across applications and regions. While biotechnology methods like microbial fermentation and plant cell culture could lower long-term production costs and overcome agricultural limitations, they require substantial initial investment. Using agricultural by-products as phytonutrient sources helps reduce costs and improve sustainability.
Other drivers and restraints analyzed in the detailed report include:
- Rising Prevalence of Chronic Diseases and Health Conditions
- Accelerating Demand for Immunity-Boosting Products
- Limited Availability of Raw Materials Due to Seasonal Dependencies and Agricultural Constraints
For complete list of drivers and restraints, kindly check the Table Of Contents.
Segment Analysis
Carotenoids secured 38.45% of the phytonutrients market share in 2024, anchored in long-standing uses as colorants and antioxidants in foods and supplements. Their oxide-scavenging capacity and Provitamin A functions keep demand stable. Conversely, polyphenols deliver the highest 9.55% CAGR on mounting evidence of cardioprotective and neuroprotective benefits. Fermentation-based synthesis now sidesteps seasonal crop limits, improving batch-to-batch consistency and reducing solvent residues-all persuasive advantages for clean-label brand owners.
Strong clinical validation and cost-efficient production ensure carotenoids remain the revenue anchor of the phytonutrients market. However, innovations in galloyl-rich tannins, resveratrol analogs, and flavonol glycosides propel polyphenols toward double-digit gains, which could erode carotenoids' dominance by the late decade. As precision-nutrition platforms link gene variants to oxidative-stress markers, polyphenol blends tailored to personal health profiles gain traction. These trends foreshadow a gradually rebalancing product mix within the wider phytonutrients market.
Fruits and vegetables accounted for 53.75% of the phytonutrients market in 2024, supported by extensive agricultural production and consumer trust. Food processing byproducts such as tomato pomace, onion skins, and grape marc are increasingly used as raw materials, converting waste into valuable products while reducing environmental impact. The United States Department of Agriculture (USDA) reported vegetable production of 758 million cwt in 2023, ensuring a sufficient raw material supply.
Herbs and trees chart the fastest 8.45% CAGR, propelled by interest in adaptogenic compounds from ashwagandha, ginseng, and green tea catechins. Standardized extraction protocols ensure consistent potency, alleviating historical quality-control concerns. Cereals, pulses, and oilseeds offer cost-efficient scale yet must compete with food-use demand. Marine algae and synthetic-biology platforms represent longer-term alternatives that promise purity and environmental control but require further cost optimization before they reshape the phytonutrients market.
The Phytonutrients Market Report is Segmented by Type (Carotenoids, Polyphenols, and More), Source (Fruits and Vegetables, Cereals, Pulses, and Oilseeds, and More), Form (Powder, Liquid, Others), Application (Food and Beverages, Dietary Supplements, Animal Nutrition, and More), and Geography (North America, Europe, Asia-Pacific, South America, Middle East and Africa). The Market Forecasts are Provided in Terms of Value (USD).
Geography Analysis
North America held 41.65% of the phytonutrients market in 2024, leveraging robust regulatory clarity, investment in research and development, and consumer readiness to pay premium prices. Recent FDA approvals of butterfly pea flower and Galdieria-derived blue pigment boost the supply of natural colorants, further reinforcing market confidence. The region's produce output, including 758 million cwt of vegetables in 2023, guarantees steady raw-material flows. E-commerce and personalized-nutrition subscription models accelerate direct-to-consumer adoption of superfood blends and targeted gummies.
Asia-Pacific is the fastest-growing region at an 8.65% CAGR, fueled by expanding middle-class populations, progressive regulations, and traditional-medicine heritage. China's approval of new health-food ingredients such as microalgae oil and proanthocyanidins enriches the permissible ingredient list and widens product innovation latitude cfda.com. Indian Ayurveda and Japanese Foods with Function Claims further mainstream phytonutrient usage, while local contract-manufacturing ecosystems reduce production costs, enhancing export competitiveness.
Europe posts steady growth underpinned by stringent quality and sustainability standards. Adoption of green extraction technologies and life-cycle-assessment reporting supports premium brand positioning, though fragmented regulatory alignment across EU members adds time and cost. South America and the Middle East and Africa remain nascent but promising; agricultural abundance in Brazil and emerging nutraceutical demand in the Gulf Cooperation Council create fertile terrain for the future expansion of the phytonutrients market.
- Cargill Inc.
- BASF SE
- Archer Daniels Midland Company
- DSM-Firmenich
- Kerry Group
- Givaudan SA
- Kemin Industries
- Lycored Ltd.
- Sabinsa Corp.
- Indena SpA
- International Flavors and Fragrances Inc.
- Ingredion Inc.
- Tate and Lyle PLC
- Arla Foods amba
- Roquette Freres
- Kalsec Inc.
- Prinova Group
- Foodchem International
- Zhejiang Medicine Co.
- Guangzhou Leader Bio-Tech
Additional Benefits:
- The market estimate (ME) sheet in Excel format
- 3 months of analyst support
TABLE OF CONTENTS
1 INTRODUCTION
- 1.1 Study Assumptions and Market Definition
- 1.2 Scope of the Study
2 RESEARCH METHODOLOGY
3 EXECUTIVE SUMMARY
4 MARKET LANDSCAPE
- 4.1 Market Overview
- 4.2 Market Drivers
- 4.2.1 Surging demand for clean-label food and beverage fortification
- 4.2.2 Heightened consumer awareness about preventive healthcare and wellness
- 4.2.3 Rising prevalence of chronic diseases and health conditions
- 4.2.4 Accelerating demand for immunity-boosting products
- 4.2.5 Increasing demand for natural and plant-based ingredients in food products
- 4.2.6 Integration of phytonutrients in animal feed
- 4.3 Market Restraints
- 4.3.1 High production costs associated with phytonutrient extraction and processing
- 4.3.2 Limited availability of raw materials due to seasonal dependencies and agricultural constraints
- 4.3.3 Complex regulatory requirements and approval processes across different regions
- 4.3.4 Competition from synthetic alternatives with lower production costs
- 4.4 Supply Chain Analysis
- 4.5 Regulatory Landscape
- 4.6 Technological Outlook
- 4.7 Porter's Five Forces Analysis
- 4.7.1 Threat of New Entrants
- 4.7.2 Bargaining Power of Buyers
- 4.7.3 Bargaining Power of Suppliers
- 4.7.4 Threat of Substitutes
- 4.7.5 Competitive Rivalry
5 MARKET SIZE AND GROWTH FORECASTS
- 5.1 By Type
- 5.1.1 Carotenoids
- 5.1.2 Polyphenols
- 5.1.3 Phytosterols
- 5.1.4 Omega-3 and 6 Fatty Acids
- 5.1.5 Vitamins
- 5.1.6 Others
- 5.2 By Source
- 5.2.1 Fruits and Vegetables
- 5.2.2 Cereals, Pulses, and Oilseeds
- 5.2.3 Herbs and Trees
- 5.2.4 Other Sources
- 5.3 By Form
- 5.3.1 Powder
- 5.3.2 Liquid
- 5.3.3 Others
- 5.4 By Application
- 5.4.1 Food and Beverages
- 5.4.2 Dietary Supplements
- 5.4.3 Animal Nutrition
- 5.4.4 Cosmetics and Personal Care
- 5.4.5 Pharmaceuticals
- 5.5 By Geography
- 5.5.1 North America
- 5.5.1.1 United States
- 5.5.1.2 Canada
- 5.5.1.3 Mexico
- 5.5.1.4 Rest of North America
- 5.5.2 Europe
- 5.5.2.1 Germany
- 5.5.2.2 United Kingdom
- 5.5.2.3 Italy
- 5.5.2.4 France
- 5.5.2.5 Spain
- 5.5.2.6 Netherlands
- 5.5.2.7 Rest of Europe
- 5.5.3 Asia-Pacific
- 5.5.3.1 China
- 5.5.3.2 India
- 5.5.3.3 Japan
- 5.5.3.4 Australia
- 5.5.3.5 South Korea
- 5.5.3.6 Rest of Asia-Pacific
- 5.5.4 South America
- 5.5.4.1 Brazil
- 5.5.4.2 Argentina
- 5.5.4.3 Rest of South America
- 5.5.5 Middle East and Africa
- 5.5.5.1 South Africa
- 5.5.5.2 Saudi Arabia
- 5.5.5.3 United Arab Emirates
- 5.5.5.4 Rest of Middle East and Africa
- 5.5.1 North America
6 COMPETITIVE LANDSCAPE
- 6.1 Market Concentration
- 6.2 Strategic Moves
- 6.3 Market Ranking Analysis
- 6.4 Company Profiles (includes Global level Overview, Market level overview, Core Segments, Financials (if available), Strategic Information, Market Rank/Share for key companies, Products and Services, and Recent Developments)
- 6.4.1 Cargill Inc.
- 6.4.2 BASF SE
- 6.4.3 Archer Daniels Midland Company
- 6.4.4 DSM-Firmenich
- 6.4.5 Kerry Group
- 6.4.6 Givaudan SA
- 6.4.7 Kemin Industries
- 6.4.8 Lycored Ltd.
- 6.4.9 Sabinsa Corp.
- 6.4.10 Indena SpA
- 6.4.11 International Flavors and Fragrances Inc.
- 6.4.12 Ingredion Inc.
- 6.4.13 Tate and Lyle PLC
- 6.4.14 Arla Foods amba
- 6.4.15 Roquette Freres
- 6.4.16 Kalsec Inc.
- 6.4.17 Prinova Group
- 6.4.18 Foodchem International
- 6.4.19 Zhejiang Medicine Co.
- 6.4.20 Guangzhou Leader Bio-Tech
