


 |
市场调查报告书
商品编码
1844575
单轴太阳能追踪器:市场份额分析、行业趋势、统计数据和成长预测(2025-2030 年)Single Axis Solar Tracker - Market Share Analysis, Industry Trends & Statistics, Growth Forecasts (2025 - 2030) |
||||||
※ 本网页内容可能与最新版本有所差异。详细情况请与我们联繫。
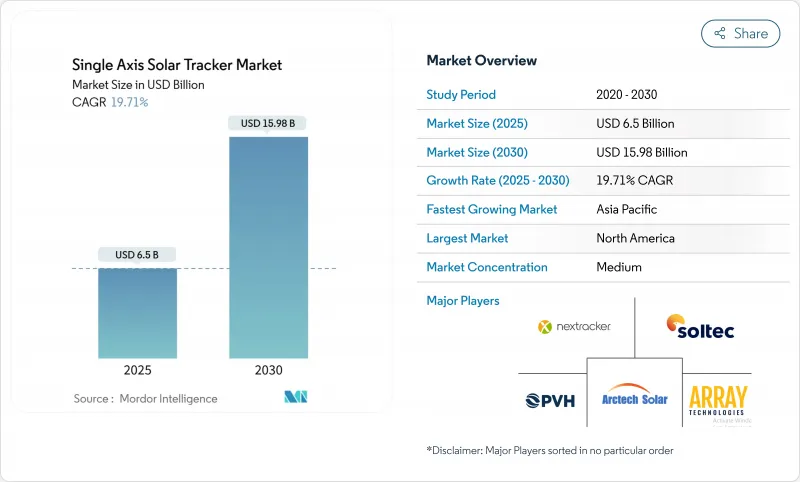
单轴太阳能追踪器市场规模预计在 2025 年为 65 亿美元,预计到 2030 年将达到 159.8 亿美元,预测期内(2025-2030 年)的复合年增长率为 19.71%。
公用事业规模太阳能的优点包括比固定倾斜阵列高15-25%的发电量,以及高照度地区更低的平准化电力成本,这些优势正在推动太阳能的扩张。垂直整合缓解了钢铁成本的波动,而美国《通膨降低法案》中10%的国内生产力奖励等政策,正推动追踪器製造向本地供应链转移。产品差异化正从纯粹的成本竞争转向增值功能,例如抗冰雹储存模式和人工智慧支援的预测性维护。这种转变强化了开发商在成熟市场和新兴市场新建太阳能装置时对追踪系统的强烈偏好。
全球单轴太阳能追踪器市场趋势与洞察
积极的公用事业规模采购要求推动了对追踪器的偏好
美国举行了公共规模的竞标,力争在2024年新增49吉瓦的太阳能装置容量,大多数计划都要求采用单轴追踪系统以确保更高的发电量。西班牙拥有欧洲60%以上的追踪器,该国也在其全国竞标中指定了追踪器,以稳定尖峰时段输出。此类强制要求提高了基准性能标准,实际上放弃了高价值公用事业计划采用固定倾斜式追踪器的替代方案。随着强製配置占领市场,开发商可以要求溢价。随着电网稳定性要求的提高,预计这种模式将在新的成长地区复製。
双轨协同,革新沙漠经济
在智利和澳大利亚,水平追踪器和二面体组件的组合已实现高达每千瓦时每年2,555千瓦时的发电量,而平准化成本低于2.45美分/千瓦时。追踪器最大限度地捕获了直接和反射的太阳辐射,而高反照率的沙漠土壤进一步增强了背面效益。这些综合效益使曾经被认为是边缘地区的位置即使在长距离输电的情况下也能获得发展。计划开发商可以获得较高的内部收益率,从而进一步鼓励在干旱地区进行大规模投资。
空气量认证延迟造成亚太地区瓶颈
颱风频繁的市场要求对大型组件进行气动风洞测试,这导致日本和菲律宾的追踪器认证週期延长6至12个月。由于认证週期延长,开发商积压库存,面临更高的资本成本。有些开发商为了满足专案进度,不得不放弃发电产量优势,转而采用固定倾角阵列。拥有认证设计的成熟追踪器品牌价格昂贵,这增加了新进入者的市场门槛。
細項分析
到2024年,水平安装将占据单轴太阳能追踪器市场的70%。由于成熟的供应链和简单的安装程序,水平安装将成为100MW以上计划的预设选择。由于高照度场地的能源收益证明了资本投资的合理性,该细分市场将占据单轴太阳能追踪器市场的大部分份额。由于土地受限的欧洲农场和农业太阳能装置需要紧密的行距,垂直安装追踪器的复合年增长率将达到20.2%。在此类用例中,垂直安装的双面组件可提供相当的功率输出,同时保留作物可用的土地。
朝向选择正变得因地制宜,而非千篇一律。据欧洲农业太阳能开发商称,垂直系统的平准化成本比高大双排设计低20-25%,而倾斜和连动双轴解决方案则适用于复杂地形和积雪地区。该领域技术的多样性拓宽了单轴太阳能追踪器的潜在市场,并缓解了供应商对单轴太阳能追踪器产业区域需求波动的影响。
到2024年,主动驱动将占据单轴太阳能追踪器市场规模的85%,提供精确的太阳追踪、回溯和风暴抑制功能。开发商重视这些功能,认为它们能够提高计划的融资能力,尤其是在保险公司要求预先设定冰雹缓解方案的情况下。然而,被动式热感和重力系统透过消除马达和控制电子设备,正以超过20%的复合年增长率扩张。现场数据显示,与固定倾斜基准相比,其效率提高了62.3%,同时减轻了偏远地区的维护负担。
当现场维护人员有限时,被动驱动器的成本控制优势极具吸引力。然而,由于无法执行复杂的存储配置,被动驱动器在高冰雹风险市场的应用受到限制,从而维护了有源驱动器供应商的收益壁垒。这种互动确保了单轴太阳能追踪器市场的强劲竞争和持续的技术创新。
单轴太阳能追踪器市场报告按方向(水平单轴追踪器、垂直单轴追踪器、其他)、驱动类型(主动、被动)、技术(光伏、聚光型太阳光电、聚光型太阳光电)、应用(公用事业规模、商业和工业、住宅)和地区(北美、欧洲、亚太、南美、中东和非洲)细分。
区域分析
北美在单轴太阳能追踪器市场占据主导地位。美国计划通常会指定追踪系统以确保电网稳定,并由德克萨斯、俄亥俄州和亚利桑那州的国内工厂提供支援。加拿大和墨西哥透过共用跨境製造和电网互连增加了互补需求。开发商利用现有的购电协议结构,确保可预测的收入流量,并降低投资先进追踪器功能的风险。
亚太地区是成长最快的地区。印度正准备迎接10亿千瓦的新增太阳能装置容量,其追踪器应用正在加速发展。中国製造业巨头也在扩大出口以满足当地需求。东南亚拥有220吉瓦的大型太阳能发电工程认证,树立全球工程标桿,并为全球追踪器的可靠性做出贡献。
欧洲和中东地区共用强劲而多元的成长前景。欧洲农业太阳能开发商采用垂直追踪器布局保护农田,将平准化成本降低了高达25%。西班牙在采购规则方面领先欧洲大陆,这些规则将追踪器标准化。在中东和北非,丰富的太阳能资源和积极的脱碳目标正在推动发电扩张。沙乌地阿拉伯的单轴追踪器装置容量在过去一年中增加了四倍多,这得益于与高容量係数相符的大规模竞标。
其他福利:
- Excel 格式的市场预测 (ME) 表
- 3个月的分析师支持
目录
第一章 引言
- 研究假设和市场定义
- 调查范围
第二章调查方法
第三章执行摘要
第四章 市场状况
- 市场概况
- 市场驱动因素
- 美国和西班牙积极的电力采购要求倾向于单轴跟踪
- 在智利和澳洲的沙漠地区,二面体模组与水平追踪器组合的 LCOE 迅速下降
- 通膨降低法案 10% 本地化奖金刺激北美工业计划
- 巴西东北部企业购电协议(PPA)蓬勃发展,需要低成本追踪来确保容量
- 人工智慧预测性运维减少中东沙尘带的追踪器停机时间
- 土地受限的欧盟高纬度市场采用垂直单轴
- 市场限制
- 颱风频繁的亚太地区风荷载认证延迟导致资本支出增加
- 钢铁价格波动导致卡车司机结构成本增加(欧盟和印度)
- 卡车司机「储存模式」故障导致银行可融资性标准收紧
- 在干旱地区,土壤流失的运作和维护负担比固定倾斜更高
- 供应链分析
- 监理展望
- 技术展望
- 五力分析
- 供应商的议价能力
- 消费者议价能力
- 新进入者的威胁
- 替代品的威胁
- 竞争对手之间的竞争强度
第五章市场规模及成长预测
- 按方向
- 水平单轴追踪器(HSAT)
- 垂直单轴追踪器(VSAT)
- 倾斜单轴追踪器 (TSAT)
- 按驱动类型
- 主动(电动/液压)
- 被动(热/重力)
- 依技术
- 光伏(PV)
- 聚光型太阳光电(CSP)
- 聚光型太阳光电(CPV)
- 按用途
- 公用事业规模
- 商业和工业
- 住宅
- 按地区
- 北美洲
- 美国
- 加拿大
- 墨西哥
- 欧洲
- 德国
- 英国
- 义大利
- 西班牙
- 法国
- 其他欧洲国家
- 亚太地区
- 中国
- 印度
- 日本
- 韩国
- 东南亚国协
- 其他亚太地区
- 南美洲
- 巴西
- 阿根廷
- 智利
- 南美洲其他地区
- 中东和非洲
- 沙乌地阿拉伯
- 阿拉伯聯合大公国
- 南非
- 其他中东和非洲地区
- 北美洲
第六章 竞争态势
- 市场集中度
- 策略性倡议(併购、伙伴关係、购电协议)
- 市场占有率分析(主要企业的市场排名/份额)
- 公司简介
- NEXTracker Inc.
- Array Technologies Inc.
- PV Hardware Solutions SLU(PVH)
- Arctech Solar Holding Co. Ltd.
- Soltec Power Holdings SA
- Valmont Industries Inc.(Valmont Solar)
- Nclave Renewable SL
- STi Norland SL
- GameChange Solar
- FTC Solar Inc.
- Solar FlexRack(Northern States Metals)
- Ideematec Deutschland GmbH
- Convert Italia SpA
- TrinaTracker(Trina Solar Co. Ltd.)
- SunPower Corporation
- AllEarth Renewables Inc.
- Sun Action Trackers
- Alion Energy Inc.
- Clenergy Co. Ltd.
- Exosun SAS
第七章 市场机会与未来展望
The Single Axis Solar Tracker Market size is estimated at USD 6.5 billion in 2025, and is expected to reach USD 15.98 billion by 2030, at a CAGR of 19.71% during the forecast period (2025-2030).
Utility-scale solar's dominance, the technology's 15-25% energy-yield premium over fixed-tilt arrays, and falling levelized cost of electricity in high-irradiance regions underpin this expansion. Vertical integration is mitigating steel cost volatility, while policies such as the United States Inflation Reduction Act's 10% domestic-content bonus are steering tracker manufacturing toward local supply chains. Product differentiation is shifting from pure cost competition to value-added features like hail-resistant stow modes and AI-enabled predictive maintenance. These shifts collectively reinforce strong developer preference for tracking systems in new solar capacity additions across mature and emerging markets.
Global Single Axis Solar Tracker Market Trends and Insights
Aggressive utility-scale procurement mandates drive tracker preference
Utility-scale tenders in the United States added 49 GW of solar capacity in 2024, and most projects required single-axis tracking to guarantee higher capacity factors. Spain, which hosts over 60% of European tracker installations, similarly specifies trackers in nationwide auctions to stabilize peak-period output. These mandates raise the baseline performance bar, effectively sidelining fixed-tilt alternatives in high-value utility projects. Developers gain premium pricing as mandated configurations create a captive market. Replication of this model in new growth regions is expected as grids tighten stability requirements.
Bifacial-tracking synergy revolutionizes desert economics
Horizontal trackers paired with bifacial modules in Chile and Australia now produce up to 2,555 kWh per kWp each year, driving levelized costs below 2.45 cents per kWh. Trackers maximise both direct and reflected irradiance capture, while high-albedo desert soils further boost rear-side gains. These combined benefits unlock sites once considered marginal, even where transmission distances are long. Project developers secure higher internal rates of return, which encourages additional large-scale investments in arid zones.
Wind-load certification delays create APAC bottlenecks
Typhoon-prone markets require aeroelastic tunnel testing for large-format modules, extending tracker approvals by 6-12 months in Japan and the Philippines. Developers face higher capital costs as they hold inventory during protracted certification cycles. Some shift to fixed-tilt arrays to protect schedules, despite losing energy yield benefits. Established tracker brands with pre-certified designs command premium prices, reinforcing market entry barriers for new entrants.
Other drivers and restraints analyzed in the detailed report include:
- Inflation Reduction Act domestic-content bonus reshapes North American supply chains
- Corporate PPA boom demands tracking precision
- Steel-price volatility pressures tracker economics
For complete list of drivers and restraints, kindly check the Table Of Contents.
Segment Analysis
Horizontal configurations held a 70% slice of the single axis solar tracker market in 2024. They thrive on mature supply chains and straightforward installation procedures, making them the default choice for projects over 100 MW. This segment secures a large portion of the single axis solar tracker market size because energy gains justify their capital expenditure in high-irradiance sites. Vertical trackers grow at a 20.2% CAGR because land-constrained European farms and agrivoltaic setups need narrower row spacing. In these use cases, vertical-mounted bifacial modules provide comparable output while preserving ground use for crops.
Orientation selection is increasingly site-specific rather than one-size-fits-all. European agrivoltaic developers report 20-25% lower levelized costs with vertical systems than with elevated dual-row designs. Meanwhile inclined and articulated dual-axis solutions serve complex terrain or snow-prone regions. Technology diversity within this segment broadens the addressable single axis solar tracker market and cushions suppliers against regional demand swings across the single axis solar tracker industry.
Active drives captured 85% of the single axis solar tracker market size in 2024, providing precise sun-tracking, backtracking, and storm stow functions. Developers value these features for project bankability, especially where insurers require predefined hail mitigation routines. Yet passive thermal and gravity systems are scaling at more than 20% CAGR by eliminating motors and control electronics. Field data shows 62.3% efficiency gains over fixed-tilt baselines while lowering maintenance burdens in remote sites.
The cost-control advantage of passive drives is attractive where on-site maintenance crews are scarce. However, their inability to execute complex stow profiles limits adoption in hail-risk markets, preserving a revenue moat for active-drive suppliers. This interplay ensures robust competition and ongoing innovation across the single axis solar tracker market.
The Single Axis Solar Tracker Market Report is Segmented by Orientation (Horizontal Single-Axis Trackers, Vertical Single-Axis Trackers, and Others), Drive Type (Active and Passive), Technology (Photovoltaic, Concentrated Solar Power, and Concentrator Photovoltaic), Application (Utility-Scale, Commercial and Industrial, and Residential), and Geography (North America, Europe, Asia-Pacific, South America, and Middle East and Africa).
Geography Analysis
North America retains a commanding portion of the single axis solar tracker market. United States projects routinely specify tracking systems for grid stability, and supply is now anchored by domestic factories in Texas, Ohio, and Arizona. Canada and Mexico add complementary demand through cross-border manufacturing and shared grid interconnections. Developers leverage well-established power-purchase agreement structures, ensuring predictable revenue flows that help de-risk investment in advanced tracker features.
Asia-Pacific is the fastest-growing region. India accelerated tracker adoption on its path toward 100 GW of new solar capacity, and China's manufacturing leaders are both scaling exports and meeting local demand. Southeast Asia shows a 220 GW pipeline of prospective utility-scale solar projects yet only 3% is under construction, hinting at vast untapped tracker demand once policy clarity improves. Japan tightens wind-resilience certification, setting global engineering benchmarks that benefit tracker reliability worldwide.
Europe and the Middle East share strong but varied growth narratives. European agrivoltaic developers cut levelized costs by as much as 25% through vertical tracker layouts that preserve farmland. Spain leads the continent with procurement rules that make tracking standard practice. In the Middle East and North Africa, expansion is driven by high solar resource and aggressive decarbonization targets. Saudi Arabia's single-axis tracker capacity grew more than fourfold over the past year, backed by large-scale tenders that reward high capacity factors.
- NEXTracker Inc.
- Array Technologies Inc.
- PV Hardware Solutions S.L.U. (PVH)
- Arctech Solar Holding Co. Ltd.
- Soltec Power Holdings S.A.
- Valmont Industries Inc. (Valmont Solar)
- Nclave Renewable S.L.
- STi Norland S.L.
- GameChange Solar
- FTC Solar Inc.
- Solar FlexRack (Northern States Metals)
- Ideematec Deutschland GmbH
- Convert Italia S.p.A.
- TrinaTracker (Trina Solar Co. Ltd.)
- SunPower Corporation
- AllEarth Renewables Inc.
- Sun Action Trackers
- Alion Energy Inc.
- Clenergy Co. Ltd.
- Exosun SAS
Additional Benefits:
- The market estimate (ME) sheet in Excel format
- 3 months of analyst support
TABLE OF CONTENTS
1 Introduction
- 1.1 Study Assumptions & Market Definition
- 1.2 Scope of the Study
2 Research Methodology
3 Executive Summary
4 Market Landscape
- 4.1 Market Overview
- 4.2 Market Drivers
- 4.2.1 Aggressive utility-scale procurement mandates in the U.S. & Spain favouring single-axis trackers
- 4.2.2 Rapid LCOE reduction for bifacial modules paired with horizontal trackers in Chile & Australia deserts
- 4.2.3 Inflation Reduction Act 10 % domestic-content bonus spurring North-American industrial projects
- 4.2.4 Corporate PPA boom in Brazil's Northeast requiring low-cost tracking for capacity-factor guarantees
- 4.2.5 AI-enabled predictive O&M lowering downtime of trackers in Middle-East dust zones
- 4.2.6 Vertical single-axis adoption in land-constrained high-latitude EU markets
- 4.3 Market Restraints
- 4.3.1 Wind-load certification delays in typhoon-prone APAC raising CAPEX
- 4.3.2 Steel-price volatility inflating tracker structure costs (EU & India)
- 4.3.3 Tracker "stow-mode" failure incidents tightening bankability criteria
- 4.3.4 High soiling-loss O&M burden in arid regions compared with fixed-tilt
- 4.4 Supply-Chain Analysis
- 4.5 Regulatory Outlook
- 4.6 Technological Outlook
- 4.7 Porter's Five Forces
- 4.7.1 Bargaining Power of Suppliers
- 4.7.2 Bargaining Power of Consumers
- 4.7.3 Threat of New Entrants
- 4.7.4 Threat of Substitutes
- 4.7.5 Intensity of Competitive Rivalry
5 Market Size & Growth Forecasts
- 5.1 By Orientation
- 5.1.1 Horizontal Single-Axis Trackers (HSAT)
- 5.1.2 Vertical Single-Axis Trackers (VSAT)
- 5.1.3 Tilted/Inclined Single-Axis Trackers (TSAT)
- 5.2 By Drive Type
- 5.2.1 Active (Electric/Hydraulic)
- 5.2.2 Passive (Thermal/Gravity)
- 5.3 By Technology
- 5.3.1 Photovoltaic (PV)
- 5.3.2 Concentrated Solar Power (CSP)
- 5.3.3 Concentrator Photovoltaic (CPV)
- 5.4 By Application
- 5.4.1 Utility-Scale
- 5.4.2 Commercial and Industrial
- 5.4.3 Residential
- 5.5 By Geography
- 5.5.1 North America
- 5.5.1.1 United States
- 5.5.1.2 Canada
- 5.5.1.3 Mexico
- 5.5.2 Europe
- 5.5.2.1 Germany
- 5.5.2.2 United Kingdom
- 5.5.2.3 Italy
- 5.5.2.4 Spain
- 5.5.2.5 France
- 5.5.2.6 Rest of Europe
- 5.5.3 Asia-Pacific
- 5.5.3.1 China
- 5.5.3.2 India
- 5.5.3.3 Japan
- 5.5.3.4 South Korea
- 5.5.3.5 ASEAN Countries
- 5.5.3.6 Rest of Asia-Pacific
- 5.5.4 South America
- 5.5.4.1 Brazil
- 5.5.4.2 Argentina
- 5.5.4.3 Chile
- 5.5.4.4 Rest of South America
- 5.5.5 Middle East and Africa
- 5.5.5.1 Saudi Arabia
- 5.5.5.2 United Arab Emirates
- 5.5.5.3 South Africa
- 5.5.5.4 Rest of Middle East and Africa
- 5.5.1 North America
6 Competitive Landscape
- 6.1 Market Concentration
- 6.2 Strategic Moves (M&A, Partnerships, PPAs)
- 6.3 Market Share Analysis (Market Rank/Share for key companies)
- 6.4 Company Profiles (includes Global level Overview, Market level overview, Core Segments, Financials as available, Strategic Information, Products & Services, and Recent Developments)
- 6.4.1 NEXTracker Inc.
- 6.4.2 Array Technologies Inc.
- 6.4.3 PV Hardware Solutions S.L.U. (PVH)
- 6.4.4 Arctech Solar Holding Co. Ltd.
- 6.4.5 Soltec Power Holdings S.A.
- 6.4.6 Valmont Industries Inc. (Valmont Solar)
- 6.4.7 Nclave Renewable S.L.
- 6.4.8 STi Norland S.L.
- 6.4.9 GameChange Solar
- 6.4.10 FTC Solar Inc.
- 6.4.11 Solar FlexRack (Northern States Metals)
- 6.4.12 Ideematec Deutschland GmbH
- 6.4.13 Convert Italia S.p.A.
- 6.4.14 TrinaTracker (Trina Solar Co. Ltd.)
- 6.4.15 SunPower Corporation
- 6.4.16 AllEarth Renewables Inc.
- 6.4.17 Sun Action Trackers
- 6.4.18 Alion Energy Inc.
- 6.4.19 Clenergy Co. Ltd.
- 6.4.20 Exosun SAS
7 Market Opportunities & Future Outlook
- 7.1 White-Space & Unmet-Need Assessment
 2025年全球智慧太阳能追踪帘子市场报告
 双轴太阳能追踪器市场按应用、驱动机制、控制机制、马达类型和销售管道划分—2025-2032年全球预测太阳能追踪器市场:按类型、技术、系统类型和应用程式划分 - 2025-2032 年全球预测
 2025-2029年全球单轴太阳能光电追踪器市场2025年全球太阳能追踪器市场报告2025年发电用太阳能追踪器全球市场报告2025年双轴太阳能追踪器全球市场报告
 2025 年至 2033 年太阳能追踪器市场规模、份额、趋势及预测(按类型、追踪类型、技术、应用和地区)
 2025年全球光电追踪器市场占有率报告
 全球太阳能追踪器市场(按轴类型、类型、应用程式和地区)预测至 2029 年