


 |
市场调查报告书
商品编码
1844594
印度可再生能源:市场份额分析、行业趋势、统计数据和成长预测(2025-2030 年)India Renewable Energy - Market Share Analysis, Industry Trends & Statistics, Growth Forecasts (2025 - 2030) |
||||||
※ 本网页内容可能与最新版本有所差异。详细情况请与我们联繫。
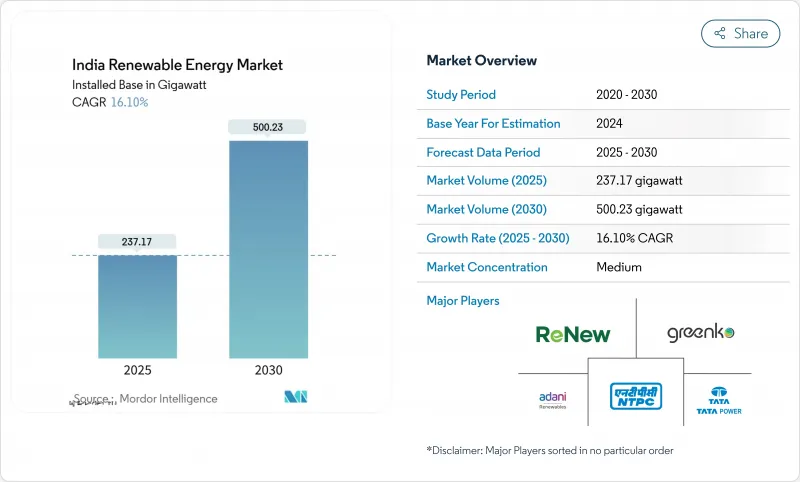
印度可再生能源市场规模预计将从 2025 年的 237.17 吉瓦成长到 2030 年的 500.23 吉瓦,预测期内(2025-2030 年)的复合年增长率为 16.10%。
技术成本下降、积极的竞标以及PM-KUSUM和生产连结奖励计画(PLI)计划等政策槓桿正在形成一个规模化和成本降低的自我强化循环。太阳能日益占据主导地位、商业和工业(C&I)采购激增以及混合储能项目竞标管道不断增加,正在重新定义竞争动态,并鼓励创纪录的资本流入。同时,电网瓶颈、配电公司(DISCOM)付款延迟以及关键矿产资源暴露等问题如果不解决,可能会抑制发展动能。儘管如此,印度可再生能源市场仍展现出强劲的投资者信心,最近一次高峰会上宣布的860亿美元新承诺就证明了这一点。
印度可再生能源市场趋势与洞察
降低太阳能和风能的平准化电力成本
在公共电力协会 (PLI) 支持的组件生产和技术改进的支持下,太阳能电价将达到创纪录的 2.51 印度卢比/千瓦时,进口依赖度将从 2020 年的 90% 降至 2025 年的 60% 以下。风电的成本轨迹将与之类似,儘管增速较慢,但 2 兆瓦以下风力涡轮机的改造潜力为 25.4 吉瓦,可进一步优化成本。太阳能、风能和煤炭成本曲线的趋同已达到临界点,可再生能源发电现已成为新增发电容量的预设选项。
中央和各州积极进行可再生能源竞标
印度太阳能公司(SECI)及其政府机构已为2024年上半年竞标7.6兆瓦的项目,较去年同期成长191%。预计到2026年将开发132.7兆瓦的计划,开发商可以放心地扩大产能和计划储备。
配电公司的财务压力和付款延迟
由于多个州的配电损失超过 20%,损害了配电公司的流动性并延迟了付款,因此,在定价和补贴合理化方面进行结构性改革仍然至关重要。
細項分析
2024 年,太阳能发电量将达到 114 吉瓦,占印度可再生能源市场的 48%。到 2030 年,印度可再生能源市场规模预计以 17% 的复合年增长率成长,仅太阳能将达到 254 吉瓦。风力发电稳定在 47.36 兆瓦,但该国面临对老化计划进行改造的需求。水力发电为 51.99 兆瓦,生质能发电 11.32 兆瓦,支撑基本负载。自 2026 年 4 月起生效的强制性国内电池生产要求将需要将目前 7.6 兆瓦的电池容量扩大数倍。古吉拉突邦生产了 45% 的组件和 52% 的电池生产线,从而培育了供应链丛集,降低了物流成本和出口时间。
到2023财年,出口将激增至3吉瓦,主要来自美国,显示国际竞争力不断增强。风电开发商正在寻求更大的涡轮机,以取代25吉瓦的2兆瓦以下机组,而混合太阳能和风能储能发电厂正在赢得需要24小时运作配置的竞标。地热和潮汐技术仍处于起步阶段,但受惠于研发津贴。
印度可再生能源市场报告按能源来源(太阳能、风能、水力发电、生质能源、其他可再生)和终端用途领域(公共产业、商业和工业、住宅、研发和分析)进行细分。市场规模和预测以装置容量(吉瓦)为单位。
其他福利:
- Excel 格式的市场预测 (ME) 表
- 3个月的分析师支持
目录
第一章 引言
- 研究假设和市场定义
- 调查范围
第二章调查方法
第三章执行摘要
第四章 市场状况
- 市场概况
- 市场驱动因素
- 降低太阳能和风能的平准化电力成本
- 积极的中央和州级可再生能源竞标(SECI、GUVNL 等)
- 可再生能源购买义务和ESCerts实施
- 工商业承购商的绿色电力购电协议激增
- 透过生产挂钩奖励(PLI)振兴国内製造业
- 混合+储能竞标结构降低抑制风险
- 市场限制
- 配电公司的财务压力和付款延迟
- 土地征用和场地保障方面的瓶颈
- 对关键矿物(硅、钕铁硼、锂)供应链的影响
- 白天停电和电网拥堵热点增多
- 供应链分析
- 监管状况
- 技术展望
- 波特五力分析
- 供应商的议价能力
- 买方的议价能力
- 新进入者的威胁
- 替代品的威胁
- 竞争对手之间的竞争强度
- PESTLE分析
第五章市场规模及成长预测
- 按来源
- 太阳能电池
- 风力
- 水力发电(大型/小型)
- 生质能源(生物质、甘蔗渣、垃圾焚化发电)
- 其他可再生能源(混合能源、地热能源、潮汐能源)
- 按最终用户部门
- 公共产业
- 商业和工业
- 住宅
- 用于农业(PM-KUSUM,太阳能帮浦)
第六章 竞争态势
- 市场集中度
- 策略性倡议(併购、伙伴关係、购电协议)
- 市场占有率分析(主要企业的市场排名/份额)
- 公司简介
- Adani Green Energy Ltd
- NTPC Ltd(RE Arm)
- ReNew Energy Global Plc
- Tata Power Renewables
- ACME Solar Holdings
- Azure Power Global Ltd
- Greenko Group
- JSW Energy(Neo)
- Suzlon Energy Ltd
- SJVN Green Energy Ltd
- Hero Future Energies
- Waaree Energies Ltd
- Vikram Solar Ltd
- Sterling & Wilson Renewable Energy
- Jakson Group(Solar)
- First Solar Inc
- Trina Solar Co Ltd
- JinkoSolar Holding Co Ltd
- Siemens Gamesa Renewable Energy SA
- Vestas Wind Systems AS
第七章 市场机会与未来展望
The India Renewable Energy Market size in terms of installed base is expected to grow from 237.17 gigawatt in 2025 to 500.23 gigawatt by 2030, at a CAGR of 16.10% during the forecast period (2025-2030).
Declining technology costs, aggressive auctions, and policy tools such as PM-KUSUM and the Production-Linked Incentive (PLI) scheme have created a self-reinforcing cycle of scale and cost reduction. Solar's expanding dominance, commercial and industrial (C&I) procurement surge, and a widening pipeline of hybrid-plus-storage tenders are redefining competitive dynamics and spurring record capital inflows. At the same time, grid bottlenecks, DISCOM payment delays, and critical-mineral exposure threaten to temper momentum if left unresolved. Nevertheless, the India renewable energy market continues to demonstrate strong investor confidence, underscored by USD 86 billion in fresh commitments announced at recent summits .
India Renewable Energy Market Trends and Insights
Falling LCOE of Solar PV & Wind
Record solar tariffs of INR 2.51/kWh have been achieved on the back of PLI-supported module production and technology gains, reducing import dependence from 90% in 2020 to below 60% in 2025. Wind's cost trajectory is similar, though slower, yet 25.4 GW of repowering potential for sub-2 MW turbines offers further cost optimization. The merging of solar, wind, and coal cost curves has reached a tipping point where renewable additions are now the default choice for new capacity.
Aggressive Central & State-Level RE Auctions
Solar Energy Corporation of India (SECI) and state agencies issued 7.6 GW of tenders in H1 2024, 191% higher year-on-year, while evolving bid structures now require storage and domestic content to enhance grid integration . Visibility of 132.7 GW of projects through 2026 gives developers confidence to expand manufacturing and project pipelines.
DISCOM Financial Stress & Payment Delays
Distribution losses above 20% in several states continue to erode DISCOM liquidity, delaying payments and discouraging new projects despite payment-security mechanisms . Structural reforms in tariff setting and subsidy rationalization remain essential.
Other drivers and restraints analyzed in the detailed report include:
- Renewable Purchase Obligations & ESCerts Enforcement
- Surge in Green-Power PPAs from C&I Off-takers
- Land-Acquisition & Right-of-Way Bottlenecks
For complete list of drivers and restraints, kindly check the Table Of Contents.
Segment Analysis
Solar capacity stood at 114 GW in 2024, representing 48% of the India renewable energy market. Solar's 17% CAGR to 2030 is expected to raise the India renewable energy market size for solar alone to 254 GW. Domestic module output climbed from 10 GW in 2021 to 77.2 GW in 2024 after the PLI outlay, while wind remains steady at 47.36 GW, yet faces a repowering requirement for aging projects. Hydro contributes 51.99 GW and biomass 11.32 GW, supplying baseload support. A mandatory domestic-cell rule from April 2026 will necessitate a many-fold expansion of the current 7.6 GW cell capacity. Gujarat hosts 45% of modules and 52% of cell lines, fostering a supply-chain cluster that cuts logistics costs and export times.
Solar's export surge to 3 GW in FY 2023, mainly to the United States, underlines rising global competitiveness. Wind developers pursue larger turbines to replace 25 GW of sub-2 MW units, while hybrid solar-wind-storage plants win tenders that demand round-the-clock profiles. Geothermal and tidal technologies remain nascent but benefit from supportive R&D grants.
The India Renewable Energy Market Report is Segmented by Source (Solar, Wind, Hydro, Bioenergy, and Other Renewables), End-Use Sector (Utilities, Commercial and Industrial, Residential, R and Agricultural). The Market Size and Forecasts are Provided in Terms of Installed Capacity (GW).
List of Companies Covered in this Report:
- Adani Green Energy Ltd
- NTPC Ltd (RE Arm)
- ReNew Energy Global Plc
- Tata Power Renewables
- ACME Solar Holdings
- Azure Power Global Ltd
- Greenko Group
- JSW Energy (Neo)
- Suzlon Energy Ltd
- SJVN Green Energy Ltd
- Hero Future Energies
- Waaree Energies Ltd
- Vikram Solar Ltd
- Sterling & Wilson Renewable Energy
- Jakson Group (Solar)
- First Solar Inc
- Trina Solar Co Ltd
- JinkoSolar Holding Co Ltd
- Siemens Gamesa Renewable Energy SA
- Vestas Wind Systems AS
Additional Benefits:
- The market estimate (ME) sheet in Excel format
- 3 months of analyst support
TABLE OF CONTENTS
1 Introduction
- 1.1 Study Assumptions & Market Definition
- 1.2 Scope of the Study
2 Research Methodology
3 Executive Summary
4 Market Landscape
- 4.1 Market Overview
- 4.2 Market Drivers
- 4.2.1 Falling LCOE of Solar PV & Wind
- 4.2.2 Aggressive Central & State-Level RE Auctions (SECI, GUVNL, etc.)
- 4.2.3 Renewable Purchase Obligations & ESCerts Enforcement
- 4.2.4 Surge in Green-Power PPAs from C&I Off-takers
- 4.2.5 Production-Linked Incentive (PLI) Boosting Domestic Manufacturing
- 4.2.6 Hybrid + Storage Tender Structure Reducing Curtailment Risk
- 4.3 Market Restraints
- 4.3.1 DISCOM Financial Stress & Payment Delays
- 4.3.2 Land-Acquisition & Right-of-Way Bottlenecks
- 4.3.3 Critical-Mineral Supply-Chain Exposure (Si, NdFeB, Li)
- 4.3.4 Rising Day-time Curtailment & Grid Congestion Hot-spots
- 4.4 Supply-Chain Analysis
- 4.5 Regulatory Landscape
- 4.6 Technological Outlook
- 4.7 Porter's Five Forces Analysis
- 4.7.1 Bargaining Power of Suppliers
- 4.7.2 Bargaining Power of Buyers
- 4.7.3 Threat of New Entrants
- 4.7.4 Threat of Substitutes
- 4.7.5 Intensity of Competitive Rivalry
- 4.8 PESTLE Analysis
5 Market Size & Growth Forecasts
- 5.1 By Source
- 5.1.1 Solar
- 5.1.2 Wind
- 5.1.3 Hydro (Large and Small)
- 5.1.4 Bioenergy (Biomass, Bagasse, Waste-to-Energy)
- 5.1.5 Other Renewables (Hybrid, Geothermal, Tidal)
- 5.2 By End-Use Sector
- 5.2.1 Utility
- 5.2.2 Commercial and Industrial
- 5.2.3 Residential
- 5.2.4 Agricultural (PM-KUSUM, Solar Pumps)
6 Competitive Landscape
- 6.1 Market Concentration
- 6.2 Strategic Moves (M&A, Partnerships, PPAs)
- 6.3 Market Share Analysis (Market Rank/Share for key companies)
- 6.4 Company Profiles (includes Global level Overview, Market level overview, Core Segments, Financials as available, Strategic Information, Products & Services, and Recent Developments)
- 6.4.1 Adani Green Energy Ltd
- 6.4.2 NTPC Ltd (RE Arm)
- 6.4.3 ReNew Energy Global Plc
- 6.4.4 Tata Power Renewables
- 6.4.5 ACME Solar Holdings
- 6.4.6 Azure Power Global Ltd
- 6.4.7 Greenko Group
- 6.4.8 JSW Energy (Neo)
- 6.4.9 Suzlon Energy Ltd
- 6.4.10 SJVN Green Energy Ltd
- 6.4.11 Hero Future Energies
- 6.4.12 Waaree Energies Ltd
- 6.4.13 Vikram Solar Ltd
- 6.4.14 Sterling & Wilson Renewable Energy
- 6.4.15 Jakson Group (Solar)
- 6.4.16 First Solar Inc
- 6.4.17 Trina Solar Co Ltd
- 6.4.18 JinkoSolar Holding Co Ltd
- 6.4.19 Siemens Gamesa Renewable Energy SA
- 6.4.20 Vestas Wind Systems AS
7 Market Opportunities & Future Outlook
- 7.1 White-space & Unmet-Need Assessment
 农业可再生能源:生质燃料、太阳能发电厂和永续农业实践的全球市场—按应用、产品和地区分類的分析和预测(2025-2035 年)
 2026年全球可再生能源市场报告2026年全球多元能源系统市场报告2026年全球太阳能燃料市场报告
 可再生能源市场:全球产业分析、市场规模、市场份额及预测(依投资类型、可再生能源类型、企业类型、应用、国家及地区划分)-2026-2033年
 风电场变电站市场按组件类型、配置类型、连接类型、电压等级、最终用户和安装类型划分,全球预测(2026-2032年)全球节能设备市场:机会与策略展望(至2034年)
 节能微控制器市场分析及预测(至2035年):依类型、产品类型、服务、技术、组件、应用、最终用户、功能、安装类型、解决方案划分
 中国可再生能源:市场占有率分析、产业趋势与统计、成长预测(2026-2031年)新加坡可再生能源:市场占有率分析、产业趋势与统计、成长预测(2026-2031)