


 |
市场调查报告书
商品编码
1844624
奈米金属氧化物:市场份额分析、行业趋势、统计数据和成长预测(2025-2030 年)Nano-Metal Oxides - Market Share Analysis, Industry Trends & Statistics, Growth Forecasts (2025 - 2030) |
||||||
※ 本网页内容可能与最新版本有所差异。详细情况请与我们联繫。
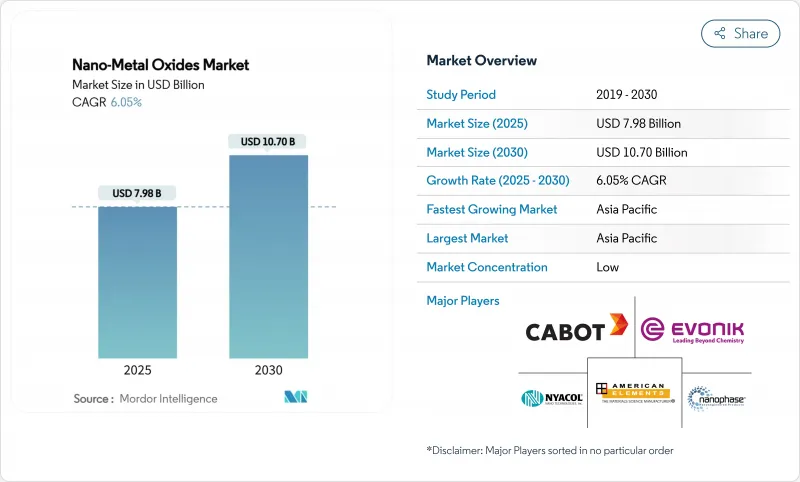
奈米金属氧化物市场规模预计在 2025 年为 79.8 亿美元,预计到 2030 年将达到 107 亿美元,预测期内(2025-2030 年)的复合年增长率为 6.05%。
开发行业正在加大这些材料的使用,以增强储能电极的强度,开发自清洁表面,并突破航太高温合金的性能极限。随着配方师以奈米氧化物抗菌剂取代有机除生物剂,以及与传统製程相比,绿色生物合成可降低30%的能耗和40%的生产成本,这些材料的需求也正在加速成长。随着全球工巨头向前体材料供应领域后向整合,以及规模较小的专业公司凭藉特定应用的颗粒设计开拓利基市场,竞争正在分化。亚太地区的製造规模,加上持续的公共研究资金,使其在试点部署和量产方面处于领先地位。
全球奈米金属氧化物市场趋势与洞察
奈米材料在航太高温合金的应用
航太计画正在采用氧化物弥散强化合金,这种合金在高达 500 度C 的温度下仍能提供稳定的机械性能,比传统铝系统提高了 40%。采用奈米级 L12 沉淀物强化的高熵镍合金在 -196°C 至 600°C 的温度下保持一致的抗拉强度,消除了高超音速飞机的温度敏感性瓶颈。由于采用了奈米氧化物填料,波音 787 和空中巴士 A350 平台上的复合机身部分已证明可减轻 20% 的重量,同时保持结构完整性。除了提高承载能力外,嵌入的奈米颗粒还提供电磁屏蔽,保护航空电子设备免受外部干扰。这些综合优势加快了资格认证週期,并促成了与一级供应商的采购合约。
个人护理配方中的抗菌需求
消费者对无防腐剂化妆品的偏好推动了人们对氧化锌奈米颗粒的兴趣,这种颗粒可实现90%的细菌生长抑制,且无细胞毒性。多功能二氧化钛颗粒同时提供紫外线防护和光激活杀灭病原体的功能,从而减少了每个配方的添加剂用量。氧化铜具有卓越的抗真菌活性,支持推出针对抗药性皮癣菌的高端护肤护肤。向金属基活性成分的快速转变缩短了成分列表,并支持洁净标示声明,尤其是在监管审批速度很快的亚太地区。随着品牌商重组其全球SKU组合,扩大化妆品级分散体供应的供应商将获得先发优势。
使用金属粉末对环境的影响
生命週期评估显示,化学和生物合成的奈米氧化物均可诱导水生物种的氧化压力和DNA损伤,促使监管机构进行严格审查。欧洲食品安全局和美国食品药物管理局(FDA)目前正在收紧消费品的暴露阈值,这提高了小型生产商的合规成本。回收通讯协定和闭合迴路污水系统正成为授权的先决条件,这增加了绿地计画的资本支出。因此,市场参与企业必须在创新与严格的环境控制之间取得平衡,才能获得市场准入。
細項分析
二氧化钛将在2024年占据奈米金属氧化物市场份额的33.28%,因为其光催化强度和介电稳定性确保了从自清洁建筑幕墙到高k晶体管等各种应用。由于利用植物萃取物获得具有相似带隙但碳足迹较低的生物相容性颗粒的绿色路线,该细分市场将继续扩张。氧化铈预计将以7.96%的复合年增长率超越其他同类材料,因为其Ce3+/Ce4+双态有利于半导体平面化所必需的CMP浆料。二氧化硅和氧化锌在阻隔膜和皮肤药膏中仍然可靠,而氧化铁奈米结构能够穿透净化系统,染料降解效率高达89%。
市场势头利好那些将颗粒工程与最终用途认证相结合的供应商。二氧化钛製造商利用食品接触和化妆品领域广泛的监管认可,而二氧化铈製造商则优先考虑晶圆级纯度。整合型企业共用前驱体网络,以降低物流成本并增强其在奈米金属氧化物市场的竞争地位。
预计到2024年,20-80奈米波段将占据46.25%的市场份额,复合年增长率达7.85%,领先其他波段。此波段兼顾了量子表面反应性和製程稳定性,使其易于在油墨和聚合物中分散,同时避免了20奈米以下颗粒常见的聚集现象。 20奈米以下的颗粒具有优异的触媒活性,但在过滤和防尘方面存在挑战,导致处理成本高。 80奈米以上的颗粒在光学和耐磨性方面发挥特殊作用,但对于大众市场应用而言,则处于中阶。溶胶-凝胶和水热反应器的进步如今已允许±5奈米的公差,使配方师能够确保批次间的一致性。
抓住这一最佳时机的公司正在关注其在光催化中调节带隙和预测涂层流变性的能力。持续的反应器优化与线上光谱技术相结合,有望提高产量,巩固20-80奈米窗口作为奈米金属氧化物市场主导地位。
区域分析
预计到2024年,亚太地区将占46.05%的市场份额,复合年增长率为8.01%,这得益于中国在全球硅负极材料市场67.8%的份额以及日本在先进材料专利领域21.5%的份额。垂直整合降低了成本,并加快了从试点到量产的过渡。自2001年以来,政府已投入超过300亿美元的资金,用于支持产学研联盟,以提高技术准备度和劳动力技能。
北美排名第二,受航太供应链的推动,该供应链需要氧化强化合金和先进的半导体。 American Elements 和 Evonik 等製造商已投资建造用于晶片製造的超高纯度胶质氧化硅工厂。
欧洲高度重视生态设计,严格的《欧盟化学品註册、评估、许可和限制》(REACH) 指令推动了绿色生物合成材料的早期应用,建筑维修也正在采用近红外线反射涂层来满足能源效率要求。南美洲和中东等新兴地区正在采用奈米氧化物建筑幕墙来打造气候适应型基础设施,随着当地法规的完善,其用量也逐渐增加。
其他福利:
- Excel 格式的市场预测 (ME) 表
- 3个月的分析师支持
目录
第一章 引言
- 研究假设和市场定义
- 调查范围
第二章调查方法
第三章执行摘要
第四章 市场状况
- 市场概况
- 市场驱动因素
- 奈米材料在航太高温合金的应用
- 个人护理配方中的抗菌需求
- 强化储能电极
- 油漆和涂料行业对奈米金属氧化物的需求不断增加
- 不断增加的3D列印製程技术
- 市场限制
- 使用金属粉末对环境的影响
- 前驱金属价格波动
- 製造成本高
- 价值链分析
- 五力分析
- 供应商的议价能力
- 买方的议价能力
- 新进入者的威胁
- 替代品的威胁
- 竞争程度
第五章市场规模及成长预测
- 依产品类型
- 氧化铝
- 二氧化硅
- 二氧化钛
- 氧化锌
- 氧化铁
- 其他产品类型(例如氧化铜)
- 按粒径
- 小于20奈米
- 20~80 nm
- 80奈米或更大
- 依合成方法
- 溶胶-凝胶
- 火焰喷雾热解
- 水热/热感
- 化学沉淀
- 绿色/生物合成
- 按最终用户产业
- 运输
- 电子产品
- 活力
- 建造
- 个人护理
- 卫生保健
- 其他最终用户产业(化学品、催化剂等)
- 按地区
- 亚太地区
- 中国
- 日本
- 印度
- 韩国
- 东南亚国协
- 其他亚太地区
- 北美洲
- 美国
- 加拿大
- 墨西哥
- 欧洲
- 德国
- 英国
- 法国
- 义大利
- 西班牙
- 俄罗斯
- 北欧国家
- 其他欧洲国家
- 南美洲
- 巴西
- 阿根廷
- 其他南美
- 中东和非洲
- 沙乌地阿拉伯
- 南非
- 其他中东和非洲地区
- 亚太地区
第六章 竞争态势
- 市场集中度
- 策略倡议
- 市占率(%)/排名分析
- 公司简介
- Advanced Nano Products Co., Ltd.
- American Elements
- Baikowski SA
- Cabot Corporation
- Cerion Nanomaterials
- Chengyin Technology
- Diamon-Fusion International Inc.
- Evonik Industries AG
- MATEXCEL
- Meliorum Technologies, Inc.
- Merck KGaA
- NaBond Technologies Co., Ltd.
- NanoComposix(Fortis Life Sciences)
- Nano-Oxides Inc.
- Nanophase Technologies Corporation
- Nanoshel LLC
- Nissan Chemical Corporation
- NYACOL Nano Technologies, Inc.
- Reinste Nano Ventures
- SkySpring Nanomaterials Inc.
- US Research Nanomaterials, Inc.
第七章 市场机会与未来展望
The Nano-Metal Oxides Market size is estimated at USD 7.98 billion in 2025, and is expected to reach USD 10.70 billion by 2030, at a CAGR of 6.05% during the forecast period (2025-2030), underpinned by the distinct surface area, reactivity and functional tunability that nanostructuring unlocks.
Industries are intensifying the use of these materials to enhance energy storage electrodes, develop self-cleaning surfaces and raise the performance ceiling of aerospace super-alloys. Demand also accelerates as formulators replace organic biocides with nano-oxide antimicrobial agents, while green bio-synthesis trims energy use by 30% and slashes production costs 40% relative to conventional routes. Competition is fragmenting as global chemical majors integrate backward into precursor supply and smaller specialists carve niches through application-specific particle design. Asia-Pacific's manufacturing scale, combined with sustained public research spending, secures the region's lead in pilot adoption and high-volume output.
Global Nano-Metal Oxides Market Trends and Insights
Nanomaterials Adoption in Aerospace Super-Alloys
Aerospace programmes are embedding oxide-dispersion-strengthened alloys that deliver stable mechanical properties up to 500 °C, a 40% improvement on legacy aluminum systems. High-entropy nickel alloys fortified with nanoscale L12 precipitates keep tensile strength constant from -196 °C to 600 °C, removing temperature-sensitivity roadblocks for hypersonic vehicles. Composite fuselage sections on Boeing 787 and Airbus A350 platforms already demonstrate 20% weight savings while preserving structural integrity through nano-oxide fillers. Beyond load-bearing gains, embedded nanoparticles offer electromagnetic shielding that safeguards avionics from external interference. These combined benefits accelerate qualification cycles and ignite procurement contracts across Tier-1 suppliers.
Anti-Microbial Demand in Personal Care Formulations
Consumer preference for preservative-free cosmetics is raising interest in zinc oxide nanoparticles that achieve 90% bacterial growth reduction without cytotoxicity. Multifunctional titanium dioxide particles deliver simultaneous UV protection and photo-activated pathogen kill, reducing additive loading per formulation. Copper oxide offers premium antifungal activity and supports luxury skin-care launches targeting resistant dermatophytes. The swift pivot toward metal-based actives shortens ingredient lists and supports clean-label claims, particularly in Asia-Pacific where regulatory clearance is rapid. Suppliers scaling cosmetic-grade dispersions gain first-mover advantage as brand owners re-formulate global SKU portfolios.
Environmental Implications of Using Metal Powder
Lifecycle assessments reveal that both chemically and bio-synthesised nano-oxides can induce oxidative stress and DNA damage in aquatic species, prompting regulatory scrutiny. The European Food Safety Authority and the FDA now enforce tighter exposure thresholds for consumer products, lifting compliance costs for smaller producers. Recycling protocols and closed-loop wastewater systems are becoming prerequisites for permits, adding capital expenditure to greenfield projects. Market entrants must therefore balance innovation with stringent environmental stewardship to gain market access.
Other drivers and restraints analyzed in the detailed report include:
- Energy Storage Electrode Enhancements
- Growing Demand from Paints and Coatings Industry
- Price Volatility of Precursor Metals
For complete list of drivers and restraints, kindly check the Table Of Contents.
Segment Analysis
Titanium oxide commanded 33.28% of the nano-metal oxides market share in 2024 as its photocatalytic strength and dielectric stability secured usage from self-cleaning facades to high-k transistors. Segment expansion continues as green routes employ plant extracts to yield biocompatible particles with similar band gaps yet lower carbon footprints. Cerium oxide is projected to outpace peers with a 7.96% CAGR as dual Ce3+/Ce4+ states drive CMP slurries vital for semiconductor planarisation. Silica and zinc oxide remain dependable for barrier films and dermatological creams, while iron oxide nanostructures penetrate remediation systems via 89% dye degradation efficiency.
Market momentum benefits suppliers that align particle engineering with end-use certification. Titanium dioxide makers capitalise on broad regulatory acceptance in food contact and cosmetics, whereas ceria suppliers focus on wafer-scale purity. Integrated firms leverage shared precursor networks to cut logistic costs, reinforcing competitive moats in this slice of the nano-metal oxides market.
The 20-80 nm band represented 46.25% in 2024 and is forecast to lead with a 7.85% CAGR. The interval balances quantum surface reactivity and process stability, offering easy dispersion in inks and polymers while avoiding the agglomeration typical below 20 nm. Sub-20 nm particles deliver superior catalytic rates but raise filtration and dust-safety issues that lift handling costs. Sizes above 80 nm serve niche optical or abrasion-resistant roles yet cede mass-market volumes to the mid-range. Advances in sol-gel and hydrothermal reactors now hold +-5 nm tolerances, giving formulators confidence in batch-to-batch consistency.
Adopters value this sweet spot for tunable band gaps in photocatalysts and predictable rheology in paints. Continued reactor optimisation coupled with inline spectroscopy promises to lift throughput, cementing the 20-80 nm window as the workhorse segment of the nano-metal oxides market.
The Nano-Metal Oxides Market Report is Segmented by Product Type (Alumina, Silica, and More), Particle Size (Less Than 20 Nm, 20-80 Nm, and More), Synthesis Method (Sol-Gel, Flame Spray Pyrolysis, and More), End-User Industry (Transportation, Electronics, and More), and Geography (Asia-Pacific, North America, Europe, South America, Middle East and Africa). The Market Forecasts are Provided in Terms of Value (USD).
Geography Analysis
Asia-Pacific captured 46.05% share in 2024 and is projected to record an 8.01% CAGR, anchored by China's 67.8% share of global silicon-anode materials and Japan's 21.5% cut of advanced material patents. Vertical integration compresses costs and quickens pilot-to-mass-production transitions. Government funding exceeding USD 30 billion since 2001 finances university-industry consortia that raise technology readiness and workforce skills.
North America ranks second, supported by aerospace supply chains that require oxide-strengthened alloys and advanced semiconductors. Producers such as American Elements and Evonik invested in ultra-high-purity colloidal silica plants to serve chip fabs.
Europe emphasises eco-design. Strict REACH directives motivate early adoption of green bio-synthesis, and construction retrofits absorb NIR-reflective coatings to meet energy-efficiency mandates. Emerging regions like South America and the Middle East tap nano-oxide facades for climate-resilient infrastructure, gradually lifting their consumption as local regulations mature.
- Advanced Nano Products Co., Ltd.
- American Elements
- Baikowski SA
- Cabot Corporation
- Cerion Nanomaterials
- Chengyin Technology
- Diamon-Fusion International Inc.
- Evonik Industries AG
- MATEXCEL
- Meliorum Technologies, Inc.
- Merck KGaA
- NaBond Technologies Co., Ltd.
- NanoComposix (Fortis Life Sciences)
- Nano-Oxides Inc.
- Nanophase Technologies Corporation
- Nanoshel LLC
- Nissan Chemical Corporation
- NYACOL Nano Technologies, Inc.
- Reinste Nano Ventures
- SkySpring Nanomaterials Inc.
- US Research Nanomaterials, Inc.
Additional Benefits:
- The market estimate (ME) sheet in Excel format
- 3 months of analyst support
TABLE OF CONTENTS
1 Introduction
- 1.1 Study Assumptions and Market Definition
- 1.2 Scope of the Study
2 Research Methodology
3 Executive Summary
4 Market Landscape
- 4.1 Market Overview
- 4.2 Market Drivers
- 4.2.1 Nanomaterials adoption in aerospace super-alloys
- 4.2.2 Anti-microbial demand in personal care formulations
- 4.2.3 Energy storage electrode enhancements
- 4.2.4 Growing demand for nano metal oxides from paints and coatings industry
- 4.2.5 Increasing technology of 3D-printing Process
- 4.3 Market Restraints
- 4.3.1 Environmental Implications of Using Metal Powder
- 4.3.2 Price volatility of precursor metals
- 4.3.3 High Production Costs
- 4.4 Value Chain Analysis
- 4.5 Porter's Five Forces
- 4.5.1 Bargaining Power of Suppliers
- 4.5.2 Bargaining Power of Buyers
- 4.5.3 Threat of New Entrants
- 4.5.4 Threat of Substitutes
- 4.5.5 Degree of Competition
5 Market Size and Growth Forecasts (Value)
- 5.1 By Product Type
- 5.1.1 Alumina
- 5.1.2 Silica
- 5.1.3 Titanium Oxide
- 5.1.4 Zinc Oxide
- 5.1.5 Iron Oxide
- 5.1.6 Other Product Types (Copper Oxide, etc.)
- 5.2 By Particle Size
- 5.2.1 Less than 20 nm
- 5.2.2 20 - 80 nm
- 5.2.3 Greater than 80 nm
- 5.3 By Synthesis Method
- 5.3.1 Sol-gel
- 5.3.2 Flame Spray Pyrolysis
- 5.3.3 Hydrothermal/ Solvothermal
- 5.3.4 Chemical Vapor Deposition
- 5.3.5 Green/ Bio-synthesis
- 5.4 By End-user Industry
- 5.4.1 Transportation
- 5.4.2 Electronics
- 5.4.3 Energy
- 5.4.4 Construction
- 5.4.5 Personal Care
- 5.4.6 Healthcare
- 5.4.7 Other End-user Industries (Chemicals and Catalysts, etc.)
- 5.5 By Geography
- 5.5.1 Asia-Pacific
- 5.5.1.1 China
- 5.5.1.2 Japan
- 5.5.1.3 India
- 5.5.1.4 South Korea
- 5.5.1.5 ASEAN Countries
- 5.5.1.6 Rest of Asia-Pacific
- 5.5.2 North America
- 5.5.2.1 United States
- 5.5.2.2 Canada
- 5.5.2.3 Mexico
- 5.5.3 Europe
- 5.5.3.1 Germany
- 5.5.3.2 United Kingdom
- 5.5.3.3 France
- 5.5.3.4 Italy
- 5.5.3.5 Spain
- 5.5.3.6 Russia
- 5.5.3.7 NORDIC Countries
- 5.5.3.8 Rest of Europe
- 5.5.4 South America
- 5.5.4.1 Brazil
- 5.5.4.2 Argentina
- 5.5.4.3 Rest of South America
- 5.5.5 Middle East and Africa
- 5.5.5.1 Saudi Arabia
- 5.5.5.2 South Africa
- 5.5.5.3 Rest of Middle East and Africa
- 5.5.1 Asia-Pacific
6 Competitive Landscape
- 6.1 Market Concentration
- 6.2 Strategic Moves
- 6.3 Market Share(%)/Ranking Analysis
- 6.4 Company Profiles {(includes Global level Overview, Market level overview, Core Segments, Financials as available, Strategic Information, Market Rank/Share for key companies, Products and Services, and Recent Developments)}
- 6.4.1 Advanced Nano Products Co., Ltd.
- 6.4.2 American Elements
- 6.4.3 Baikowski SA
- 6.4.4 Cabot Corporation
- 6.4.5 Cerion Nanomaterials
- 6.4.6 Chengyin Technology
- 6.4.7 Diamon-Fusion International Inc.
- 6.4.8 Evonik Industries AG
- 6.4.9 MATEXCEL
- 6.4.10 Meliorum Technologies, Inc.
- 6.4.11 Merck KGaA
- 6.4.12 NaBond Technologies Co., Ltd.
- 6.4.13 NanoComposix (Fortis Life Sciences)
- 6.4.14 Nano-Oxides Inc.
- 6.4.15 Nanophase Technologies Corporation
- 6.4.16 Nanoshel LLC
- 6.4.17 Nissan Chemical Corporation
- 6.4.18 NYACOL Nano Technologies, Inc.
- 6.4.19 Reinste Nano Ventures
- 6.4.20 SkySpring Nanomaterials Inc.
- 6.4.21 US Research Nanomaterials, Inc.
7 Market Opportunities and Future Outlook
- 7.1 White-space and Unmet-Need Assessment
