


 |
市场调查报告书
商品编码
1844692
燃料电池商用车:市场份额分析、行业趋势、统计数据和成长预测(2025-2030 年)Fuel Cell Commercial Vehicle - Market Share Analysis, Industry Trends & Statistics, Growth Forecasts (2025 - 2030) |
||||||
※ 本网页内容可能与最新版本有所差异。详细情况请与我们联繫。
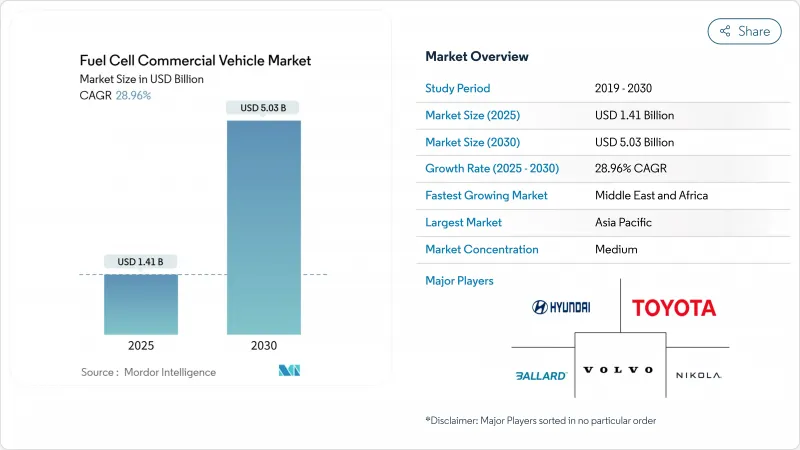
预计2025年燃料电池商用车市场规模将达14.1亿美元,2030年将达50.3亿美元,复合年增长率为28.96%。
严格的法规环境、快速下降的可再生氢气成本以及不断增长的企业净零货运承诺,正在推动销售量逐年增长。技术进步推动燃料电池系统成本目标在2025年达到80美元/千瓦,帮助大型车队突破400公里以上路线的总拥有成本门槛。以鹿特丹和洛杉矶为中心的区域氢能走廊正在消除早期的基础设施问题,而港务局也正在设定零排放货运的坚定目标。这些因素正在激励原始设备製造商扩大生产规模,降低单位成本,并推出用于远距物流和城市公车的商业模式。
全球燃料电池商用车市场趋势与洞察
商用车排放法规严格
欧盟的「Fit-for-55」方案要求重型车辆的排放气体到2040年减少90%,中期目标是到2030年减少45%,到2035年减少65%。为了控制交通运输业的排放,修订后的二氧化碳标准现在涵盖了更广泛的重型车辆(HDV)。修订后的法规还将巴士、长途客车、拖车和商用卡车纳入其中,这些车辆占重型车辆销售的90%以上。原始设备製造商正在加速其燃料电池项目,以满足严格的标准,尤其是在电池容量和充电停止时间仍然具有挑战性的远距营运中。
北美城市公车零排放规定
加州创新的清洁交通法规要求交通业者到2040年过渡到100%零排放车队。购买的车辆必须已达到25%的零排放水平,到2026年达到50%。 15亿美元的联邦补贴将在2024年增加约600辆公车,这意味着全尺寸燃料电池电动公车的部署量将比前一年增加55%。纯电动车需要双电池组,这会牺牲座位容量。业者也报告称,不受温度影响的加油方式简化了寒冷北方地区的调度计画。
燃料电池在重载循环中的耐久性问题
儘管近年来技术取得了进步,但重型应用的燃料电池系统仍存在严重的耐久性问题。重型卡车需要至少能运作25,000小时的系统。百万英里燃料电池卡车联盟的目标是到2030年将系统寿命提高到30,000小时。加州大学洛杉矶分校(UCLA)在2025年宣布的实验室测试中,燃料电池系统将达到超过200,000小时的突破性水平,这缓解了人们对其寿命的担忧,但商业规模的检验仍在进行中。这些技术尚未实现大规模商业化并整合到量产车中。
細項分析
2024年,公车占据了燃料电池商用车市场份额的45.76%,因为交通运输机构利用专门的资金框架来替换老化的柴油车队。 Solaris占据了欧洲燃料电池公车註册量的65%,这反映了该OEM厂商对基于停车场营运的重视。橘郡交通管理局订购的40辆FCEB等订单证实了该细分市场的强劲成长势头。这一成长动能得益于可预测的路线和回车段加油、350巴压缩气体系统的适配以及简化维修团队日常工作的功能。将车辆和加油合约捆绑在一起的采购框架进一步提高了公共机构买家的预算确定性。
预计2025年至2030年,卡车的复合年增长率将达31.10%,超过公车,推动燃料电池商用车市场向货运物流方向发展。尼古拉500英里TRE FCEV和现代XCIENT Class 8平台定位于枢纽到枢纽物流,充分利用20分钟加氢时间和比纯电动车更高的有效载荷余量。企业货运伙伴关係提供接管担保,帮助银行承保新的加氢站。稳定的绿色氢能供应预计将使400-600公里线路的总成本持平,从而实现北欧和中欧货运走廊的全国性部署。
质子交换膜燃料电池 (PEMFC) 技术以其快速启动和承受频繁负载变化的能力而闻名,到 2024 年,将占据燃料电池商用车市场的 81.25%。每堆铂金负载持续下降,在满足城市公车工作週期的同时缩小了成本差距。在加州进行的车队测试表明,PEMFC 公车的使用寿命超过 20,000 小时,性能劣化低于 10%,增强了操作员对多班次运作的信心。
预计到2030年,固体氧化物燃料电池 (SOFC) 的复合年增长率将达到31.25%。其电效率接近60%,并且能够承受低纯度氢气,支援远距运输和辅助电力整合场景。材料科学的进步已将工作温度降低至700°C,从而实现更快的加热速度和更小的温度控管组件。减少对铂族金属的依赖预计将大幅降低电堆成本,一旦使用寿命达到3万小时,SOFC有望广泛应用。
区域分析
2024年,亚太地区将以41.62%的市场份额引领燃料电池商用车市场,这得益于中国每年12.5万吨的绿色氢能产能和大规模的零件製造。电解槽生产的成本优势和国产化,打造了涵盖电堆、电力电子设备和储槽的区域化价值链。日本和韩国凭藉长期的研发项目和早期的OEM生产线,巩固了其区域主导地位。
欧洲正采取具有约束力的二氧化碳减排措施,力争2030年将重型车辆排放减少45%,到2040年减少90%。截至2024年5月,加氢站数量已达187座,註册的燃料电池公车数量同期增加了82%。像H2Accelerate这样的跨国计划旨在2030年建成150座加氢站,连接斯堪地那维亚半岛和义大利北部。
北美正受益于联邦奖励和各州强制要求:加州的 ARCHES 中心获得了 12 亿美元的支持,目标是到 2045 年每天供应 45,000 吨氢气。美国能源局希望在 2030 年 30% 的新中型和重型汽车销售实现零排放,推动太平洋西北部、墨西哥湾沿岸和五大湖地区的卡车 OEM 试点车队。
预计到2030年,中东和非洲地区的复合年增长率将达到29.05%,这得益于丰富的太阳能和风能资源以及现有的天然气管道网路。沙乌地阿拉伯和阿联酋正在建造连接港口和内陆物流中心的试点卡车走廊,旨在实现货运业的脱碳,该产业的排放的四分之一。
其他福利:
- Excel 格式的市场预测 (ME) 表
- 3个月的分析师支持
目录
第一章 引言
- 研究假设和市场定义
- 调查范围
第二章调查方法
第三章执行摘要
第四章 市场状况
- 市场概况
- 市场驱动因素
- 商用车排放法规严格
- 北美城市公车零排放规定
- 中国利用可再生电解降低氢气生产成本
- 净零货运企业联盟加速OEM采购承诺
- 北欧400公里以上远距卡车的TCO持平
- 以港口为中心的氢能走廊促进早期采用
- 市场限制
- 加氢站基础建设成本高
- 新兴市场绿氢能供应采用缓慢
- 对燃料电池在重度循环中的耐久性的担忧
- 在短途运输中与电动卡车竞争
- 价值/供应链分析
- 监管和技术展望
- 五力分析
- 供应商的议价能力
- 买家/消费者的议价能力
- 新进入者的威胁
- 替代品的威胁
- 竞争对手之间的竞争强度
第五章市场规模及成长预测
- 按车辆类型
- 公车
- 追踪
- 货车
- 其他车辆类型(皮卡车等)
- 依燃料电池类型
- 固体电解质燃料电池(PEMFC)
- 磷酸燃料电池(PAFC)
- 固体氧化物燃料电池(SOFC)
- 其他的
- 按输出范围
- 小于100千瓦
- 100 kW-200 kW
- 200度或以上
- 按里程
- 少于400公里
- 400 km-600 km
- 超过600公里
- 按最终用户
- 公共运输
- 远距货运和物流
- 最后一哩配送
- 市政当局和公共产业
- 其他用途
- 按地区
- 北美洲
- 美国
- 加拿大
- 北美其他地区
- 欧洲
- 德国
- 英国
- 法国
- 义大利
- 其他欧洲国家
- 亚太地区
- 中国
- 印度
- 日本
- 韩国
- 其他亚太地区
- 南美洲
- 巴西
- 阿根廷
- 其他南美
- 中东和非洲
- 阿拉伯聯合大公国
- 南非
- 沙乌地阿拉伯
- 其他中东和非洲地区
- 北美洲
第六章 竞争态势
- 市场集中度
- 策略倡议
- 市占率分析
- 公司简介
- Hyundai Motor Company
- Toyota Motor Corporation
- Ballard Power Systems
- Volvo Group(cellcentric JV)
- Nikola Corporation
- PACCAR Inc.
- Mercedes-Benz Group AG
- Honda Motor Co.
- SAIC Motor Corporation
- Foton Motor Group
- Tata Motors Limited
- Solaris Bus & Coach sp. z oo
- Plug Power Inc.
- Hyzon Motors Inc.
- Cummins Inc.
- Wrightbus Ltd.
- Zhejiang Geely Holding Group
- Dongfeng Motor Corporation
- Xiamen King Long Motor Group
- Gaussin SA
第七章 市场机会与未来展望
The hydrogen fuel cell commercial vehicle market is valued at USD 1.41 billion in 2025 and is projected to reach USD 5.03 billion by 2030, translating into a 28.96% CAGR.
A tight regulatory climate, the rapid fall in renewable-based hydrogen costs, and a widening corporate net-zero freight commitments push sales volumes higher yearly. Technology gains notably a fuel-cell system cost target of USD 80/kW by 2025, helping large fleets cross total-cost-of-ownership thresholds on routes over 400 km. Regional hydrogen corridors anchored around Rotterdam and Los Angeles remove early-stage infrastructure anxiety while port authorities set firm zero-emission freight targets. These forces encourage OEMs to scale production, lower per-unit costs, and launch commercial models for long-haul logistics, not just urban buses.
Global Fuel Cell Commercial Vehicle Market Trends and Insights
Stringent Emission Regulations for Commercial Vehicles
The EU "Fit-for-55" package requires a 90% emissions cut from heavy-duty vehicles by 2040, with interim targets of 45% by 2030 and 65% by 2035. To curb emissions from the transportation sector, revised CO2 standards now encompass a broader spectrum of heavy-duty vehicles (HDVs). The updated regulations now include buses, coaches, trailers, and vocational trucks, collectively accounting for over 90% of HDV sales. OEMs are accelerating fuel-cell programs to meet the tougher standards, particularly for long-haul operations where battery mass and charging downtime remain challenging.
Zero-Emission Mandates for Urban Bus Fleets in North America
California's Innovative Clean Transit Regulation compels transit operators to transition to 100% zero-emission fleets by 2040. Purchases must already be 25% zero-emission, reaching 50% by 2026. Federal grants of USD 1.5 billion in 2024 funded roughly 600 additional buses, and full-size fuel-cell electric bus deployments grew 55% year-over-year. Agencies prefer fuel-cell platforms for blocks above 250 km, requiring dual battery packs if executed with pure BEVs, compromising seating capacity. Operators also report that ambient-temperature-insensitive refuelling simplifies service planning in cold northern climates.
Fuel-Cell Durability Concerns in Heavy-Duty Cycles
Despite recent technological advances, fuel cell systems for heavy-duty applications still grapple with significant durability concerns. Heavy trucks require systems capable of at least 25,000 operating hours. The Million Mile Fuel Cell Truck Consortium targets 30,000 hours by 2030. UCLA's 2025 breakthrough of more than 200,000 hours in lab tests addresses lifetime anxiety but is still moving toward scaled commercial validation. These technologies have yet to be widely commercialized and integrated into production vehicles.
Other drivers and restraints analyzed in the detailed report include:
- Corporate Net-Zero Freight Alliances Accelerating OEM Purchase Commitments
- Port-Centric Hydrogen Corridors Spurring Early Adoption
- Competition from Battery-Electric Trucks in Short-Haul
For complete list of drivers and restraints, kindly check the Table Of Contents.
Segment Analysis
Buses held 45.76% of the hydrogen fuel cell commercial vehicle market share in 2024 as transit agencies tapped dedicated funding lines to replace aging diesel fleets. Solaris captured 65% of European fuel-cell bus registrations, reflecting OEM specialization in depot-based operations. Orders such as Orange County Transportation Authority's 40 FCEBs underscore the segment's traction. Momentum benefits from predictable routes and return-to-depot refueling, traits that fit 350-bar compressed-gas systems and simplify daily operations for maintenance teams. Procurement frameworks that bundle vehicles with fueling contracts further improve budget certainty for public-sector buyers.
Trucks are forecast to outpace buses with a 31.10% CAGR from 2025 to 2030, moving the hydrogen fuel cell commercial vehicle market toward freight logistics. Nikola's 500-mile TRE FCEV and Hyundai's XCIENT class-8 platform are positioned for hub-to-hub logistics, exploiting 20-minute refueling and higher payload headroom over BEVs. Corporate freight alliances provide offtake guarantees that help banks underwrite new refueling stations. As green hydrogen supply stabilizes, total-cost parity on 400-600 km lanes is expected to unlock nationwide rollouts across Nordic and Central European freight corridors.
PEMFC technology commanded 81.25% of the hydrogen fuel cell commercial vehicle market in 2024, valued for its rapid start-up and tolerance to frequent load changes. Platinum loading per stack continues to fall, closing cost gaps while meeting city-bus duty cycles. Fleet trials in California show PEMFC buses exceeding 20,000 hours with degradation under 10%, reinforcing operator confidence in multi-shift service.
Solid Oxide Fuel Cell (SOFC) is expected to grow at a 31.25% CAGR through 2030. Electrical efficiency up to 60%, combined with tolerance for lower-purity hydrogen, supports long-haul and auxiliary-power integration scenarios. Material science progress has trimmed operating temperatures to 700 °C, allowing quicker heat-up and smaller thermal-management components. Reduced reliance on platinum-group metals promises lower stack costs at scale, setting the stage for expanded adoption once durability reaches 30,000 hours.
The Fuel Cell Commercial Vehicle Market Report is Segmented by Vehicle Type(Buses and More), Fuel Cell (Proton Exchange Membrane Fuel Cell and More), Power Range (Below 100 KW and More), Driving Range (Below 400km and More), End-Use (Public Transit Fleets and More), and Geography. The Market Forecasts are Provided in Terms of Value (USD).
Geography Analysis
Asia-Pacific region led the hydrogen fuel cell commercial vehicle market with a 41.62% share in 2024, underpinned by China's 125,000 tpa green-hydrogen capacity and large-scale component manufacturing. Cost advantages in electrolyser production and domestic procurement quotas have built a localised value chain spanning stacks, power electronics, and tanks. Japan and South Korea reinforce the region's edge with long-running R&D programs and early OEM production lines.
Europe follows closely, driven by binding CO2 cuts that require 45% lower heavy-duty emissions by 2030 and 90% by 2040. Refueling coverage reached 187 stations by May 2024, and fuel-cell bus registrations rose 82% during the same period. Cross-border projects, such as the H2Accelerate collaboration, aim to link Scandinavia to Northern Italy with 150 stations by 2030.
North America benefits from a blend of federal incentives and state mandates. California's ARCHES hub, backed by USD 1.2 billion, targets 45,000 tons/day of hydrogen by 2045. The U.S. Department of Energy wants 30% of new medium- and heavy-duty sales to be zero-emission by 2030, propelling truck OEM pilot fleets across the Pacific Northwest, the Gulf Coast, and the Great Lakes.
The Middle East and Africa region is expected to be the forecast to grow at 29.05% CAGR to 2030, is building on abundant solar and wind resources plus existing gas pipeline networks. Saudi Arabia and the UAE are constructing pilot truck corridors linking ports with inland distribution centers, aiming to decarbonize a freight sector that accounts for a quarter of regional emissions.
- Hyundai Motor Company
- Toyota Motor Corporation
- Ballard Power Systems
- Volvo Group (cellcentric JV)
- Nikola Corporation
- PACCAR Inc.
- Mercedes-Benz Group AG
- Honda Motor Co.
- SAIC Motor Corporation
- Foton Motor Group
- Tata Motors Limited
- Solaris Bus & Coach sp. z o.o.
- Plug Power Inc.
- Hyzon Motors Inc.
- Cummins Inc.
- Wrightbus Ltd.
- Zhejiang Geely Holding Group
- Dongfeng Motor Corporation
- Xiamen King Long Motor Group
- Gaussin S.A.
Additional Benefits:
- The market estimate (ME) sheet in Excel format
- 3 months of analyst support
TABLE OF CONTENTS
1 Introduction
- 1.1 Study Assumptions & Market Definition
- 1.2 Scope of the Study
2 Research Methodology
3 Executive Summary
4 Market Landscape
- 4.1 Market Overview
- 4.2 Market Drivers
- 4.2.1 Stringent Emission Regulations for Commercial Vehicles
- 4.2.2 Zero-Emission Mandates for Urban Bus Fleets in North America
- 4.2.3 Hydrogen Production Cost Declines from Renewable Electrolysis in China
- 4.2.4 Corporate Net-Zero Freight Alliances Accelerating OEM Purchase Commitments
- 4.2.5 TCO Parity for Long-Haul Trucks Above 400 km in Nordics
- 4.2.6 Port-Centric Hydrogen Corridors Spurring Early Adoption
- 4.3 Market Restraints
- 4.3.1 High Infrastructure Costs for Hydrogen Refuelling Stations
- 4.3.2 Slow Roll-out of Green Hydrogen Supply in Emerging Markets
- 4.3.3 Fuel-Cell Durability Concerns in Heavy-Duty Cycles
- 4.3.4 Competition from Battery-Electric Trucks in Short-Haul
- 4.4 Value / Supply-Chain Analysis
- 4.5 Regulatory & Technological Outlook
- 4.6 Porter's Five Forces
- 4.6.1 Bargaining Power of Suppliers
- 4.6.2 Bargaining Power of Buyers / Consumers
- 4.6.3 Threat of New Entrants
- 4.6.4 Threat of Substitute Products
- 4.6.5 Intensity of Competitive Rivalry
5 Market Size & Growth Forecasts (Value (USD))
- 5.1 By Vehicle Type
- 5.1.1 Buses
- 5.1.2 Trucks
- 5.1.3 Vans
- 5.1.4 Other Vehicle Types (Pickup Trucks, etc.)
- 5.2 By Fuel Cell Type
- 5.2.1 Proton Exchange Membrane Fuel Cell (PEMFC)
- 5.2.2 Phosphoric Acid Fuel Cell (PAFC)
- 5.2.3 Solid Oxide Fuel Cell (SOFC)
- 5.2.4 Others
- 5.3 By Power Range
- 5.3.1 Below 100 kW
- 5.3.2 100 kW - 200 kW
- 5.3.3 Above 200 kW
- 5.4 By Driving Range
- 5.4.1 Below 400 km
- 5.4.2 400 km - 600 km
- 5.4.3 Above 600 km
- 5.5 By End-User
- 5.5.1 Public Transit Fleets
- 5.5.2 Long-Haul Freight & Logistics
- 5.5.3 Last-Mile Delivery
- 5.5.4 Municipal & Utility Services
- 5.5.5 Other Applications
- 5.6 By Geography
- 5.6.1 North America
- 5.6.1.1 United States
- 5.6.1.2 Canada
- 5.6.1.3 Rest of North America
- 5.6.2 Europe
- 5.6.2.1 Germany
- 5.6.2.2 United Kingdom
- 5.6.2.3 France
- 5.6.2.4 Italy
- 5.6.2.5 Rest of Europe
- 5.6.3 Asia-Pacific
- 5.6.3.1 China
- 5.6.3.2 India
- 5.6.3.3 Japan
- 5.6.3.4 South Korea
- 5.6.3.5 Rest of Asia-Pacific
- 5.6.4 South America
- 5.6.4.1 Brazil
- 5.6.4.2 Argentina
- 5.6.4.3 Rest of South America
- 5.6.5 Middle East and Africa
- 5.6.5.1 United Arab Emirates
- 5.6.5.2 South Africa
- 5.6.5.3 Saudi Arabia
- 5.6.5.4 Rest of Middle East and Africa
- 5.6.1 North America
6 Competitive Landscape
- 6.1 Market Concentration
- 6.2 Strategic Moves
- 6.3 Market Share Analysis
- 6.4 Company Profiles (includes Global-level Overview, Market-level Overview, Core Segments, Financials as available, Strategic Information, Market Rank/Share, Products & Services, Recent Developments)
- 6.4.1 Hyundai Motor Company
- 6.4.2 Toyota Motor Corporation
- 6.4.3 Ballard Power Systems
- 6.4.4 Volvo Group (cellcentric JV)
- 6.4.5 Nikola Corporation
- 6.4.6 PACCAR Inc.
- 6.4.7 Mercedes-Benz Group AG
- 6.4.8 Honda Motor Co.
- 6.4.9 SAIC Motor Corporation
- 6.4.10 Foton Motor Group
- 6.4.11 Tata Motors Limited
- 6.4.12 Solaris Bus & Coach sp. z o.o.
- 6.4.13 Plug Power Inc.
- 6.4.14 Hyzon Motors Inc.
- 6.4.15 Cummins Inc.
- 6.4.16 Wrightbus Ltd.
- 6.4.17 Zhejiang Geely Holding Group
- 6.4.18 Dongfeng Motor Corporation
- 6.4.19 Xiamen King Long Motor Group
- 6.4.20 Gaussin S.A.
7 Market Opportunities & Future Outlook
 氢燃料电池汽车市场:按燃料电池类型、功率输出、应用、车辆类型和最终用户划分-2025-2032年全球预测汽车燃料电池市场(按燃料电池类型、功率输出、应用、最终用途和销售管道)——2025-2032 年全球预测燃料电池汽车市场:按最终用户、车辆类型、燃料电池类型、功率输出和应用划分 - 全球预测 2025-2032
 氢动力卡车市场 - 全球及区域分析:按氢气罐类型、车辆类型、燃料电池技术、应用和区域 - 分析与预测(2025-2034 年)
 2025年全球氢动力卡车市场
 全球氢内燃机市场氢动力卡车的全球市场
 2025年氢燃料电池汽车全球市场报告2025年燃料电池汽车全球市场报告2025年燃料电池电动汽车全球市场报告