


 |
市场调查报告书
商品编码
1844698
扩增实境和混合实境:市场份额分析、行业趋势、统计数据和成长预测(2025-2030)Augmented Reality And Mixed Reality - Market Share Analysis, Industry Trends & Statistics, Growth Forecasts (2025 - 2030) |
||||||
※ 本网页内容可能与最新版本有所差异。详细情况请与我们联繫。
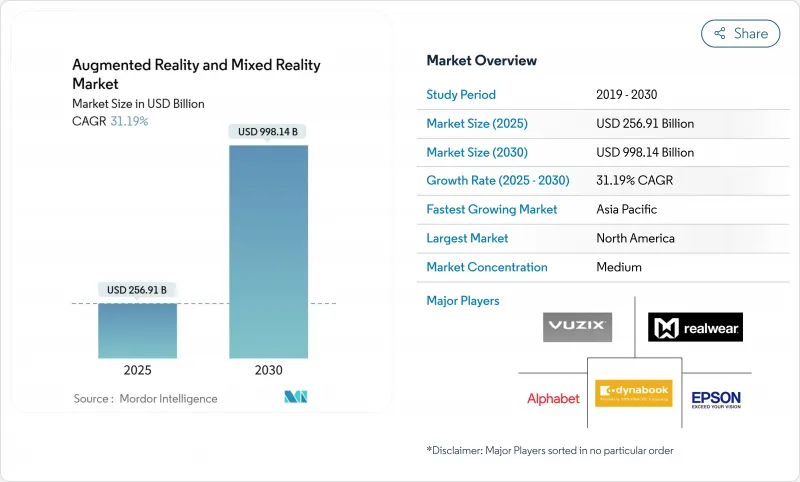
扩增实境和混合实境市场预计在 2025 年价值 2,569.1 亿美元,预计到 2030 年将达到 9,981.4 亿美元,预测期内(2025-2030 年)的复合年增长率为 31.19%。
5G 网路的商用部署、持续的企业数位转型预算以及微 OLED 和波导管显示器成本的快速下降,正在将空间运算试点转化为大规模部署。例如,玛氏宠物护理公司将 RealWear HMT-1 穿戴式装置与 Microsoft Teams 结合,将教练差旅成本降低了 35%。 Meta 弥补了 Reality Labs 多年的亏损,苹果将 Vision Pro 定位于高阶空间运算领域,三星与Google和高通的合作则在 2025 年 Android XR 推出之前增强了其竞争地位。扩增实境和混合实境市场目前正处于硬体创新、人工智慧驱动的 3D 内容管道以及推动经常性收益模式的託管服务成长的十字路口。
全球扩增实境和混合实境市场趋势和洞察
5G 和边缘运算低延迟体验
通讯业者目前正在支援云端渲染视觉效果,提供低于 20 毫秒的延迟、更轻的头戴装置和更长的电池续航力。边缘卸载技术使轻量眼镜能够处理功能丰富的内容,而不会出现热过载。高通的分散式运算专利使设备能够在本地和远端处理之间无缝切换,并根据网路状况调整功耗需求。多人混合实境游戏现在要求每位玩家高达 50 Mbps 的通讯,这推动了向 AR 特定服务层级的转变。时间敏感的工业任务(例如远端设备重置)受益于近乎即时的全像导航,从而为企业与网路供应商签订新的合约创造了条件。
游戏和零售领域以行动优先的 AR 应用
智慧型手机上的扩增实境 (AR) 降低了进入门槛,Pokemon GO 的累积收益超过 80 亿美元就是明证。丝芙兰的脸部辨识虚拟艺术家提高了购物车转换率,同时降低了退货率。宜家的“Place”应用程式允许购物者评估家具在实际房间中的合适度,从而减少了因尺寸相关的退货。谷歌将 AR 美妆试穿功能扩展到行动浏览器,使超过 50 个品牌的互动率提升了 10%。行动管道可以提升用户熟悉度,随后过渡到头戴式耳机的普及,并强化了扩增实境和混合实境市场从手机到穿戴式装置的转换管道。
商用HMD 的初始成本高
高昂的价格限制了其大规模应用。 Apple Vision Pro 售价超过 3,000 美元,迫使企业只能试用。SONY降低了 PlayStation VR2 的价格,但由于库存过剩凸显了成本敏感性,该公司暂停了生产。 HTC 瞄准的是利基企业用户群,并透过投资回报率分析证明了其 999 美元 Vive Focus Vision 的合理性。 Meta 的 Reality Labs 的累积亏损表明,该公司难以将技术雄心与价格实惠的消费级产品相结合。供应商专注于光学和系统级晶片 (SoC) 的规模经济,以突破关键的定价门槛,从而开拓更广阔的潜在市场。
細項分析
高阶头戴装置和光学元件仍然是资本密集产品,到2024年,硬体将占总收入的61%。就以金额为准,扩增实境和混合实境硬体市场规模接近1,560亿美元,这反映了企业在Vision Pro、Quest Pro和HoloLens上的持续支出。同时,服务业的复合年增长率最高,达到32.5%,这反映了向订阅式支援、内容创作和设备管理服务的转变。
託管服务的成长反映了云端软体的发展轨迹。 ArborXR 提供多品牌 VR 装置管理订阅服务,降低了大规模部署的 IT 复杂性。系统整合正在将内容库、分析和随叫随到的故障排除服务捆绑到可预测的营运成本中,将成本讨论从硬体支出转向整体解决方案的回报。随着微型 OLED 成本的下降,硬体收益可能会相应稀释,但服务收入将实现复合成长,扩增实境(AR) 和混合实境(MR) 市场很可能将保持经常性收益基础。
到2024年,独立式头戴装置将占扩增扩增实境实境和混合实境境设备市场规模的一半。然而,随着波导管的小型化,智慧眼镜的重量将与日常眼镜产品的重量相近,其复合年增长率将达到33%。像Meta Orion这样的行业原型产品正达到临界点,实现了70度的视场角,同时重量控制在85克以下,适合全天佩戴。
三星-谷歌的 Project Moohan 将透明显示器与 Gemini AI 融合,强调外形规格讯息而非完全沉浸式体验。消费者倾向于在社交场合佩戴更轻巧的眼镜,而企业则青睐将安全头盔与眼动追踪工作流程相结合的眼镜。随着供应链趋于稳定,眼镜将成为主流,再形成扩增实境和混合实境市场的开发者优先事项和行销叙事。
扩增实境和混合实境市场报告按组件(硬体、软体、服务)、设备类型(独立头戴式显示器 [HMD]、系留/主机连结 HMD 等)、最终用户行业(游戏和娱乐、医疗保健、教育和培训、零售和电子商务等)、应用(远端协作和协助、设计和视觉化等)和地区进行细分。
区域分析
北美继续提供大部分平台软体和创业投资。儘管宏观经济不确定性,但物流、现场服务和医疗保健领域的早期部署已获得投资回报,并已获得复购订单。出口管制和智慧财产权保护的法规日趋明确,鼓励海外公司在硅谷和西雅图建立研发中心。然而,随着首波采用者的成熟以及采购转向更换,销售成长正在放缓。
亚太地区的扩张速度超过全球平均。有利于创新的产业政策和集中式显示器製造正在缩短新型光学元件的上市时间。韩国和日本的电信业者正在将基于5G的XR合约收益,并提升消费者认知度。新兴企业正在享受政府补贴,最高可达50%的测试成本,加速了公司的概念验证。中产阶级消费者可支配收入的增加进一步推动了AR购物和游戏的普及。
在欧洲,机会与谨慎之间需要平衡。工业企业正在利用扩增实境技术在现有的自动化架构中进行预测性维护,医疗保健系统正在试点将视觉化技术应用于远端手术。然而,GDPR主导的知情同意工作流程会增加开发成本。那些在设计上註重隐私的公司能够赢得信任,并在铁路、能源和国防领域赢得竞标。 「数位欧洲」计画的津贴旨在促进跨国标准协调,从而在未来十年减少碎片化。
其他福利:
- Excel 格式的市场预测 (ME) 表
- 3个月的分析师支持
目录
第一章 引言
- 研究假设和市场定义
- 调查范围
第二章调查方法
第三章执行摘要
第四章 市场状况
- 市场概况
- 市场驱动因素
- 5G 和边缘运算实现低延迟体验
- 游戏和零售领域以行动优先的 AR 应用
- 企业对身临其境型培训和远端支援的需求
- 使用 Vision Pro 投资空间计算
- Micro OLED/OLEDoS成本突破
- 基于生成式人工智慧的 3D 内容自动化
- 市场限制
- 商用HMD的初始成本很高
- 隐私和资料安全问题
- 平台间空间标准差距
- 波导管与微型OLED供应瓶颈
- 价值/供应链分析
- 监管状况
- 技术展望
- 波特五力分析
- 新进入者的威胁
- 买方的议价能力
- 供应商的议价能力
- 替代品的威胁
- 竞争对手之间的竞争强度
- 新冠疫情的影响与疫情后的重启
- 投资分析
第五章市场规模与成长预测
- 按组件
- 硬体
- 软体
- 服务
- 依设备类型
- 独立头戴式显示器(HMD)
- 系留/主机连结 HMD
- 智慧眼镜和HUD
- 手持/移动 AR
- 按最终用户产业
- 游戏和娱乐
- 卫生保健
- 教育和培训
- 零售与电子商务
- 工业和製造业
- 汽车和运输
- 军事/国防
- 其他的
- 按用途
- 远距协作与援助
- 设计与视觉化
- 维护和维修
- 模拟与训练
- 航海与旅游
- 行销和广告
- 按地区
- 北美洲
- 美国
- 加拿大
- 墨西哥
- 南美洲
- 巴西
- 阿根廷
- 南美洲其他地区
- 欧洲
- 德国
- 英国
- 法国
- 义大利
- 俄罗斯
- 其他欧洲国家
- 亚太地区
- 中国
- 日本
- 韩国
- 印度
- 澳洲
- 其他亚太地区
- 中东和非洲
- 沙乌地阿拉伯
- 阿拉伯聯合大公国
- 南非
- 土耳其
- 其他中东和非洲地区
- 北美洲
第六章 竞争态势
- 市场集中度
- 策略倡议
- 市占率分析
- 公司简介
- Meta Platforms Inc.
- Microsoft Corporation
- Apple Inc.
- Google LLC
- Samsung Electronics Co. Ltd.
- Sony Group Corporation
- Magic Leap Inc.
- Vuzix Corporation
- Niantic Inc.
- PTC Inc.
- Ultraleap Ltd.
- HTC Corporation
- RealWear Inc.
- Lenovo Group Ltd.
- Seiko Epson Corporation
- Atheer Inc.
- Varjo Technologies Oy
- Pico Interactive(BYTdance)
- HP Development Company LP
- AsusTek Computer Inc.
- Acer Inc.
- Dell Technologies Inc.
- Qualcomm Technologies Inc.
- Trimble Inc.
- Snap Inc.
第七章 市场机会与未来展望
The Augmented Reality And Mixed Reality Market size is estimated at USD 256.91 billion in 2025, and is expected to reach USD 998.14 billion by 2030, at a CAGR of 31.19% during the forecast period (2025-2030).
Commercial deployment of 5G networks, sustained enterprise digital-transformation budgets, and rapid cost erosion in micro-OLED and waveguide displays are converting spatial-computing pilots into scaled roll-outs. Enterprises report measurable efficiency gains; for example, Mars Petcare cut coaching travel costs by 35% after pairing RealWear HMT-1 wearables with Microsoft Teams. Competitive momentum intensifies as Meta absorbs multi-year Reality Labs losses, Apple positions Vision Pro for premium spatial-computing, and a Samsung-Google-Qualcomm alliance races to a 2025 Android XR launch. The augmented reality and mixed reality market now sits at the intersection of hardware innovation, AI-assisted 3D content pipelines, and managed-services growth that encourages recurring-revenue models.
Global Augmented Reality And Mixed Reality Market Trends and Insights
5G and Edge-enabled Low-latency Experiences
Telcos now deliver sub-20 ms latency, enabling cloud-rendered visuals that lighten headsets and prolong battery life. Edge offloading lets lightweight glasses handle feature-rich content without thermal overload. Qualcomm's distributed compute patents allow devices to switch seamlessly between local and remote processing, matching power needs to network conditions. Multiplayer mixed-reality games now require up to 50 Mbps per player, pushing operators toward AR-specific service tiers. Time-sensitive industrial tasks such as remote equipment resets benefit from near-instant holographic guidance, unlocking new enterprise contracts for network providers.
Mobile-first AR Adoption in Gaming and Retail
Smartphone AR lowers entry barriers, evidenced by Pokemon GO surpassing USD 8 billion lifetime revenue. Retailers leverage virtual try-ons; Sephora's facial-recognition-enabled Virtual Artist drives higher cart conversion while lowering return rates. IKEA's Place app lets buyers assess furniture fit in actual rooms, reducing size-related returns. Google broadened AR beauty try-ons to mobile browsers, lifting interaction rates for 50+ brands by 10%. The mobile channel nurtures user familiarity that later transitions to headset adoption, reinforcing the augmented reality and mixed reality market's funnel from phones to wearables.
High Upfront Cost of Professional HMDs
Premium pricing restricts volume deployment. Apple Vision Pro's tag surpasses USD 3,000, forcing firms to stage adoption in pilot waves. Sony trimmed PlayStation VR2 prices yet paused production after excess inventory underscored sensitivity to cost. HTC targets niche enterprise users willing to justify USD 999 Vive Focus Vision through ROI analytics. Meta's cumulative Reality Labs losses signal the struggle to pair technological ambition with affordable consumer SKUs. Vendors focus on scale economies in optics and SoCs to cross critical pricing thresholds that unlock wider addressable markets.
Other drivers and restraints analyzed in the detailed report include:
- Enterprise Demand for Immersive Training and Remote Support
- Vision Pro-driven Spatial-computing Investment
- Privacy and Data-Security Concerns
For complete list of drivers and restraints, kindly check the Table Of Contents.
Segment Analysis
Hardware retained 61% of revenue in 2024 as premium headsets and optics remain capital-heavy. In monetary terms, the augmented reality and mixed reality market size for hardware approached USD 156 billion, reflecting continued enterprise spending on Vision Pro, Quest Pro, and HoloLens. Meanwhile, services posted the highest 32.5% CAGR, underlining migration to subscription-oriented support, content-authoring, and device-management offerings.
Growth in managed services mirrors cloud-software trajectories. ArborXR offers fleet-management subscriptions across multi-brand VR, reducing IT complexity for large roll-outs. System integrators bundle content libraries, analytics, and on-call troubleshooting into predictable OPEX, shifting cost discussions from hardware outlay to total-solution payback. As micro-OLED costs fall, hardware revenue may dilute proportionally, yet services will compound, keeping the augmented reality and mixed reality market on a recurring-revenue footing.
Stand-alone HMDs commanded 48% of spend in 2024, equivalent to nearly half of the augmented reality and mixed reality market size for devices. However, smart glasses are forecast at a 33% CAGR as waveguide miniaturization moves products toward everyday eyewear weight. Industry prototypes such as Meta Orion deliver 70-degree FOV while meeting under-85-gram targets, a tipping point for day-long wearability.
Samsung-Google's Project Moohan blends transparent displays with Gemini AI, focusing on heads-up information rather than full-occlusion immersion. Consumers gravitate to lighter form factors in social settings, while enterprises favor glasses for safety-helmet integration and line-of-sight workflows. As supply chains stabilize, the mix will pivot toward glasses, reshaping developer priorities and marketing narratives across the augmented reality and mixed reality market.
The Augmented Reality and Mixed Reality Market Report is Segmented by Component (Hardware, Software, and Services), Device Type (Stand-Alone Head-Mounted Display [HMD], Tethered/Console-linked HMD, and More), End-User Industry (Gaming and Entertainment, Healthcare, Education and Training, Retail and E-Commerce, and More), Application (Remote Collaboration and Assistance, Design and Visualization, and More), and Geography.
Geography Analysis
North America continues to supply the bulk of platform software and venture capital. Early enterprise roll-outs confirmed ROI in logistics, field service, and healthcare, anchoring repeat orders despite macro uncertainty. Regulatory clarity on export controls and IP safeguards attracts overseas firms to form R&D centers in Silicon Valley and Seattle. Yet unit growth has slowed as first-wave adopters mature and procurement moves into replacement cycles.
Asia Pacific's expansion outpaces the global average. Pro-innovation industrial policies and concentrated display manufacturing compress time-to-market for new optics. Telcos in South Korea and Japan monetize 5G-based XR subscriptions, fueling consumer awareness. Start-ups enjoy government grants that cover up to 50% of pilot costs, accelerating enterprise proof-of-concepts. Rising disposable income among middle-class consumers further elevates AR shopping and gaming uptake.
Europe balances opportunity with caution. Industrial companies leverage AR for predictive maintenance within established automation architectures, while healthcare systems pilot remote-surgery visualization. However, GDPR-driven consent workflows add development overhead. Firms that demonstrate privacy-by-design earn trust and win tenders across rail, energy, and defense. Subsidies from the Digital Europe Programme target cross-border standards alignment, aiming to lower fragmentation over the coming decade.
- Meta Platforms Inc.
- Microsoft Corporation
- Apple Inc.
- Google LLC
- Samsung Electronics Co. Ltd.
- Sony Group Corporation
- Magic Leap Inc.
- Vuzix Corporation
- Niantic Inc.
- PTC Inc.
- Ultraleap Ltd.
- HTC Corporation
- RealWear Inc.
- Lenovo Group Ltd.
- Seiko Epson Corporation
- Atheer Inc.
- Varjo Technologies Oy
- Pico Interactive (BYTdance)
- HP Development Company LP
- AsusTek Computer Inc.
- Acer Inc.
- Dell Technologies Inc.
- Qualcomm Technologies Inc.
- Trimble Inc.
- Snap Inc.
Additional Benefits:
- The market estimate (ME) sheet in Excel format
- 3 months of analyst support
TABLE OF CONTENTS
1 INTRODUCTION
- 1.1 Study Assumptions and Market Definition
- 1.2 Scope of the Study
2 RESEARCH METHODOLOGY
3 EXECUTIVE SUMMARY
4 MARKET LANDSCAPE
- 4.1 Market Overview
- 4.2 Market Drivers
- 4.2.1 5G and Edge-enabled low-latency experiences
- 4.2.2 Mobile-first AR adoption in gaming and retail
- 4.2.3 Enterprise demand for immersive training and remote support
- 4.2.4 Vision Pro-driven spatial-computing investments
- 4.2.5 Micro-OLED/OLEDoS cost breakthroughs
- 4.2.6 Generative-AI-based 3D content automation
- 4.3 Market Restraints
- 4.3.1 High upfront cost of professional HMDs
- 4.3.2 Privacy and data-security concerns
- 4.3.3 Inter-platform spatial-standards gap
- 4.3.4 Waveguide and micro-OLED supply bottlenecks
- 4.4 Value/Supply-Chain Analysis
- 4.5 Regulatory Landscape
- 4.6 Technological Outlook
- 4.7 Porter's Five Forces Analysis
- 4.7.1 Threat of New Entrants
- 4.7.2 Bargaining Power of Buyers
- 4.7.3 Bargaining Power of Suppliers
- 4.7.4 Threat of Substitutes
- 4.7.5 Intensity of Competitive Rivalry
- 4.8 Impact of COVID-19 and Post-Pandemic Reset
- 4.9 Investment Analysis
5 MARKET SIZE AND GROWTH FORECASTS (VALUE)
- 5.1 By Component
- 5.1.1 Hardware
- 5.1.2 Software
- 5.1.3 Services
- 5.2 By Device Type
- 5.2.1 Stand-alone Head-Mounted Display (HMD)
- 5.2.2 Tethered/Console-linked HMD
- 5.2.3 Smart Glasses and HUD
- 5.2.4 Handheld/Mobile AR
- 5.3 By End-user Industry
- 5.3.1 Gaming and Entertainment
- 5.3.2 Healthcare
- 5.3.3 Education and Training
- 5.3.4 Retail and E-commerce
- 5.3.5 Industrial and Manufacturing
- 5.3.6 Automotive and Transportation
- 5.3.7 Military and Defense
- 5.3.8 Others
- 5.4 By Application
- 5.4.1 Remote Collaboration and Assistance
- 5.4.2 Design and Visualization
- 5.4.3 Maintenance and Repair
- 5.4.4 Simulation and Training
- 5.4.5 Navigation and Tourism
- 5.4.6 Marketing and Advertising
- 5.5 By Geography
- 5.5.1 North America
- 5.5.1.1 United States
- 5.5.1.2 Canada
- 5.5.1.3 Mexico
- 5.5.2 South America
- 5.5.2.1 Brazil
- 5.5.2.2 Argentina
- 5.5.2.3 Rest of South America
- 5.5.3 Europe
- 5.5.3.1 Germany
- 5.5.3.2 United Kingdom
- 5.5.3.3 France
- 5.5.3.4 Italy
- 5.5.3.5 Russia
- 5.5.3.6 Rest of Europe
- 5.5.4 Asia-Pacific
- 5.5.4.1 China
- 5.5.4.2 Japan
- 5.5.4.3 South Korea
- 5.5.4.4 India
- 5.5.4.5 Australia
- 5.5.4.6 Rest of Asia-Pacific
- 5.5.5 Middle East and Africa
- 5.5.5.1 Saudi Arabia
- 5.5.5.2 United Arab Emirates
- 5.5.5.3 South Africa
- 5.5.5.4 Turkey
- 5.5.5.5 Rest of Middle East and Africa
- 5.5.1 North America
6 COMPETITIVE LANDSCAPE
- 6.1 Market Concentration
- 6.2 Strategic Moves
- 6.3 Market Share Analysis
- 6.4 Company Profiles (includes Global level Overview, Market level overview, Core Segments, Financials, Strategic Info, Market Rank/Share, Products and Services, Recent Developments)
- 6.4.1 Meta Platforms Inc.
- 6.4.2 Microsoft Corporation
- 6.4.3 Apple Inc.
- 6.4.4 Google LLC
- 6.4.5 Samsung Electronics Co. Ltd.
- 6.4.6 Sony Group Corporation
- 6.4.7 Magic Leap Inc.
- 6.4.8 Vuzix Corporation
- 6.4.9 Niantic Inc.
- 6.4.10 PTC Inc.
- 6.4.11 Ultraleap Ltd.
- 6.4.12 HTC Corporation
- 6.4.13 RealWear Inc.
- 6.4.14 Lenovo Group Ltd.
- 6.4.15 Seiko Epson Corporation
- 6.4.16 Atheer Inc.
- 6.4.17 Varjo Technologies Oy
- 6.4.18 Pico Interactive (BYTdance)
- 6.4.19 HP Development Company LP
- 6.4.20 AsusTek Computer Inc.
- 6.4.21 Acer Inc.
- 6.4.22 Dell Technologies Inc.
- 6.4.23 Qualcomm Technologies Inc.
- 6.4.24 Trimble Inc.
- 6.4.25 Snap Inc.
7 MARKET OPPORTUNITIES AND FUTURE OUTLOOK
- 7.1 White-space and Unmet-need Assessment