


 |
市场调查报告书
商品编码
1844699
静态 RAM (SRAM):市场占有率分析、产业趋势、统计数据和成长预测(2025-2030 年)Static Random Access Memory (SRAM) - Market Share Analysis, Industry Trends & Statistics, Growth Forecasts (2025 - 2030) |
||||||
※ 本网页内容可能与最新版本有所差异。详细情况请与我们联繫。
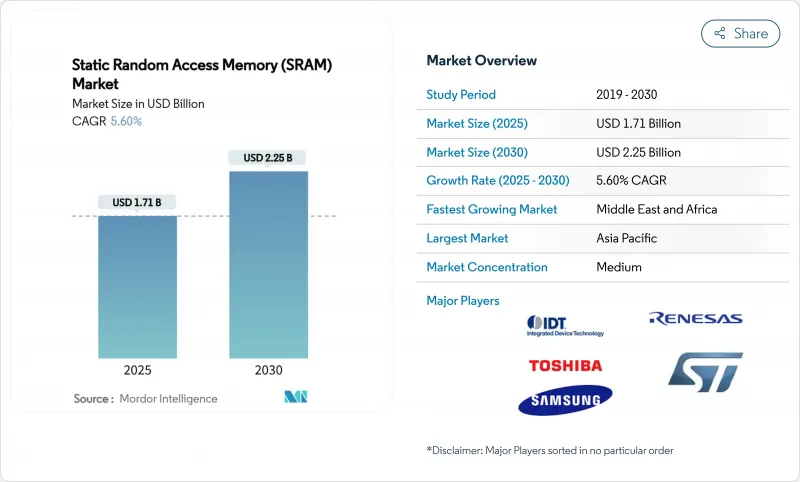
预计到 2025 年全球静态 RAM (SRAM) 市场规模将达到 17.1 亿美元,到 2030 年将达到 22.5 亿美元,复合年增长率为 5.60%。
这一增长反映了向以人工智慧为中心的运算、5G 部署和即时边缘处理的转变,所有这些都依赖 SRAM 的超低延迟快取层。半导体供应商优先考虑在 2nm 节点缩小 SRAM 单元尺寸,以支援更大的 L2/L3 缓存,同时保持严格的功耗预算。资料中心现代化推动了对交换器和加速器中高速缓衝器的需求,而消费设备的刷新週期则保持了稳定的基准。 2024 年台湾地震扰乱了晶圆代工厂的生产,使得供应链的弹性变得至关重要,并促使企业进行地理多元化。同时,MRAM 等新兴非挥发性记忆体增加了电池供电设计中传统 SRAM 的竞争压力。
全球静态 RAM (SRAM) 市场趋势与洞察
对更快快取的需求不断增加
2025 年推出的先进 CPU 和 GPU 配备了更大的片上缓存,以降低推理延迟。英特尔至强 6 处理器凭藉快取优化实现了 1.4 倍的效能提升。台积电 2 奈米平台的 SRAM 单元密度高于竞争对手的 18A 节点,为超大规模客户提供更高的每瓦 L3 快取。 Marvell 推出了一款配备 6GB 低功耗记忆体的 2 奈米客製化 SRAM,与先前的节点相比,功耗降低了 66%。这些创新使 AI 加速器能够将模型参数移近运算单元,从而在保持吞吐量的同时减少 DRAM 流量。因此,静态 RAM (SRAM) 市场受益于资料中心和边缘晶片的迭代容量升级。
资料中心及5G网路建设
云端营运商已将机架密度翻倍以承载人工智慧伺服器,这推动了基于静态随机存取记忆体 (SRAM) 的封包缓衝区在架顶式交换器中的使用。微软在其伺服器机房中测试了 246-275GHz 无线背板,并依靠高速 SRAM 实现微秒缓衝。思科的融合 5G 传输提升了确定性延迟,并要求其路由器中拥有深度 SRAM 伫列。康宁预测每个人工智慧机架的光纤需求将激增 18 倍,这反映了基于同步 SRAM 建构的交换器缓衝区的扩展。这波基础设施浪潮增强了静态随机存取记忆体 (SRAM) 市场的近期收益前景。
与 DRAM/NAND 相比,每比特高成本
SRAM 的每比特成本比商用 DRAM 上涨了数倍,迫使设计人员减少其在大批量设备中的使用。 2025 年上半年,DDR4 模组价格上涨了约 50%,显示整个记忆体堆迭市场波动剧烈。三星利用供应紧缩的机会提高了 LPDDR4 的价格,但这种策略可能会加速 OEM 厂商对混合 SRAM-DRAM 架构的兴趣,从而降低材料成本。因此,静态 RAM (SRAM) 市场在入门级消费市场遭遇了强烈衝击,直到密度/成本平衡得到改善。
細項分析
到2024年,同步SRAM将占据静态RAM (SRAM) 58.4%的市场份额,这对于CPU、GPU和网路ASIC中的确定性快取操作至关重要。汽车MCU使用同步阵列来满足驾驶辅助工作负载的严苛即时要求。随着先进节点扩展频率范围并降低核心电压,该领域将保持领先。
非同步 SRAM 的复合年增长率为 6.4%,这得益于物联网穿戴式装置和边缘闸道的普及,在这些装置中,功耗预算优先于延迟目标。节能设计消除了时脉树并简化了基板布局。这种差异凸显了静态 RAM (SRAM) 市场朝着针对特定应用进行最佳化而非一刀切效能的趋势。
伪 SRAM 将 DRAM 单元嵌入 SRAM 式介面后面,以实现高密度,无需系统层级刷新管理,到 2024 年将占据 54.4% 的市场份额。 RAAAM Memory Technologies 和 NXP 声称,与传统的高密度 SRAM 相比,其面积节省了 50%,功耗节省了 10 倍,对大众市场微控制器具有吸引力。
由于工厂和汽车对断电期间资料完整性的要求越来越高,非挥发性 SRAM 的复合年增长率高达 8.7%。工业自动化公司选择 nvSRAM 模组来保护製程变数并避免代价高昂的停机。儘管该细分市场规模较小,但凭藉其增值的弹性特性,它丰富了静态 RAM (SRAM) 的市场格局。
区域分析
受台湾代工主导地位、韩国记忆体创新以及中国大陆规模化扩张的推动,亚太地区将在2024年维持61.4%的静态随机存取记忆体(SRAM)市场占有率。 SK海力士已发展壮大,占据全球DRAM产量的36%,凸显了该地区的技术实力。然而,2024年台湾地震暴露了集中风险,促使日本和新加坡建造晶圆厂以应对紧急情况。日本预测2026财年的半导体设备销售额将达到5.51兆日圆(383.5亿美元),并强调将持续扩大产能。
中东和非洲的复合年增长率最高,达到7.5%,这得益于主权财富基金的投入,旨在将沿岸地区打造为三大洲的资料中心。到2025年,该地区的仓库自动化市场规模将以17.5%的复合年增长率成长,达到16亿美元,这将推动对可靠板载快取的需求。预计到2030年,非洲能源计划的新资本投资将达到7,300亿美元,这需要依赖SRAM实现确定性反应的工业控制系统。
北美正专注于部署人工智慧资料中心,而欧洲则透过430亿欧元的《晶片法案》加倍强调其主权。意法半导体已获得50亿欧元(54亿美元)用于在义大利建造碳化硅园区,以增强其在电力电子领域的区域竞争力,该领域也需要专用的SRAM。然而,人才短缺威胁着其扩张,阿斯麦公司警告称,如果边境管制更加严格,可能会转向其他领域。这些截然不同的倡议凸显了塑造静态随机存取记忆体(SRAM)市场的多元化区域因素。
其他福利:
- Excel 格式的市场预测 (ME) 表
- 3个月的分析师支持
目录
第一章 引言
- 研究假设和市场定义
- 调查范围
第二章调查方法
第三章执行摘要
第四章 市场状况
- 市场概况
- 市场驱动因素
- 对更快快取的需求不断增加
- 资料中心及5G网路建设
- 物联网和穿戴式装置的普及
- 用于小晶片的 3D 整合 SRAM
- 适用于低地球轨道卫星的抗辐射 SRAM
- 采用记忆体内AI 加速器
- 市场限制
- 与 DRAM/NAND 相比,每位元成本更高
- 5nm节点以下功耗上升
- 新兴 NVM (MRAM/ReRAM) 替代品
- 微影术的差异导致产量比率
- 价值链分析
- 监管状况
- 技术展望
- 波特五力分析
- 新进入者的威胁
- 买方的议价能力
- 供应商的议价能力
- 替代品的威胁
- 竞争的激烈程度
- 宏观经济因素的影响
第五章市场规模及成长预测
- 按功能
- 异步SRAM
- 同步SRAM
- 依产品类型
- 伪SRAM(PSRAM)
- 非挥发性SRAM(nvSRAM)
- 其他产品类型
- 按内存密度
- 8 Mb 或更少
- 8~64 Mb
- 64~256 Mb
- 超过 256 Mb
- 按最终用户
- 消费性电子产品
- 产业
- 通讯基础设施
- 汽车和航太
- 其他最终用户
- 按地区
- 北美洲
- 美国
- 加拿大
- 墨西哥
- 南美洲
- 巴西
- 阿根廷
- 其他南美
- 欧洲
- 德国
- 英国
- 法国
- 义大利
- 俄罗斯
- 其他欧洲国家
- 亚太地区
- 中国
- 日本
- 韩国
- 印度
- 台湾
- 其他亚太地区
- 中东和非洲
- 中东
- 土耳其
- 以色列
- 海湾合作委员会国家
- 其他中东地区
- 非洲
- 南非
- 奈及利亚
- 其他非洲国家
- 北美洲
第六章 竞争态势
- 市场集中度
- 策略倡议
- 市占率分析
- 公司简介
- GSI Technology Inc.
- Cypress Semiconductor Corp.(Infineon)
- Renesas Electronics Corp.
- Integrated Silicon Solution Inc.
- Alliance Memory Inc.
- Everspin Technologies Inc.
- Samsung Electronics Co., Ltd.
- Toshiba Electronic Devices & Storage Corp.
- STMicroelectronics NV
- SK hynix Inc.
- Micron Technology Inc.
- Nanya Technology Corp.
- Winbond Electronics Corp.
- Elite Semiconductor Memory Technology Inc.
- Chiplus Semiconductor Corp.
- Powerchip Semiconductor Mfg. Corp.
- Puya Semiconductor Technology Co., Ltd.
- Lyontek Inc.
- ON Semiconductor Corporation
- Texas Instruments Incorporated
- Integrated Device Technology Inc.
- NXP Semiconductors NV
- Etron Technology Inc.
- Espressif Systems(Shanghai)Co., Ltd.
- SKYHigh Memory Ltd.
第七章 市场机会与未来展望
The global Static Random Access Memory market size stood at USD 1.71 billion in 2025 and is forecast to advance at a 5.60% CAGR to reach USD 2.25 billion by 2030.
Growth reflected the transition toward AI-centric compute, 5G roll-outs, and real-time edge processing, all of which rely on SRAM's ultra-low latency for cache hierarchies. Semiconductor vendors prioritized shrinking SRAM cells at 2 nm to support larger L2/L3 caches while keeping power budgets in check. Data-center modernization drove demand for high-speed buffers in switches and accelerators, whereas consumer device refresh cycles maintained a steady baseline. Supply-chain resilience became pivotal after the 2024 Taiwan earthquake disrupted foundry output, prompting geographic diversification initiatives. Meanwhile, emerging non-volatile memories such as MRAM intensified competitive pressure on conventional SRAM in battery-backed designs.
Global Static Random Access Memory (SRAM) Market Trends and Insights
Rising demand for faster cache memories
Advanced CPUs and GPUs shipped in 2025 featured larger on-chip caches to cut inference latency, with Intel's Xeon 6 showing a 1.4X performance lift tied to cache optimization. TSMC's 2 nm platform delivered higher SRAM cell density than competing 18A nodes, giving hyperscale customers more L3 cache per watt. Marvell unveiled 2 nm custom SRAM that packs 6 Gb of low-power memory, reducing energy use by 66% versus prior nodes. Such innovations enabled AI accelerators to keep model parameters closer to compute units, sustaining throughput while containing DRAM traffic. Consequently, the Static Random Access Memory market benefited from recurring capacity upgrades across data-center and edge silicon.
Data-center and 5G network build-out
Cloud operators doubled rack densities to host AI servers, prompting wider use of SRAM-based packet buffers in top-of-rack switches. Microsoft tested 246-275 GHz wireless backplanes in server halls, where microsecond-scale buffering relied on high-speed SRAM. Cisco's converged 5G transport promoted deterministic latency, necessitating deep SRAM queues in routers. Corning forecasts an 18X jump in fiber demand per AI rack, mirroring the scaling of switch buffers built on synchronous SRAM. This infrastructure wave reinforced near-term revenue visibility for the Static Random Access Memory market.
High cost per bit vs. DRAM/NAND
SRAM remained several times more expensive per bit than commodity DRAM, pressuring designers to trim usage in mass-market gadgets. DDR4 module prices climbed roughly 50% in H1 2025, illustrating volatility across the memory stack. Samsung leveraged tightening supply to lift LPDDR4 pricing, but that tactic risked accelerating OEM interest in hybrid SRAM-DRAM architectures to curb bills of materials. Consequently, the Static Random Access Memory market faced pushback in entry-level consumer segments until density-versus-cost trade-offs improved.
Other drivers and restraints analyzed in the detailed report include:
- IoT and wearable device proliferation
- In-memory AI accelerators adoption
- Emerging NVM (MRAM/ReRAM) displacement
For complete list of drivers and restraints, kindly check the Table Of Contents.
Segment Analysis
Synchronous SRAM captured 58.4% Static Random Access Memory market share in 2024, underscoring its indispensability for deterministic cache operation in CPUs, GPUs, and network ASICs. Automotive MCUs used synchronous arrays to meet stringent real-time requirements for driver-assistance workloads. The segment will maintain leadership as advanced nodes extend frequency envelopes and reduce core voltages.
Asynchronous SRAM expanded at a 6.4% CAGR and increasingly served IoT wearables and edge gateways where power budgets override latency targets. Energy-efficient designs eliminated clock trees and simplified board layouts, a boon for battery-operated healthcare devices employing Syntiant's neural coprocessors. This divergence emphasized the Static Random Access Memory market trend toward application-specific optimization rather than one-size-fits-all performance chasing.
Pseudo-SRAM held a 54.4% share in 2024 by embedding DRAM cells behind an SRAM-style interface, achieving higher density without refresh management at the system level. RAAAM Memory Technologies and NXP claimed 50% area and 10X power savings versus classic high-density SRAM, appealing to mass-market microcontrollers.
Non-volatile SRAM grew fastest at 8.7% CAGR as factories and vehicles demanded data integrity during brownouts. Industrial automation players selected nvSRAM modules to protect process variables, avoiding costly downtime. Although niche, this cohort enriched the Static Random Access Memory market landscape with value-added resilience features.
Static Random Access Memory (SRAM) Market is Segmented by Function (Asynchronous SRAM, and Synchronous SRAM), Product Type (Pseudo SRAM, Non-Volatile SRAM, and Other Product Types), Memory Density (<=8 Mb, 8-64 Mb, 64-256 Mb, and >256 Mb), End User (Consumer Electronics, Industrial, Communication Infrastructure, and More), and Geography (North America, South America, Europe, Asia-Pacific, and Middle East and Africa).
Geography Analysis
Asia-Pacific retained 61.4% Static Random Access Memory market share in 2024, fueled by Taiwan's foundry dominance, South Korea's memory innovation, and China's scale-up efforts. SK Hynix's rise to 36% of global DRAM output highlighted the region's technology depth. Yet the 2024 Taiwan quake exposed concentration risk, prompting contingency fabs in Japan and Singapore. Japan projected semiconductor equipment sales of JPY 5.51 trillion (USD 38.35 billion) in FY26, underscoring continued capacity build-out.
Middle East and Africa charted the fastest 7.5% CAGR, anchored by sovereign-fund spending to position the Gulf as a tri-continent data hub. Warehouse automation in the region was set for 17.5% annual growth to USD 1.6 billion by 2025, driving demand for reliable on-board caches. Africa's energy projects earmarked USD 730 billion in new capex to 2030, requiring industrial control systems that lean on SRAM for deterministic response.
North America focused on AI datacenter roll-outs, while Europe doubled down on sovereignty through the EUR 43 billion Chips Act. STMicroelectronics secured EUR 5 billion (USD 5.4 billion) for a Silicon Carbide campus in Italy, widening regional competency in power electronics that also consume specialized SRAM. Talent shortages, however, threatened expansion, with ASML warning it might shift operations if immigration tightened. These contrasts highlight diverse regional levers shaping the Static Random Access Memory market.
- GSI Technology Inc.
- Cypress Semiconductor Corp. (Infineon)
- Renesas Electronics Corp.
- Integrated Silicon Solution Inc.
- Alliance Memory Inc.
- Everspin Technologies Inc.
- Samsung Electronics Co., Ltd.
- Toshiba Electronic Devices & Storage Corp.
- STMicroelectronics N.V.
- SK hynix Inc.
- Micron Technology Inc.
- Nanya Technology Corp.
- Winbond Electronics Corp.
- Elite Semiconductor Memory Technology Inc.
- Chiplus Semiconductor Corp.
- Powerchip Semiconductor Mfg. Corp.
- Puya Semiconductor Technology Co., Ltd.
- Lyontek Inc.
- ON Semiconductor Corporation
- Texas Instruments Incorporated
- Integrated Device Technology Inc.
- NXP Semiconductors N.V.
- Etron Technology Inc.
- Espressif Systems (Shanghai) Co., Ltd.
- SKYHigh Memory Ltd.
Additional Benefits:
- The market estimate (ME) sheet in Excel format
- 3 months of analyst support
TABLE OF CONTENTS
1 INTRODUCTION
- 1.1 Study Assumptions and Market Definition
- 1.2 Scope of the Study
2 RESEARCH METHODOLOGY
3 EXECUTIVE SUMMARY
4 MARKET LANDSCAPE
- 4.1 Market Overview
- 4.2 Market Drivers
- 4.2.1 Rising demand for faster cache memories
- 4.2.2 Data-center and 5G network build-out
- 4.2.3 IoT and wearable device proliferation
- 4.2.4 3D-integrated SRAM for chiplets
- 4.2.5 Radiation-hardened SRAM for LEO satellites
- 4.2.6 In-memory AI accelerators adoption
- 4.3 Market Restraints
- 4.3.1 High cost per bit vs. DRAM/NAND
- 4.3.2 Escalating power at <=5 nm nodes
- 4.3.3 Emerging NVM (MRAM/ReRAM) displacement
- 4.3.4 Yield loss from lithography variability
- 4.4 Value Chain Analysis
- 4.5 Regulatory Landscape
- 4.6 Technological Outlook
- 4.7 Porter's Five Forces Analysis
- 4.7.1 Threat of New Entrants
- 4.7.2 Bargaining Power of Buyers
- 4.7.3 Bargaining Power of Suppliers
- 4.7.4 Threat of Substitutes
- 4.7.5 Intensity of Rivalry
- 4.8 Impact of Macroeconomic Factors
5 MARKET SIZE AND GROWTH FORECASTS (VALUE)
- 5.1 By Function
- 5.1.1 Asynchronous SRAM
- 5.1.2 Synchronous SRAM
- 5.2 By Product Type
- 5.2.1 Pseudo SRAM (PSRAM)
- 5.2.2 Non-Volatile SRAM (nvSRAM)
- 5.2.3 Other Product Types
- 5.3 By Memory Density
- 5.3.1 <=8 Mb
- 5.3.2 8 - 64 Mb
- 5.3.3 64 - 256 Mb
- 5.3.4 >256 Mb
- 5.4 By End User
- 5.4.1 Consumer Electronics
- 5.4.2 Industrial
- 5.4.3 Communication Infrastructure
- 5.4.4 Automotive and Aerospace
- 5.4.5 Other End Users
- 5.5 By Geography
- 5.5.1 North America
- 5.5.1.1 United States
- 5.5.1.2 Canada
- 5.5.1.3 Mexico
- 5.5.2 South America
- 5.5.2.1 Brazil
- 5.5.2.2 Argentina
- 5.5.2.3 Rest of South America
- 5.5.3 Europe
- 5.5.3.1 Germany
- 5.5.3.2 United Kingdom
- 5.5.3.3 France
- 5.5.3.4 Italy
- 5.5.3.5 Russia
- 5.5.3.6 Rest of Europe
- 5.5.4 Asia-Pacific
- 5.5.4.1 China
- 5.5.4.2 Japan
- 5.5.4.3 South Korea
- 5.5.4.4 India
- 5.5.4.5 Taiwan
- 5.5.4.6 Rest of Asia-Pacific
- 5.5.5 Middle East and Africa
- 5.5.5.1 Middle East
- 5.5.5.1.1 Turkey
- 5.5.5.1.2 Israel
- 5.5.5.1.3 GCC Countries
- 5.5.5.1.4 Rest of Middle East
- 5.5.5.2 Africa
- 5.5.5.2.1 South Africa
- 5.5.5.2.2 Nigeria
- 5.5.5.2.3 Rest of Africa
- 5.5.1 North America
6 COMPETITIVE LANDSCAPE
- 6.1 Market Concentration
- 6.2 Strategic Moves
- 6.3 Market Share Analysis
- 6.4 Company Profiles (includes Global level Overview, Market level overview, Core Segments, Financials as available, Strategic Information, Market Rank/Share for key companies, Products and Services, and Recent Developments)
- 6.4.1 GSI Technology Inc.
- 6.4.2 Cypress Semiconductor Corp. (Infineon)
- 6.4.3 Renesas Electronics Corp.
- 6.4.4 Integrated Silicon Solution Inc.
- 6.4.5 Alliance Memory Inc.
- 6.4.6 Everspin Technologies Inc.
- 6.4.7 Samsung Electronics Co., Ltd.
- 6.4.8 Toshiba Electronic Devices & Storage Corp.
- 6.4.9 STMicroelectronics N.V.
- 6.4.10 SK hynix Inc.
- 6.4.11 Micron Technology Inc.
- 6.4.12 Nanya Technology Corp.
- 6.4.13 Winbond Electronics Corp.
- 6.4.14 Elite Semiconductor Memory Technology Inc.
- 6.4.15 Chiplus Semiconductor Corp.
- 6.4.16 Powerchip Semiconductor Mfg. Corp.
- 6.4.17 Puya Semiconductor Technology Co., Ltd.
- 6.4.18 Lyontek Inc.
- 6.4.19 ON Semiconductor Corporation
- 6.4.20 Texas Instruments Incorporated
- 6.4.21 Integrated Device Technology Inc.
- 6.4.22 NXP Semiconductors N.V.
- 6.4.23 Etron Technology Inc.
- 6.4.24 Espressif Systems (Shanghai) Co., Ltd.
- 6.4.25 SKYHigh Memory Ltd.
7 MARKET OPPORTUNITIES AND FUTURE OUTLOOK
- 7.1 White-space and Unmet-need Assessment
 静态随机存取记忆体(SRAM)市场机会、成长要素、产业趋势分析及2026年至2035年预测
 SRAM 和 ROM 设计 IP 市场规模、份额和成长分析(按应用、产品、技术、最终用途和地区划分)—产业预测(2026-2033 年)
 全球静态随机存取记忆体市场
 SRAM(静态RAM)市场报告:2031年趋势、预测与竞争分析
 SRAM 和 ROM 设计 IP 市场报告(按类型(SRAM(静态随机存取记忆体)、ROM(唯读记忆体))和地区划分)2025 年至 2033 年
 2024 年至 2028 年全球 SRAM 与 ROM 设计 IP 市场
 静态随机存取记忆体市场 - 全球产业规模、份额、趋势、机会和预测,按产品类型(非同步 SRAM、伪 SRAM、同步 SRAM)、最终用户、地区和竞争细分,2019-2029 年SRAM 和 ROM 设计 IP 的全球市场