


 |
市场调查报告书
商品编码
1844727
ITS(智慧型运输系统):市场占有率分析、产业趋势、统计数据和成长预测(2025-2030)Intelligent Transport Systems - Market Share Analysis, Industry Trends & Statistics, Growth Forecasts (2025 - 2030) |
||||||
※ 本网页内容可能与最新版本有所差异。详细情况请与我们联繫。
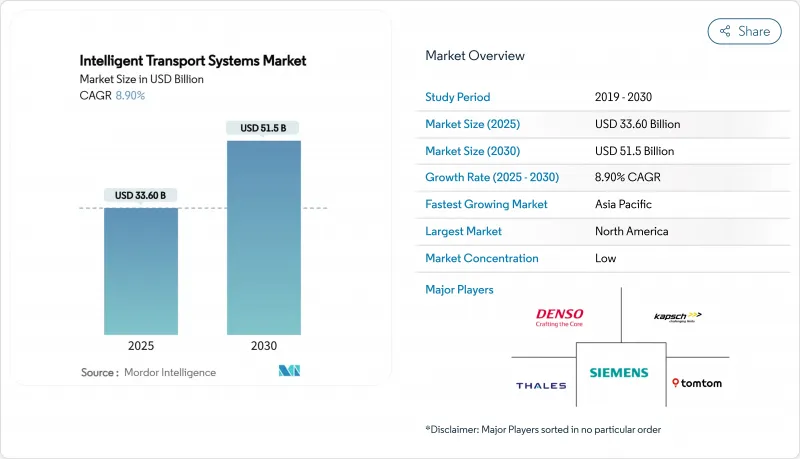
预计到 2025 年,ITS(智慧型运输系统)市场规模将成长至 502.6 亿美元,到 2030 年将成长至 778.3 亿美元,复合年增长率为 9.40%。
城市人口不断增长、拥塞成本不断上升以及气候目标的不断强化,正推动城市实现交通运营数位化,并采用数据主导的出行编配。 5G 部署、低成本感测器和边缘人工智慧 (AI) 赋能路口控制器、路侧单元和汽车平臺,使其能够以亚秒级而非固定的时间表运行。随着各机构从资本密集、孤立的资产转向基于云端的订阅式平台,这种转变正在重新定义硬体、软体和服务的经营模式。能够将自适应分析与生命週期支援和网路安全连接相结合的供应商将有望抓住快速增长的机会。
全球ITS(智慧型运输系统)市场趋势与洞察
政府为智慧城市和 ITS 提供资金
公共资助计画透过降低初始资本支出风险和标准化最佳实践来加速采用。美国联邦公路管理局承诺将在2025财年的ITS项目上投入8亿美元,以实现更安全、更有效率的营运。一项平行的SMART拨款将在2026年之前每年拨款1亿美元,用于试行数据驱动的社区旅行。欧盟的「地平线框架」和日本的「SIP倡议」中的类似计画将统一测试平台、网路安全基准、开放资料政策,并缩短采购週期。随着交叉路口、公车队、停车资产和紧急走廊开始在通用架构下共用数据,协调一致的资金筹措将释放出复合效益。这种模式实现了单一专案无法实现的采用曲线。
用于自适应控制的人工智慧边缘处理
边缘人工智慧将推理直接推送到路边单元和车载计算机,将安全关键操作的延迟降低至50毫秒或更短。美国联邦运输管理局已累计4000万美元用于尖端公共交通研发,包括低延迟交叉路口协调。自学习控制器可预测伫列长度并在拥塞发生前调整相位。边缘框架还允许本地节点在中央云链路发生故障的情况下维持交叉路口运行,从而提高了弹性。随着时间的推移,这种分散式架构将支援车辆编队行驶、协作感知和混合移动编配,标誌着智慧型运输系统(ITS) 市场的一个重要曲折点。
资本投资及营运维护成本高
升级交叉路口套件、通讯主干网和指挥中心需要多年的预算,许多市政当局难以组装足够的资金。即时自我调整系统的生命週期成本不仅限于安装,还包括韧体更新、校准和备件。美国政府问责局 (GAO) 2023 年的一项研究发现,由于竞标週期比技术更新週期更长,各机构通常会接受过时的硬体。官民合作关係和基于绩效的合约是新的解决方案,但相关人员必须权衡回报与债务上限,尤其是在基础设施优先事项相互竞争的情况下。
細項分析
目前,成熟的智慧型运输管理系统正在推动ITS(智慧型运输系统)市场规模的成长,预计2024年将占全球营收的约32.21%。整合CCTV、环形侦测器和动态讯息牌使交通部门能够疏导交通流量、降低碰撞率并协调事故回应。由于许多大都会圈已开始使用第一代平台,因此成长将保持稳定而非迅猛,但人工智慧预测和5G回程传输的升级将保持强劲的成长动能。
先进的公共运输系统正以15.34%的复合年增长率高速成长,这得益于电动公车队、帐户票务和即时乘客资讯的推动。 Karsan安静且配备感测器的电动公车展示了OEM创新如何与云叫车技术结合,从而改善乘客体验并减少排放。在欧洲和部分北美地区,整合的前端平台正在将时刻表遵守情况、运转率和能源使用情况资料输入多模态枢纽,预示着拥塞控制将从以车辆为中心转变为以乘客为中心的网路组织模式。
感测和通讯硬体占支出的40.19%,反映了为交叉路口、走廊和车队配备可靠数据收集器所需的资金。摄影机、雷达、光达和环境探测器创建了监控演算法所依赖的原始资料流。
云端平台的复合年增长率高达 20.65%,各机构青睐按计量收费分析、数位双胞胎视觉化和支援 API 的数据市场。 Iteris 的 ClearAsset 之所以具有吸引力,是因为它允许运输团队追踪库存、安排预防性保养,并评估资本升级的合理性,而无需维护现场伺服器。硬体诊断与无线韧体推送之间的紧密耦合确保了未来升级所需的现场工作更少,从而延长了组件寿命,并增强了整合堆迭在 ITS(智慧型运输系统)市场中的价值。
区域分析
在成熟的通讯网路、联邦津贴和早期试点部署的支持下,北美预计将在2024年占全球收入的38.16%。国家V2X部署计画的目标是到2036年涵盖美国主要高速公路和7.5万个交叉路口,为供应商和市政当局提供蓝图。美国联邦通讯委员会最终分配的5.9 GHz频段仅剩下30 MHz可用于C-V2X,因此对更有效率波形设计的呼声日益高涨。一个跨行业论坛正在讨论频率、标准和责任问题。国防安全保障部建议在连网道路资产上统一实施5G保护。
亚太地区在该领域引领全球市场,到2030年的复合年增长率将达到11.54%。大规模都市化、智慧型手机普及率以及绿色城市要求正在推动中国、日本和韩国进行大规模试验。台湾的「智慧城市台湾」计画展现了全国性的丛集。地方政府将作为主要客户,推动国内ICT公司从硬体供应转型为整合软体服务。当地试点走廊正在应用路边5G MEC节点,以实现公分级定位和协同感知。随着新兴城镇都市化地区跳过传统阶段,从第一天起就融入人工智慧边缘逻辑,区域知识转移加速了时间轴的压缩。
欧洲继续推动以脱碳目标为中心的统一法规。涵盖雅典、里斯本、大曼彻斯特和雷恩的 TANGENT计划强调了一个简化多式联运编配的资料互通性框架。零排放交通区和欧元式碳信用计画鼓励城市量化减排多模态并为 ITS 部署开闢新的资金筹措管道。同时,在南美、中东和非洲,利雅德、拉各斯和圣地牙哥的待开发区计划儘管起步较晚,透过将互联走廊纳入总体规划,仍实现了两位数的成长。技术转移协议使本地整合商能够采用成熟的架构,ITS(智慧型运输系统)市场正在获得真正的全球发展势头。
其他福利:
- Excel 格式的市场预测 (ME) 表
- 3个月的分析师支持
目录
第一章 引言
- 研究假设和市场定义
- 调查范围
第二章调查方法
第三章执行摘要
第四章 市场状况
- 市场概况
- 市场驱动因素
- 缓解城市拥挤的需求
- 政府为智慧城市和 ITS 提供资金
- 物联网和感测器成本下降
- 用于自适应控制的人工智慧边缘处理
- MaaS 数据收益机会
- 智慧交通系统碳信用收益
- 市场限制
- 资金投入及维运成本高
- 资料隐私与网路风险
- 地方政府采购的人力资源缺口
- 传统 5G/V2X互通性问题
- 价值/供应链分析
- 监管状况
- 技术展望
- 五力分析
- 新进入者的威胁
- 买方的议价能力
- 供应商的议价能力
- 替代品的威胁
- 竞争对手之间的竞争
- 投资/融资趋势
第五章市场规模及成长预测
- 依系统类型
- 智慧型运输管理系统
- 先进的旅行者资讯系统
- 智慧公共交通系统
- 商用车营运
- 智慧型运输收费系统
- 按组件
- 硬体介面板
- 感应器
- 监视录影机
- 软体平台
- 通讯网路
- 监测和检测系统
- 硬体介面板
- 按用途
- 车队管理和资产监控
- 交通监控和事件侦测
- 交通号誌控制
- 停车便利与引导
- 交通执法及收费
- 事故预防与安全系统
- 按运输方式
- 路
- 铁路
- 航空
- 船运
- 按部署模型
- 本地部署
- 云/边缘
- 按最终用户
- 公共机构
- 基础设施公司和特许经营商
- 商业车队营运商
- 按地区
- 北美洲
- 美国
- 加拿大
- 北美其他地区
- 南美洲
- 巴西
- 阿根廷
- 其他南美
- 欧洲
- 德国
- 英国
- 法国
- 义大利
- 西班牙
- 其他欧洲国家
- 亚太地区
- 中国
- 日本
- 印度
- 韩国
- 其他亚太地区
- 中东和非洲
- 中东
- 沙乌地阿拉伯
- 阿拉伯聯合大公国
- 其他中东地区
- 非洲
- 南非
- 迦纳
- 奈及利亚
- 其他非洲国家
- 北美洲
第六章 竞争态势
- 市场集中度
- 策略倡议
- 市占率分析
- 公司简介
- Denso Corporation
- Siemens AG
- Kapsch TrafficCom AG
- Thales Group
- TomTom NV
- Nokia Corporation
- Cubic Corporation
- Q-Free ASA
- TransCore(Roper Tech.)
- Iteris Inc.
- Huawei Technologies Co. Ltd.
- IBM Corporation
- Cisco Systems Inc.
- Hitachi Ltd.
- Advantech Co. Ltd.
- EFKON GmbH
- SWARCO AG
- Sensys Networks Inc.
- Savari Inc.
- Atkins(SNC-Lavalin)
- Continental AG
第七章 市场机会与未来展望
The Intelligent transportation systems market stood at USD 50.26 billion in 2025 and is projected to advance to USD 77.83 billion by 2030, reflecting a brisk 9.40% CAGR.
Expanding urban populations, mounting congestion costs, and stepped-up climate targets are pushing cities to digitize traffic operations and embrace data-driven mobility orchestration. 5G roll-outs, low-cost sensors, and edge AI allow intersection controllers, roadside units, and fleet platforms to act on sub-second conditions instead of fixed schedules. This shift is redefining business models across hardware, software, and services as agencies pivot from capital-intensive, siloed assets to cloud-enabled, subscription-based platforms. Suppliers that can bundle adaptive analytics with lifecycle support and cyber-secure connectivity are positioned to capture the fastest-growing opportunities
Global Intelligent Transport Systems Market Trends and Insights
Government Smart-City and ITS Funding
Public funding programs accelerate deployments by de-risking early capital outlays and standardizing best practices. The Federal Highway Administration dedicated USD 800 million in the United States for the FY 2025 ITS Program to scale safer and more efficient operations. Parallel SMART Grants allocate USD 100 million annually through 2026 to pilot data-enabled community mobility. Similar schemes in the EU's Horizon framework and Japan's SIP initiative unify test beds, cybersecurity baselines, and open-data policies, shortening procurement cycles. Coordinated funding unlocks compounding benefits because intersections, bus fleets, parking assets, and emergency corridors start sharing data under common architectures. This pattern lifts adoption curves beyond what any single program could achieve.
AI Edge-Processing for Adaptive Control
Edge AI pushes inference directly into roadside units and on-board computers, slashing latency below 50 ms for safety-critical maneuvers. The Federal Transit Administration earmarked USD 40 million for cutting-edge public-transport R&D, including low-latency intersection coordination. Self-learning controllers predict queue lengths and adjust phases to prevent blockages before they form, while connected buses exchange priority requests in real time. Edge frameworks also improve resilience: local nodes keep intersections operational if the central cloud link fails. Over time, these distributed architectures will underpin vehicle platooning, cooperative perception, and mixed-mobility orchestration, marking a major inflection point for the intelligent transportation systems market
High Capex & O&M Costs
Intersection kits, communication backbones, and command-center upgrades demand multi-year budgeting that many municipalities struggle to assemble. Real-time adaptive systems carry life-cycle costs that extend far beyond installation, covering firmware updates, calibration, and spare parts. Procurement delays compound the burden: a 2023 GAO investigation found agencies often accept outdated hardware because tender cycles outlast technology refresh cadences. Public-private partnerships and performance-based contracts are emerging countermeasures, but stakeholders still weigh paybacks against debt ceilings, especially where competing social-infrastructure priorities exist.
Other drivers and restraints analyzed in the detailed report include:
- Urban Congestion Mitigation Demand
- Falling IoT and Sensor Costs
- Data Privacy and Cyber-Risk Exposure
For complete list of drivers and restraints, kindly check the Table Of Contents.
Segment Analysis
Mature Advanced Traffic Management Systems currently underpin the intelligent transportation systems market size, holding roughly 32.21% of global revenue in 2024. Integrated CCTV, loop detectors, and dynamic message signs enable agencies to smooth traffic flow, lower crash rates, and coordinate incident response. Growth is steady rather than spectacular because many metropolitan areas already operate first-generation platforms, yet upgrades around AI prediction and 5G backhaul sustain a solid pipeline.
Advanced Public Transportation Systems now record the fastest climb - 15.34% CAGR-driven by electrified bus fleets, account-based ticketing, and real-time passenger information. Karsan's quiet, sensor-laden e-buses illustrate how OEM innovation converges with cloud dispatch to elevate rider experience while slashing emissions. Across Europe and select North American corridors, integrated head-end platforms feed schedule adherence, occupancy, and energy-use data into multimodal hubs, heralding the shift from car-centric congestion control toward rider-centric network orchestration.
Sensing and communications hardware still accounts for 40.19% of spending, reflecting the capital needed to equip intersections, corridors, and fleets with reliable data collectors. Cameras, radar, lidar, and environmental probes create the raw streams that supervisory algorithms depend on.
Yet the center of gravity is moving: cloud platforms post a 20.65% CAGR as agencies favor pay-as-you-go analytics, digital twin visualization, and API-ready data marketplaces. Iteris' ClearAsset illustrates the appeal-transportation teams can track inventories, schedule preventive maintenance, and justify funding renewals without maintaining servers on-site. Tighter coupling between hardware diagnostics and over-the-air firmware pushes ensures that future upgrades require less fieldwork, prolonging component life and reinforcing the value of integrated stacks within the intelligent transportation systems market.
The Intelligent Transportation System Market Report is Segmented by System Type (Advanced Traffic Management Systems, and More), Component (Hardware Interface Boards, and More), Application (Fleet Management and Asset Monitoring, and More), Transport (Roadways, and More), Deployment Mode (On-Premise and Cloud), End-User, and Geography. The Market Forecasts are Provided in Terms of Value (USD).
Geography Analysis
North America commanded 38.16% of global revenue in 2024, supported by mature telecom networks, federal grants, and early pilot adoption. The National V2X Deployment Plan aims to outfit major U.S. corridors and 75,000 intersections by 2036, setting a roadmap for suppliers and municipalities. Cross-industry forums tackle spectrum, standards, and liability, even as the FCC's final 5.9 GHz allocation leaves only 30 MHz for C-V2X and provokes calls for more efficient waveform design. Cybersecurity remains high on city agendas; the Department of Homeland Security advises uniform 5G protections across connected road assets.
Asia-Pacific is pacing the global field with an 11.54% CAGR to 2030. Massive urbanization, smartphone ubiquity, and green-city mandates propel extensive trials in China, Japan, and South Korea. Taiwan's "Smart City Taiwan" policy illustrates state-enabled clustering: local governments become anchor customers, lifting domestic ICT firms from hardware supply to integrated software services. Mainland pilot corridors apply roadside 5G MEC nodes for centimeter-level positioning and cooperative perception. Regional knowledge transfer accelerates timeline compression, as newly urbanizing areas skip legacy phases and incorporate AI edge logic from day one.
Europe sustains a cohesive regulatory push anchored in decarbonization goals. The TANGENT project, covering Athens, Lisbon, Greater Manchester, and Rennes, spotlights data-interoperability frameworks that streamline multimodal orchestration. Zero-emission transport zones and Euro-style carbon-credit schemes spur cities to quantify avoidance metrics, opening new funding channels for ITS deployments. Meanwhile, South America, the Middle East, and Africa start from smaller bases but log double-digit growth as greenfield smart-city projects in Riyadh, Lagos, and Santiago bake connected corridors into master plans. Technology transfer agreements allow local integrators to adapt proven architectures, ensuring that the intelligent transportation systems market gains truly global momentum.
- Denso Corporation
- Siemens AG
- Kapsch TrafficCom AG
- Thales Group
- TomTom N.V.
- Nokia Corporation
- Cubic Corporation
- Q-Free ASA
- TransCore (Roper Tech.)
- Iteris Inc.
- Huawei Technologies Co. Ltd.
- IBM Corporation
- Cisco Systems Inc.
- Hitachi Ltd.
- Advantech Co. Ltd.
- EFKON GmbH
- SWARCO AG
- Sensys Networks Inc.
- Savari Inc.
- Atkins (SNC-Lavalin)
- Continental AG
Additional Benefits:
- The market estimate (ME) sheet in Excel format
- 3 months of analyst support
TABLE OF CONTENTS
1 Introduction
- 1.1 Study Assumptions and Market Definition
- 1.2 Scope of the Study
2 Research Methodology
3 Executive Summary
4 Market Landscape
- 4.1 Market Overview
- 4.2 Market Drivers
- 4.2.1 Urban congestion mitigation demand
- 4.2.2 Government smart-city and ITS funding
- 4.2.3 Falling IoT and sensor costs
- 4.2.4 AI edge-processing for adaptive control
- 4.2.5 MaaS data-monetisation opportunities
- 4.2.6 Carbon-credit monetisation for ITS
- 4.3 Market Restraints
- 4.3.1 High capex and Operations and Maintenance costs
- 4.3.2 Data privacy and cyber-risk exposure
- 4.3.3 Municipal procurement talent gap
- 4.3.4 Legacy-5G/V2X interoperability issues
- 4.4 Value / Supply-Chain Analysis
- 4.5 Regulatory Landscape
- 4.6 Technological Outlook
- 4.7 Porter's Five Forces
- 4.7.1 Threat of New Entrants
- 4.7.2 Bargaining Power of Buyers
- 4.7.3 Bargaining Power of Suppliers
- 4.7.4 Threat of Substitutes
- 4.7.5 Intensity of Competitive Rivalry
- 4.8 Investment and Funding Trends
5 Market Size and Growth Forecasts (Value (USD))
- 5.1 By System Type
- 5.1.1 Advanced Traffic Management Systems
- 5.1.2 Advanced Traveler Information Systems
- 5.1.3 Advanced Public Transportation Systems
- 5.1.4 Commercial Vehicle Operations
- 5.1.5 Advanced Transportation Pricing/Revenue Systems
- 5.2 By Component
- 5.2.1 Hardware Interface Boards
- 5.2.1.1 Sensors
- 5.2.1.2 Surveillance Cameras
- 5.2.2 Software Platforms
- 5.2.3 Communications Networks
- 5.2.4 Monitoring and Detection Systems
- 5.2.1 Hardware Interface Boards
- 5.3 By Application
- 5.3.1 Fleet Management and Asset Monitoring
- 5.3.2 Traffic Monitoring and Incident Detection
- 5.3.3 Traffic Signal Control
- 5.3.4 Parking Convenience and Guidance
- 5.3.5 Traffic Enforcement and Tolling
- 5.3.6 Accident Avoidance and Safety Systems
- 5.4 By Transportation Mode
- 5.4.1 Roadways
- 5.4.2 Railways
- 5.4.3 Aviation
- 5.4.4 Maritime
- 5.5 By Deployment Model
- 5.5.1 On-Premise
- 5.5.2 Cloud / Edge
- 5.6 By End-User
- 5.6.1 Public Sector Authorities
- 5.6.2 Infrastructure Enterprises and Concessionaires
- 5.6.3 Commercial Fleet Operators
- 5.7 By Geography
- 5.7.1 North America
- 5.7.1.1 United States
- 5.7.1.2 Canada
- 5.7.1.3 Rest of North America
- 5.7.2 South America
- 5.7.2.1 Brazil
- 5.7.2.2 Argentina
- 5.7.2.3 Rest of South America
- 5.7.3 Europe
- 5.7.3.1 Germany
- 5.7.3.2 United Kingdom
- 5.7.3.3 France
- 5.7.3.4 Italy
- 5.7.3.5 Spain
- 5.7.3.6 Rest of Europe
- 5.7.4 Asia-Pacific
- 5.7.4.1 China
- 5.7.4.2 Japan
- 5.7.4.3 India
- 5.7.4.4 South Korea
- 5.7.4.5 Rest of Asia-Pacific
- 5.7.5 Middle East and Africa
- 5.7.5.1 Middle East
- 5.7.5.1.1 Saudi Arabia
- 5.7.5.1.2 United Arab Emirates
- 5.7.5.1.3 Rest of Middle East
- 5.7.5.2 Africa
- 5.7.5.2.1 South Africa
- 5.7.5.2.2 Ghana
- 5.7.5.2.3 Nigeria
- 5.7.5.2.4 Rest of Africa
- 5.7.1 North America
6 Competitive Landscape
- 6.1 Market Concentration
- 6.2 Strategic Moves
- 6.3 Market Share Analysis
- 6.4 Company Profiles (Includes Global level Overview, Market level overview, Core Segments, Financials as available, Strategic Information, Market Rank/Share for key companies, Products and Services, and Recent Developments)
- 6.4.1 Denso Corporation
- 6.4.2 Siemens AG
- 6.4.3 Kapsch TrafficCom AG
- 6.4.4 Thales Group
- 6.4.5 TomTom N.V.
- 6.4.6 Nokia Corporation
- 6.4.7 Cubic Corporation
- 6.4.8 Q-Free ASA
- 6.4.9 TransCore (Roper Tech.)
- 6.4.10 Iteris Inc.
- 6.4.11 Huawei Technologies Co. Ltd.
- 6.4.12 IBM Corporation
- 6.4.13 Cisco Systems Inc.
- 6.4.14 Hitachi Ltd.
- 6.4.15 Advantech Co. Ltd.
- 6.4.16 EFKON GmbH
- 6.4.17 SWARCO AG
- 6.4.18 Sensys Networks Inc.
- 6.4.19 Savari Inc.
- 6.4.20 Atkins (SNC-Lavalin)
- 6.4.21 Continental AG
7 Market Opportunities and Future Outlook
- 7.1 White-space and Unmet-Need Assessment
 全球智慧公共交通市场:预测(至2032年)-依交通途径、解决方案类型、部署方式、技术、最终使用者和地区进行分析
 全球自动驾驶公共运输市场:机会与策略展望(至2034年)2025年全球智慧交通系统市场报告2032 年交通运输系统市场预测:按服务类型、系统类型、运输方式、最终用户和地区进行的全球分析2032 年智慧型运输系统市场预测:按产品、系统、交通途径、应用和地区分類的全球分析
 智慧型运输系统市场(按组件、技术、通讯类型、应用、最终用户和部署模式)—2025-2030 年全球预测
 全球 ITS(智慧型运输系统)市场:公路、铁路、航空、海运、先进交通管理系统、收费和停车管理系统、安全和监控系统以及智慧票务系统 - 预测至 2030 年
 全球公共运输市场
 智慧交通系统市场报告(按交通方式、产品、协定(短距离、长距离、IEEE 1512、交通管理资料字典等)、产品、应用和地区划分,2025 年至 2033 年
 2025-2029年全球智慧型运输系统(ITS)市场