


 |
市场调查报告书
商品编码
1846242
立体显示器:市场占有率分析、产业趋势、统计数据和成长预测(2025-2030 年)Volumetric Display - Market Share Analysis, Industry Trends & Statistics, Growth Forecasts (2025 - 2030) |
||||||
※ 本网页内容可能与最新版本有所差异。详细情况请与我们联繫。
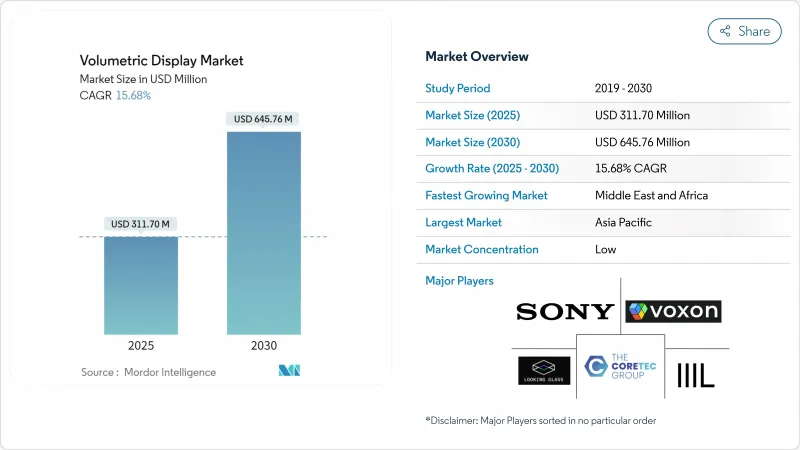
预计到 2025 年,体显示市场规模将达到 3.117 亿美元,到 2030 年将达到 6.4576 亿美元。
在预测期内,这项技术将从实验性创新发展成为手术室、指挥中心和先进驾驶座的核心视觉化平台。对3D解剖成像的强劲需求、国防领域对无玻璃情境察觉主机采购的增加,以及汽车产业向全挡风玻璃3D集群的转变,都推动了这一成长。同时,投影机每流明成本持续下降,即时全息处理器降低了延迟,从而以更低的整体拥有成本实现优质的用户体验。软体创新的不断涌现,正将竞争优势从光学硬体转移到掌控渲染引擎和内容生态系统的公司,重塑体显示市场的差异化格局。
全球体显示市场趋势与洞察
微创手术中三维解剖可视化技术的应用
为了克服平面显示器的空间限制,医院正在整合立体显示技术。例如,RealView Imaging公司的Holoscope-i系统能够投射互动式3D/4D全像图,外科医生可以从任何角度进行观察,从而减轻眼部疲劳并缩短手术时间。一项多机构研究发现,在61%的病例中,手术团队更倾向于使用全像规划而非2D影像,这推动了临床应用的发展。随着萤光导航手术与全像输出技术的融合,相关平台将从简单的检视器发展成为整合式手术主机。采购模式表明,到2027年,这类设备将成为复杂手术室的标配,从而推动立体显示市场硬体的年度需求成长。
国防部门对无玻璃360°情境察觉系统的需求
中东各国军队正在指挥中心部署立体显示器,使多名军官无需佩戴头戴式设备即可共用同一三维战场视图。美国研究实验室资助的测试证实,与二维拼接地图相比,立体显示器能够更快地识别目标并加快任务规划速度。目前情报、监视与侦察(ISR)升级的预算拨款显示,采购工作将稳定持续到2026年,并计画推出无玻璃三维桌面。由于原始设备製造商(OEM)将对产品进行军用规格机壳认证以及防沙防尘认证,因此国防订单为立体显示器市场提供了稳定的收益来源。
亚高清原生解析度的持续存在限制了临床诊断
目前大多数体素显示系统的像素密度都达不到临床医师进行微血管和病理检查的要求。横向解析度低的问题在大型协作工作台上尤为突出,迫使放射科医师必须回到CT工作站取得更精细的影像。虽然对色彩感知全像优化技术的研究正在缩小这一差距,但诊断级原型仍停留在实验室阶段。在像素间距达到数位显微镜的阈值之前,体素显示市场在医疗收益方面将更依赖手术规划而非诊断。
细分市场分析
扫描式体显示架构,凭藉成熟的生产工具和经过现场验证的可靠性,将在 2024 年占据 67.6% 的体显示市场份额。旋转式余辉视觉技术可在紧凑的体积内呈现明亮的影像,使其成为医疗和国防主机的理想选择,因为全像雷射激发图形消除了移动部件并缩短了维护週期。
近期彩色静态体立方体的演示表明,其具有卓越的环境耐受性,吸引了那些无法承受机械振动的实验室。随着全像材料规模的扩大,静态体系统可望削弱扫频体系统的主导地位,推动静态体显示市场到2030年规模超过1.9亿美元。同时掌握这两种技术的供应商将能够有效应对未来客户偏好的波动。
光学硬体(投影机和雷射引擎)仍占 37.1% 的市场份额,因为亮度和色域仍然取决于光子效率。然而,渲染软体和高频宽GPU 的复合年增长率 (CAGR) 正以 16.6% 的速度成长,随着越来越多的消费者需要即时 4K 全像图,它们已超越光学硬体。随着配备全像图专用指令集的处理器进入商用电路板,预计 2025 年至 2030 年间,体显示计算子系统的市场规模将成长近一倍。
为了应对这项挑战,以硬体为中心的公司与游戏引擎供应商合作,捆绑开发工具包(SDK),而纯软体公司则向投影机製造商授权智慧财产权模组(IP)。这种转变重塑了能够在不引入视觉伪影的情况下压缩干涉图案的演算法的价值获取方式,也为立体显示产业的下一轮竞争奠定了基础。
区域分析
到2024年,亚太地区将占据立体显示市场33.2%的份额,其中日本、中国和韩国的大型企业集团将引领这一市场。日本决定在其新版纸币上嵌入全像肖像,标誌着全息显示技术正被主流市场接受,并激励当地的光学元件供应商。韩国通讯业者已进行了5G全息通话的现场演示,吸引了许多企业先导计画。该地区密集的供应商网路有助于缩短前置作业时间并加快产品更新换代速度。
北美位居第二,其中以美国手术机器人製造商和一家将容积式主机整合到其C2套件中的国防研究机构最为突出。联邦政府对先进製造测试平台的资助,提高了中小企业接触这项技术的机会,拓宽了中端市场前景。加拿大安大略省和不列颠哥伦比亚省的医疗技术丛集正在增设临床检验基地,进一步提升了该地区的信誉。
欧洲持续关注汽车整合。一家德国一级供应商与一位光学专家合作,设计了符合联合国欧洲经济委员会(UN ECE)眩光规定的挡风玻璃安装式全像图。欧盟雷射安全标准的製定可能会延缓该技术的普及,但最终会提升标准质量,一旦获得认证,将增强其出口吸引力。
到2030年,中东和非洲地区的复合年增长率将达到17.2%,位居榜首。各国国防部正为联合行动中心采购无玻璃的360度全景工作台。海湾地区的主权财富基金正在资助配备全像投影设施的娱乐中心,这将进一步提升部队的客流量。拉丁美洲也积极采用这项技术,巴西的大学正在工业设计课程中试行建造立体实验室。
其他福利:
- Excel格式的市场预测(ME)表
- 3个月的分析师支持
目录
第一章 引言
- 研究假设和市场定义
- 调查范围
第二章调查方法
第三章执行摘要
第四章 市场情势
- 市场概览
- 市场驱动因素
- 3D解剖视觉化技术在微创手术的应用(北美、欧洲)
- 中东地区对无玻璃360°情境察觉系统的国防需求
- 汽车抬头显示器演变为车用3D仪錶群(德国、日本)
- 媒体和娱乐业转向基于位置的全像景点(亚洲)
- 固体雷射降低了每流明投影成本(全球)
- 电信 5G 部署可实现即时立体远端远距临场系统(美国、韩国)
- 市场限制
- 亚高清原生解析度的持续存在限制了临床诊断
- 与同类中小企业的 3D 视觉化工具相比,其购置成本较高。
- 内容创作生态系统的限制阻碍了其大规模应用。
- 高强度雷射光源安全法规(欧盟)
- 产业生态系分析
- 监理与技术展望
- 波特五力分析
- 新进入者的威胁
- 买方的议价能力
- 供应商的议价能力
- 替代品的威胁
- 竞争对手之间的竞争
第五章 市场规模与成长预测(金额)
- 按显示类型
- 扫描体积显示
- 静态音量显示
- 按组件
- 投影雷射模组
- 显示面板和光学元件
- 渲染软体和GPU硬体
- 全像材料
- 其他组件
- 按显示尺寸
- 可视角度小于 360°(立方体尺寸小于 24 英吋)
- 360°桌面(24吋至40吋立方体)
- 大尺寸(40吋或更大)
- 透过使用
- 医学影像与手术规划
- 远距临场系统和视讯会议
- 教育和培训模拟
- 广告数位电子看板
- 娱乐和游戏
- 工程与设计视觉化
- 国防与安全指挥中心
- 其他用途
- 按最终用户产业
- 医疗保健提供者
- 汽车和运输
- 媒体、体育和娱乐场所
- 工业/製造业
- 航太/国防
- 学术和研究机构
- 其他的
- 按地区
- 北美洲
- 美国
- 加拿大
- 墨西哥
- 欧洲
- 德国
- 英国
- 法国
- 北欧的
- 其他欧洲国家
- 南美洲
- 巴西
- 其他南美
- 亚太地区
- 中国
- 日本
- 印度
- 东南亚
- 其他亚太地区
- 中东和非洲
- 中东
- 波湾合作理事会成员国
- 土耳其
- 其他中东地区
- 非洲
- 南非
- 其他非洲国家
- 北美洲
第六章 竞争格局
- 策略倡议
- 市占率分析
- 公司简介
- Voxon Photonics
- Looking Glass Factory Inc.
- Coretec Group Inc.
- Seekway Technology Ltd.
- Burton Inc.
- Leia Inc.
- LightSpace Technologies
- HoloTech Studios
- SeeReal Technologies
- Sony Corporation
- Magic Leap Inc.
- Google LLC
- Microsoft Corporation
- RealView Imaging Ltd.
- WayRay AG
- zSpace Inc.
- Deepsky Corporation
- Alioscopy
- Holoxica Ltd.
- The 3rd Dimension Technologies
- VividQ
- ForwardX Robotics
- Shenzhen Giant Real Technology
第七章 市场机会与未来展望
The volumetric display market size is valued at USD 311.7 million in 2025 and is on course to expand to USD 645.76 million by 2030, reflecting a sturdy 15.68% CAGR.
Over the forecast period the technology shifts from experimental novelty toward a core visualization platform across operating rooms, command centers, and advanced cockpits. Strong demand for 3D anatomical imaging, growing defense procurement of glass-free situational-awareness consoles, and automotive moves toward full-windshield 3D clusters underpin this climb. In parallel, projector costs per lumen keep falling while real-time hologram processors shorten latency, making premium user experiences available at lower total cost of ownership. Intensifying software innovation is tilting competitive advantage toward firms that control rendering engines and content ecosystems rather than only optical hardware, rewriting the basis of differentiation inside the volumetric display market.
Global Volumetric Display Market Trends and Insights
Adoption of 3D Anatomical Visualization in Minimally Invasive Surgeries
Hospitals integrate volumetric displays to overcome the spatial constraints of flat monitors. Systems such as RealView Imaging's Holoscope-i project interactive 3D/4D holograms that surgeons can inspect from any angle, lowering eye strain and shortening procedure times. Multi-institutional studies show surgical teams preferred holographic planning in 61% of cases over 2D images, reinforcing clinical momentum. As fluorescence-guided surgery merges with holographic output, the platform evolves from simple viewer to integrated surgical console. Purchasing patterns indicate the equipment will be standard in complex surgery suites by 2027, lifting annual hardware demand inside the volumetric display market.
Defense Demand for Glass-Free 360° Situational-Awareness Systems
Armed forces in the Middle East deploy volumetric displays inside command posts to let multiple officers share the same 3D battlespace view without headsets. Tests funded by the US Air Force Research Lab confirm quicker target recognition and mission-planning cycles compared with tiled 2D maps. Budget allocations for ISR upgrades now earmark glass-free 3D tables, signaling steady procurement through 2026. As OEMs certify mil-spec housing and sand-dust tolerance, defense orders form a reliable revenue stream for the volumetric display market.
Persistent Sub-HD Native Resolution Limiting Clinical Diagnostics
Most current volumetric systems fall below the pixel density clinicians need for micro-vascular inspection or pathology review. Lower lateral resolution becomes more pronounced on large collaborative tables, forcing radiologists to revert to CT workstations for fine detail. Research into color-aware holographic optimization is closing the gap, yet diagnostic-grade prototypes remain in labs. Until pixel pitches match digital microscopy thresholds, the volumetric display market must rely on surgical planning rather than diagnostics for medical revenue.
Other drivers and restraints analyzed in the detailed report include:
- Automotive HUD Evolution Toward In-Cabin 3D Instrument Clusters
- Media and Entertainment Pivot to Location-Based Holographic Attractions
- High Acquisition Cost versus Competing 3D Visualization Tools in SMEs
For complete list of drivers and restraints, kindly check the Table Of Contents.
Segment Analysis
Swept-volume architectures capture 67.6% volumetric display market share in 2024 thanks to mature production tooling and field-proven reliability. Rotational persistence of vision enables bright images inside compact footprints, ideal for medical and defense consoles. Static-volume units, though smaller today, post the strongest 17.7% CAGR as holographic-laser-excited graphics eliminate moving parts, slashing maintenance cycles.
Recent demonstrations of color static-volume cubes show excellent environmental robustness, enticing laboratories that cannot tolerate mechanical vibration. As holographic materials scale, static-volume systems are forecast to erode swept-volume dominance, pushing the volumetric display market size for static architectures past USD 190 million by 2030. Vendors that master both paths hedge against future customer preference swings.
Optical hardware-projectors and laser engines-retains 37.1% share because brightness and color gamut still depend on photon efficiency. Yet rendering software and high-bandwidth GPUs accelerate at 16.6% CAGR, outpacing optics as buyers demand real-time 4K holograms. The volumetric display market size for compute subsystems is forecast to nearly double between 2025 and 2030 as processors with hologram-specific instruction sets reach commercial boards.
In response, hardware-centric firms form alliances with game-engine vendors to bundle SDKs, while pure-play software houses license IP blocks to projector manufacturers. The shift recasts value capture toward algorithms that compress interference patterns without visual artifacts, setting the next competitive battleground inside the volumetric display industry.
The Volumetric Display Market Report is Segmented by Display Type (Swept Volume Display, and Static Volume Display), Component (Projectors and Laser Modules, and More), Display Size (Below 360° Viewing Volume, and More), Application (Medical Imaging and Surgical Planning, and More), End-User Industry (Automotive and Transportation, and More), and Geography. The Market Forecasts are Provided in Terms of Value (USD).
Geography Analysis
Asia-Pacific led with 33.2% share of the volumetric display market in 2024, anchored by Japanese, Chinese, and South-Korean conglomerates that combine semiconductor strength with large domestic entertainment spend. Japan's decision to embed holographic portraits in new banknotes signals mainstream acceptance, catalyzing local optics suppliers. South-Korea's telcos demonstrated live 5G hologram calls, drawing enterprise pilot projects. The region's dense supplier base keeps lead-times short, accelerating refresh cycles.
North America ranks second, propelled by US surgical-robot makers and defense labs that integrate volumetric consoles into C2 suites. Federal funding for advanced manufacturing testbeds exposes SMEs to the technology, expanding mid-market prospects. Canada's med-tech clusters in Ontario and British Columbia add clinical validation sites, reinforcing regional credibility.
Europe remains focused on automotive integration. German Tier-1s partner with optics specialists to engineer windshield-embedded holograms compliant with UN ECE glare rules. EU laser-safety norms slow deployments but ultimately raise baseline quality, building export appeal once certificates are issued.
The Middle East and Africa register the highest 17.2% CAGR through 2030 as defense ministries procure glass-free 360° tables for joint-ops centers. Sovereign funds in the Gulf finance entertainment complexes that feature holographic attractions, further boosting unit flow. Latin America shows nascent adoption, with Brazil's universities piloting volumetric labs for industrial design curricula, seeding future demand across the continent.
- Voxon Photonics
- Looking Glass Factory Inc.
- Coretec Group Inc.
- Seekway Technology Ltd.
- Burton Inc.
- Leia Inc.
- LightSpace Technologies
- HoloTech Studios
- SeeReal Technologies
- Sony Corporation
- Magic Leap Inc.
- Google LLC
- Microsoft Corporation
- RealView Imaging Ltd.
- WayRay AG
- zSpace Inc.
- Deepsky Corporation
- Alioscopy
- Holoxica Ltd.
- The 3rd Dimension Technologies
- VividQ
- ForwardX Robotics
- Shenzhen Giant Real Technology
Additional Benefits:
- The market estimate (ME) sheet in Excel format
- 3 months of analyst support
TABLE OF CONTENTS
1 INTRODUCTION
- 1.1 Study Assumptions and Market Definition
- 1.2 Scope of the Study
2 RESEARCH METHODOLOGY
3 EXECUTIVE SUMMARY
4 MARKET LANDSCAPE
- 4.1 Market Overview
- 4.2 Market Drivers
- 4.2.1 Adoption of 3D Anatomical Visualization in Minimally Invasive Surgeries (North America and Europe)
- 4.2.2 Defense Demand for Glass-Free 360° Situational Awareness Systems (Middle East)
- 4.2.3 Automotive HUD Evolution Toward In-Cabin 3D Instrument Clusters (Germany, Japan)
- 4.2.4 Media and Entertainment Pivot to Location-Based Holographic Attractions (Asia)
- 4.2.5 Falling Projection Cost per Lumen via Solid-State Lasers (Global)
- 4.2.6 Telecom 5G Rollout Enabling Real-time Volumetric Telepresence (US, South Korea)
- 4.3 Market Restraints
- 4.3.1 Persistent Sub-HD Native Resolution Limiting Clinical Diagnostics
- 4.3.2 High Acquisition Cost vs. Competing 3D Visualization Tools in SMEs
- 4.3.3 Limited Content Authoring Ecosystem Hindering Mass Adoption
- 4.3.4 Safety Regulations around High-Intensity Laser Sources (EU)
- 4.4 Industry Ecosystem Analysis
- 4.5 Regulatory and Technological Outlook
- 4.6 Porter's Five Forces Analysis
- 4.6.1 Threat of New Entrants
- 4.6.2 Bargaining Power of Buyers
- 4.6.3 Bargaining Power of Suppliers
- 4.6.4 Threat of Substitutes
- 4.6.5 Competitive Rivalry
5 MARKET SIZE AND GROWTH FORECASTS (VALUES)
- 5.1 By Display Type
- 5.1.1 Swept Volume Display
- 5.1.2 Static Volume Display
- 5.2 By Component
- 5.2.1 Projectors and Laser Modules
- 5.2.2 Display Panels and Optical Elements
- 5.2.3 Rendering Software and GPU Hardware
- 5.2.4 Holographic Materials
- 5.2.5 Other Components
- 5.3 By Display Size
- 5.3.1 Below 360° Viewing Volume (Sub 24 inch cube)
- 5.3.2 360° Table-Top (24 inch-40 inch cube)
- 5.3.3 Large-Format (Above 40 inch cube)
- 5.4 By Application
- 5.4.1 Medical Imaging and Surgical Planning
- 5.4.2 Telepresence and Videoconferencing
- 5.4.3 Education and Training Simulations
- 5.4.4 Advertising and Digital Signage
- 5.4.5 Entertainment and Gaming
- 5.4.6 Engineering and Design Visualization
- 5.4.7 Defence and Security Command Centers
- 5.4.8 Other Applications
- 5.5 By End-user Industry
- 5.5.1 Healthcare Providers
- 5.5.2 Automotive and Transportation
- 5.5.3 Media, Sports and Entertainment Venues
- 5.5.4 Industrial and Manufacturing
- 5.5.5 Aerospace and Defence
- 5.5.6 Academic and Research Institutes
- 5.5.7 Others
- 5.6 By Geography
- 5.6.1 North America
- 5.6.1.1 United States
- 5.6.1.2 Canada
- 5.6.1.3 Mexico
- 5.6.2 Europe
- 5.6.2.1 Germany
- 5.6.2.2 United Kingdom
- 5.6.2.3 France
- 5.6.2.4 Nordics
- 5.6.2.5 Rest of Europe
- 5.6.3 South America
- 5.6.3.1 Brazil
- 5.6.3.2 Rest of South America
- 5.6.4 Asia-Pacific
- 5.6.4.1 China
- 5.6.4.2 Japan
- 5.6.4.3 India
- 5.6.4.4 South-East Asia
- 5.6.4.5 Rest of Asia-Pacific
- 5.6.5 Middle East and Africa
- 5.6.5.1 Middle East
- 5.6.5.1.1 Gulf Cooperation Council Countries
- 5.6.5.1.2 Turkey
- 5.6.5.1.3 Rest of Middle East
- 5.6.5.2 Africa
- 5.6.5.2.1 South Africa
- 5.6.5.2.2 Rest of Africa
- 5.6.1 North America
6 COMPETITIVE LANDSCAPE
- 6.1 Strategic Moves
- 6.2 Market Share Analysis
- 6.3 Company Profiles {(includes Global level Overview, Market level overview, Core Segments, Financials as available, Strategic Information, Market Rank/Share for key companies, Products and Services, and Recent Developments)}
- 6.3.1 Voxon Photonics
- 6.3.2 Looking Glass Factory Inc.
- 6.3.3 Coretec Group Inc.
- 6.3.4 Seekway Technology Ltd.
- 6.3.5 Burton Inc.
- 6.3.6 Leia Inc.
- 6.3.7 LightSpace Technologies
- 6.3.8 HoloTech Studios
- 6.3.9 SeeReal Technologies
- 6.3.10 Sony Corporation
- 6.3.11 Magic Leap Inc.
- 6.3.12 Google LLC
- 6.3.13 Microsoft Corporation
- 6.3.14 RealView Imaging Ltd.
- 6.3.15 WayRay AG
- 6.3.16 zSpace Inc.
- 6.3.17 Deepsky Corporation
- 6.3.18 Alioscopy
- 6.3.19 Holoxica Ltd.
- 6.3.20 The 3rd Dimension Technologies
- 6.3.21 VividQ
- 6.3.22 ForwardX Robotics
- 6.3.23 Shenzhen Giant Real Technology
7 MARKET OPPORTUNITIES AND FUTURE OUTLOOK
- 7.1 White-space and Unmet-need Assessment
 3D显示器市场:2026-2032年全球市场预测(依显示技术、部署方式、最终用户和应用程式划分)
 2026年全球体显示市场报告
 2026-2034年全球体显示市场规模、份额、趋势和成长分析报告
 全球体显示市场:依类型、技术、应用和地区划分-市场规模、产业动态、机会分析及预测(2026-2035)
 体显示市场 - 全球产业规模、份额、趋势、机会、预测:按类型、技术、最终用户、地区和竞争格局划分,2021-2031年
 体显示器市场规模、份额及成长分析(依显示器类型、最终用途及地区划分)-2026-2033年产业预测全球 3D 显示器市场规模:依显示器类型、技术、应用、地区、预测
 2032 年立体显示器市场预测:按显示器类型、组件、尺寸、技术、应用和地区进行的全球分析立体显示器市场报告:2030 年趋势、预测与竞争分析
 全球立体显示器市场 2024-2031