


 |
市场调查报告书
商品编码
1846244
表面视觉与检测设备:市场占有率分析、产业趋势与统计、成长预测(2025-2030)Surface Vision & Inspection Equipment - Market Share Analysis, Industry Trends & Statistics, Growth Forecasts (2025 - 2030) |
||||||
※ 本网页内容可能与最新版本有所差异。详细情况请与我们联繫。
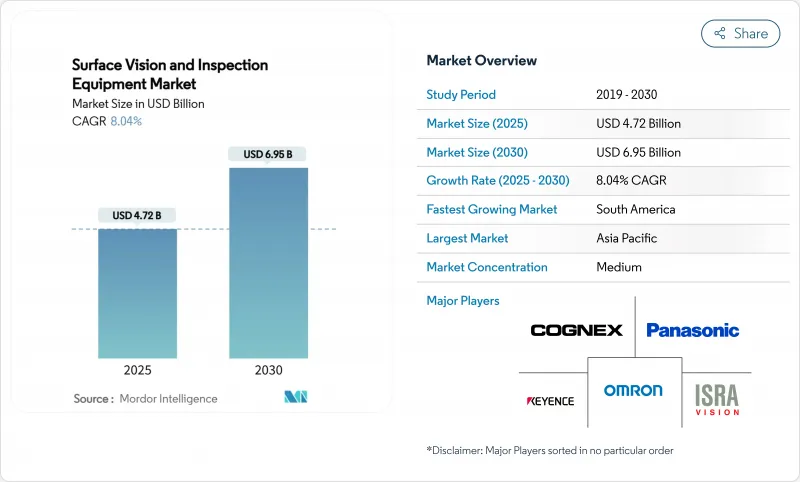
表面视觉和检测设备市场规模预计将在 2025 年产生 47.2 亿美元的收益,到 2030 年将扩大到 69.5 亿美元,在此期间的复合年增长率为 8.04%。
高光谱影像、边缘即时人工智慧 (AI) 推理以及按次付费服务模式的加速应用,正在拓展高级视觉品质保证的覆盖范围。汽车电池生产线、太阳能电池製造和半导体前端营运领域的需求激增,进一步强化了近零缺陷製造的战略价值。同时,互联工业 4.0 架构的扩展,迫使企业将网路安全和资料管治置于其视觉系统蓝图的核心。中端市场製造商对此做出了回应,他们青睐可携式低成本扫描器和计量型的软体订阅,以缩短投资回报週期。
全球表面视觉与检测设备市场趋势与洞察
对低成本高产量製造的需求日益增长
基于影像处理的自动化技术使检查週期从几分钟缩短到几秒钟,同时保持超过99%的检测准确率。中国一些「暗」设施运作的电子工厂正在检验全天候生产模式,并实现15-20%的节能。因此,成本压力增强了离散製造和流程製造领域表面视觉和检测设备市场的需求。
精密工业对零缺陷品质的要求日益提高
先进的半导体节点、电动车电池组和植入式医疗设备要求不存在潜在缺陷。例如,Onto Innovation 报告称,2025 年第一季与 DRAM 和环绕闸极结构相关的收益成长,凸显了检测与晶圆产量比率之间的关联。电池製造商也同样采用全天候视觉分析来预防下游安全故障。因此,表面视觉和检测设备市场正在高可靠性领域吸引更多资本配置。
缺乏熟练的视觉技术人员和整合复杂性
韩国仅有19.5%的中小企业表示已采用智慧工厂。康耐视正努力应对人才缺口,将17%的销售额投入研发,并透过低程式码介面简化设定。然而,人力资本限制仍将限製表面检测和影像处理设备市场的短期扩张速度。
細項分析
到2024年,相机将占总收入的44%,巩固其作为侦测堆迭基本要素的地位。感测器解析度、影格速率和紫外线灵敏度的进步正在扩展半导体后端和Micro-LED生产线的缺陷检测范围。照明和光学元件与这些相机紧密整合,以揭示抛光金属上的微小刮痕并检测透明基板中的空隙。市场区隔的规模支撑着表面视觉和侦测设备市场,确保了互补光学元件和影像撷取卡的批量定价。
儘管基数较小,但预计到2030年,人工智慧视觉平台的复合年增长率将达到9.4%。将捲积卷积类神经网路直接嵌入智慧相机,可以消除先前基于主机的推理所需的延迟。康耐视于2024年4月宣布推出一款整合3D人工智慧设备,显示供应商能够将多个子系统整合到单一机壳中。这种融合将重塑成本结构,并扩大表面视觉和检测设备市场中可实现的用例范围。
由于条码解码、存在性检查和标籤检验等任务几乎不需要深度数据,二维视觉仍保持63%的市场份额。随着生产线速度的提升,这些传统任务将持续带来持续成长的更新收益。同时,人工智慧驱动的配置正以8.8%的复合年增长率快速扩张,能够有效应对光照变化、形状变形以及干扰基于规则的脚本的重迭特征。预计到2030年,受推理引擎成本下降的推动,人工智慧系统的表面视觉和侦测设备市场规模将达到21亿美元。
虽然3D影像在变速箱壳体测量和航太紧固件深度检验等应用领域仍属小众领域,但结构光与神经推理的融合正开始模糊过去的界线。将2D、3D和频谱内容整合到统一软体套件中的供应商,可以在表面视觉和检测设备产业中获得交叉销售溢价。
区域分析
受中国、日本和韩国大型电子和汽车供应链的推动,亚太地区预计在2024年将占全球营收的39%。由于国家政策强化了对「智慧製造」的需求,中国机器视觉供应商在2024年的营收成长了30%以上。韩国每10,000人拥有1,012台机器人,显示该地区对整合智慧光学技术的自动化硬体的需求庞大。
欧洲和北美市场需求持续强劲,尤其是在航太、半导体前端和受监管的医疗设备领域,证明了其高昂的定价是合理的。受电气化和印刷电子计划激增的推动,预计到2030年,北美表面视觉和检测设备市场规模将接近18亿美元。製造商也重视与提供优质服务的供应商的接近性,以避免整合的复杂性。
南美洲是成长最快的地区,复合年增长率达8.4%,这得益于巴西的现代化进程以及阿根廷的汽车和农业设备出口。智利和巴西的电池和太阳能投资为有远见的供应商提供了新的着陆点。儘管中东和非洲仍是新兴市场,但沙乌地阿拉伯和阿联酋不断增长的药品产量正在为未来的应用奠定基础。
其他福利:
- Excel 格式的市场预测 (ME) 表
- 3个月的分析师支持
目录
第一章 引言
- 研究假设和市场定义
- 调查范围
第二章调查方法
第三章执行摘要
第四章 市场状况
- 市场概况
- 市场驱动因素
- 对低成本高产量製造的需求日益增长
- 精密工业对零缺陷品质的要求日益提高
- 采用工业 4.0 和智慧工厂自动化
- 高光谱影像在地下缺陷检测的应用
- 付费侦测服务模式,降低中小企业资金投入门槛
- ESG主导的强制性检查,以减少电池和太阳能电池生产线的废弃物
- 市场限制
- 缺乏熟练的影像处理工程师和整合复杂性
- 高解析度 3D 系统的初始成本高
- 实验室连网中的网路安全风险
- 产品组合的快速变化超出了演算法更新周期
- 价值/供应链分析
- 监管状况
- 技术展望
- 五力分析
- 新进入者的威胁
- 买方的议价能力
- 供应商的议价能力
- 替代品的威胁
- 竞争对手之间的竞争强度
第五章市场规模及成长预测
- 按组件
- 相机
- 照明设备
- 光学设备
- 影像撷取器和处理器
- 软体
- 其他组件
- 依系统类型
- 2D视觉系统
- 3D视觉系统
- 人工智慧视觉系统
- 依部署方式
- 线上/线上检查
- 离线侦测
- 可携式/手持式系统
- 按应用产业
- 车
- 电气和电子
- 半导体和 PCB
- 医疗和医药产品
- 食品、饮料及包装
- 金属和纸张
- 邮政和物流
- 其他行业
- 按地区
- 北美洲
- 美国
- 加拿大
- 墨西哥
- 南美洲
- 巴西
- 阿根廷
- 南美洲其他地区
- 欧洲
- 英国
- 德国
- 法国
- 义大利
- 西班牙
- 其他欧洲国家
- 亚太地区
- 中国
- 日本
- 印度
- 韩国
- ASEAN
- 澳洲
- 纽西兰
- 其他亚太地区
- 中东和非洲
- 中东
- GCC
- 土耳其
- 以色列
- 其他中东地区
- 非洲
- 南非
- 奈及利亚
- 埃及
- 其他非洲国家
- 北美洲
第六章 竞争态势
- 市场集中度
- 策略倡议
- 市占率分析
- 公司简介
- Omron Corporation
- Cognex Corporation
- Keyence Corporation
- Isra Vision AG
- Teledyne DALSA
- Panasonic Corporation
- AMETEK Surface Vision
- Basler AG
- Stemmer Imaging AG
- Matrox Imaging Ltd.
- Edmund Optics Inc.
- Sick AG
- Sony Semiconductor Solutions
- Datalogic SpA
- Shenzhen Sipotek Technology Co., Ltd.
- Daitron Inc.
- Opto Engineering Srl
- FlexFilm Ltd.
- Comvis AG
- Omnitron Sensors
第七章 市场机会与未来展望
The surface vision and inspection equipment market size recorded USD 4.72 billion in revenue in 2025 and is forecast to advance to USD 6.95 billion by 2030, reflecting an 8.04% CAGR over the period.
Accelerating adoption of hyperspectral imaging, real-time artificial intelligence (AI) inference at the edge, and pay-per-inspection service models are widening access to advanced visual quality assurance. Demand spikes in automotive battery lines, solar cell production, and semiconductor front-end fabrication reinforce the strategic value of near-zero-defect manufacturing. In tandem, the escalation of connected Industry 4.0 architectures is prompting corporations to place cybersecurity and data governance at the center of vision-system roadmaps. Mid-sized manufacturers are responding by favoring portable, low-capex scanners and pay-as-you-use software subscriptions that shorten investment payback cycles.
Global Surface Vision & Inspection Equipment Market Trends and Insights
Increasing need for higher manufacturing throughput at lower cost
Vision-enabled automation is enabling processors to compress inspection cycles from minutes to seconds while sustaining >=99% detection accuracy, as evidenced by cutting-tool systems running four-second cycles assemblymag.com. Electronics factories operating as "dark" facilities in China validate the 24/7 production model and capture energy savings of 15-20%. Cost-down pressures therefore reinforce the case for the surface vision and inspection equipment market across discrete and process manufacturing.
Rising demand for zero-defect quality in precision industries
Advanced semiconductor nodes, electric-vehicle battery packs, and implantable medical devices tolerate no latent defects. For example, Onto Innovation reported Q1 2025 revenue growth tied to DRAM and gate-all-around geometries, underscoring inspection's link to wafer yield. Battery cell producers are similarly adopting round-the-clock visual analytics to prevent downstream safety failures. Consequently, the surface vision and inspection equipment market captures rising capital allocations in high-reliability segments.
Scarcity of skilled vision engineers and integration complexity
Only 19.5% of South Korean SMEs report smart-factory uptake, citing limited technical capability as the top hurdle. Cognex is countering the talent gap by channeling 17% of revenue into R&D to simplify setup through low-code interfaces. Yet the human-capital constraint continues to temper the near-term expansion rate of the surface vision and inspection equipment market.
Other drivers and restraints analyzed in the detailed report include:
- Adoption of Industry 4.0 and smart-factory automation
- Emergence of hyperspectral imaging for sub-surface defect detection
- High upfront cost of high-resolution 3D systems
For complete list of drivers and restraints, kindly check the Table Of Contents.
Segment Analysis
Cameras represented 44% of 2024 revenue, cementing their status as the foundational element of any inspection stack. Progress in sensor resolution, frame rate, and ultraviolet sensitivity is expanding the attainable defect envelope in semiconductor back-end and micro-LED lines. Lighting and optics integrate tightly with those cameras to expose fine scratches on polished metals and detect voids in transparent substrates. The segment's scale anchors the surface vision and inspection equipment market and secures volume pricing on complementary optics and frame grabbers.
AI-enabled vision platforms, while a smaller base, are forecast to post a 9.4% CAGR to 2030. Embedding convolutional neural networks directly into smart cameras reduces latencies that previously mandated host-based inference. Cognex's April 2024 launch of an integrated 3D-with-AI device illustrates how suppliers now collapse multiple sub-systems into a single housing. This convergence is set to reshape the cost stack and expand addressable use cases across the surface vision and inspection equipment market.
2D vision keeps a 63% foothold thanks to barcode decoding, presence checks, and label verification that rarely require depth data. These legacy tasks continue to secure incremental refresh revenue as line speeds accelerate. At the same time, AI-enabled configurations are scaling quickly at an 8.8% CAGR, delivering robustness to variable lighting, shape deformation, and overlapping features that confound rule-based scripts. The surface vision and inspection equipment market size for AI-enabled systems is projected to reach USD 2.1 billion by 2030, supported by declining inference-engine costs.
3D imaging remains a niche for applications like gearbox housing measurement or aerospace fastener depth validation, but the blend of structured light and neural inference is starting to blur historical boundaries. Suppliers that merge 2D, 3D, and spectral content within unified software suites stand to capture cross-selling premiums in the surface vision and inspection equipment industry.
The Surface Vision and Inspection Equipment Market Report is Segmented by Component (Camera, Lighting Equipment, and More), System Type (2D Vision Systems, 3D Vision Systems, AI-Enabled Vision Systems), Deployment Mode (In-line/On-line Inspection, Off-Line Inspection, and More), Application Industry (Automotive, Electrical and Electronics, and More), and by Geography. The Market Forecasts are Provided in Terms of Value (USD).
Geography Analysis
Asia Pacific captured 39% of global revenue in 2024, powered by large-scale electronics and auto supply chains in China, Japan, and South Korea. Chinese machine-vision vendors benefited from >=30% sales growth in 2024 as state policies reinforced "smart manufacturing" imperatives. South Korea's robot density of 1,012 units per 10,000 workers illustrates the region's appetite for automation hardware that embeds intelligent optics.
Europe and North America retain robust demand lines anchored in aerospace, semiconductor front-end, and regulated medical-device sectors that justify premium pricing. The surface vision and inspection equipment market size for North America is forecast to approach USD 1.8 billion by 2030 as electrification and printed-electronics projects proliferate. Manufacturers also value proximity to high-service vendors to navigate integration complexity.
South America is the fastest-growing territory with an 8.4% CAGR, underpinned by Brazil's modernization agenda and Argentina's push into automotive and agricultural-equipment exports. Battery and solar investments in Chile and Brazil offer fresh landing zones for vision suppliers. Although Middle East & Africa remains an emerging prospect, rising pharmaceutical production in Saudi Arabia and UAE is laying foundations for future uptake.
- Omron Corporation
- Cognex Corporation
- Keyence Corporation
- Isra Vision AG
- Teledyne DALSA
- Panasonic Corporation
- AMETEK Surface Vision
- Basler AG
- Stemmer Imaging AG
- Matrox Imaging Ltd.
- Edmund Optics Inc.
- Sick AG
- Sony Semiconductor Solutions
- Datalogic S.p.A.
- Shenzhen Sipotek Technology Co., Ltd.
- Daitron Inc.
- Opto Engineering Srl
- FlexFilm Ltd.
- Comvis AG
- Omnitron Sensors
Additional Benefits:
- The market estimate (ME) sheet in Excel format
- 3 months of analyst support
TABLE OF CONTENTS
1 INTRODUCTION
- 1.1 Study Assumptions and Market Definition
- 1.2 Scope of the Study
2 RESEARCH METHODOLOGY
3 EXECUTIVE SUMMARY
4 MARKET LANDSCAPE
- 4.1 Market Overview
- 4.2 Market Drivers
- 4.2.1 Increasing need for higher manufacturing throughput at lower cost
- 4.2.2 Rising demand for zero-defect quality in precision industries
- 4.2.3 Adoption of Industry 4.0 and smart-factory automation
- 4.2.4 Emergence of hyperspectral imaging for sub-surface defect detection
- 4.2.5 Pay-per-inspection service models lowering SME capex barriers
- 4.2.6 ESG-driven mandatory inspection in battery and solar lines to cut waste
- 4.3 Market Restraints
- 4.3.1 Scarcity of skilled vision engineers and integration complexity
- 4.3.2 High upfront cost of high-resolution 3D systems
- 4.3.3 Cyber-security risks in connected inspection networks
- 4.3.4 Rapid product-mix changes outpacing algorithm update cycles
- 4.4 Value / Supply-Chain Analysis
- 4.5 Regulatory Landscape
- 4.6 Technological Outlook
- 4.7 Porter's Five Forces
- 4.7.1 Threat of New Entrants
- 4.7.2 Bargaining Power of Buyers
- 4.7.3 Bargaining Power of Suppliers
- 4.7.4 Threat of Substitutes
- 4.7.5 Intensity of Competitive Rivalry
5 MARKET SIZE AND GROWTH FORECASTS (VALUE)
- 5.1 By Component
- 5.1.1 Camera
- 5.1.2 Lighting Equipment
- 5.1.3 Optics
- 5.1.4 Frame Grabbers and Processors
- 5.1.5 Software
- 5.1.6 Other Components
- 5.2 By System Type
- 5.2.1 2D Vision Systems
- 5.2.2 3D Vision Systems
- 5.2.3 AI-enabled Vision Systems
- 5.3 By Deployment Mode
- 5.3.1 In-line / On-line Inspection
- 5.3.2 Off-line Inspection
- 5.3.3 Portable / Hand-held Systems
- 5.4 By Application Industry
- 5.4.1 Automotive
- 5.4.2 Electrical and Electronics
- 5.4.3 Semiconductor and PCB
- 5.4.4 Medical and Pharmaceuticals
- 5.4.5 Food and Beverage and Packaging
- 5.4.6 Metals and Paper
- 5.4.7 Postal and Logistics
- 5.4.8 Other Industries
- 5.5 By Geography
- 5.5.1 North America
- 5.5.1.1 United States
- 5.5.1.2 Canada
- 5.5.1.3 Mexico
- 5.5.2 South America
- 5.5.2.1 Brazil
- 5.5.2.2 Argentina
- 5.5.2.3 Rest of South America
- 5.5.3 Europe
- 5.5.3.1 United Kingdom
- 5.5.3.2 Germany
- 5.5.3.3 France
- 5.5.3.4 Italy
- 5.5.3.5 Spain
- 5.5.3.6 Rest of Europe
- 5.5.4 Asia Pacific
- 5.5.4.1 China
- 5.5.4.2 Japan
- 5.5.4.3 India
- 5.5.4.4 South Korea
- 5.5.4.5 ASEAN
- 5.5.4.6 Australia
- 5.5.4.7 New Zealand
- 5.5.4.8 Rest of Asia Pacific
- 5.5.5 Middle East and Africa
- 5.5.5.1 Middle East
- 5.5.5.1.1 GCC
- 5.5.5.1.2 Turkey
- 5.5.5.1.3 Israel
- 5.5.5.1.4 Rest of Middle East
- 5.5.5.2 Africa
- 5.5.5.2.1 South Africa
- 5.5.5.2.2 Nigeria
- 5.5.5.2.3 Egypt
- 5.5.5.2.4 Rest of Africa
- 5.5.1 North America
6 COMPETITIVE LANDSCAPE
- 6.1 Market Concentration
- 6.2 Strategic Moves
- 6.3 Market Share Analysis
- 6.4 Company Profiles {(includes Global level Overview, Market level overview, Core Segments, Financials as available, Strategic Information, Market Rank/Share for key companies, Products and Services, and Recent Developments)}
- 6.4.1 Omron Corporation
- 6.4.2 Cognex Corporation
- 6.4.3 Keyence Corporation
- 6.4.4 Isra Vision AG
- 6.4.5 Teledyne DALSA
- 6.4.6 Panasonic Corporation
- 6.4.7 AMETEK Surface Vision
- 6.4.8 Basler AG
- 6.4.9 Stemmer Imaging AG
- 6.4.10 Matrox Imaging Ltd.
- 6.4.11 Edmund Optics Inc.
- 6.4.12 Sick AG
- 6.4.13 Sony Semiconductor Solutions
- 6.4.14 Datalogic S.p.A.
- 6.4.15 Shenzhen Sipotek Technology Co., Ltd.
- 6.4.16 Daitron Inc.
- 6.4.17 Opto Engineering Srl
- 6.4.18 FlexFilm Ltd.
- 6.4.19 Comvis AG
- 6.4.20 Omnitron Sensors
7 MARKET OPPORTUNITIES AND FUTURE OUTLOOK
- 7.1 White-space and Unmet-Need Assessment
 人工智慧驱动的工业机器人市场预测至2034年——全球产品、机器人类型、部署模式、技术、最终用户和区域分析
 AI驱动的工业机器人市场机会、成长要素、产业趋势分析以及2026年至2035年的预测。
 2026年全球表面目视检测市场报告
 表面视觉与检测市场 - 全球产业规模、份额、趋势、机会及预测(按组件、应用、地区和竞争格局划分,2021-2031年)
 表面视觉与检测市场(按组件、技术、类型、应用、最终用途产业和部署模式)—全球预测 2025-20322032 年人工智慧工业视觉市场预测:按组件、部署模式、技术、应用、最终用户和地区进行的全球分析标籤检测机市场预测(至 2032 年):按产品类型、组件、机器类型、技术、应用、最终用户和地区进行的全球分析
 表面视觉检测市场:按组件、类型、应用和地区划分
 表面视觉和检测市场规模、份额、趋势分析报告:按组件、按表麵类型、按系统、按应用、按地区、细分市场预测,2024-2030 年