


 |
市场调查报告书
商品编码
1846245
液体分析仪器:市场份额分析、行业趋势、统计数据和成长预测(2025-2030 年)Liquid Analytical Instrument - Market Share Analysis, Industry Trends & Statistics, Growth Forecasts (2025 - 2030) |
||||||
※ 本网页内容可能与最新版本有所差异。详细情况请与我们联繫。
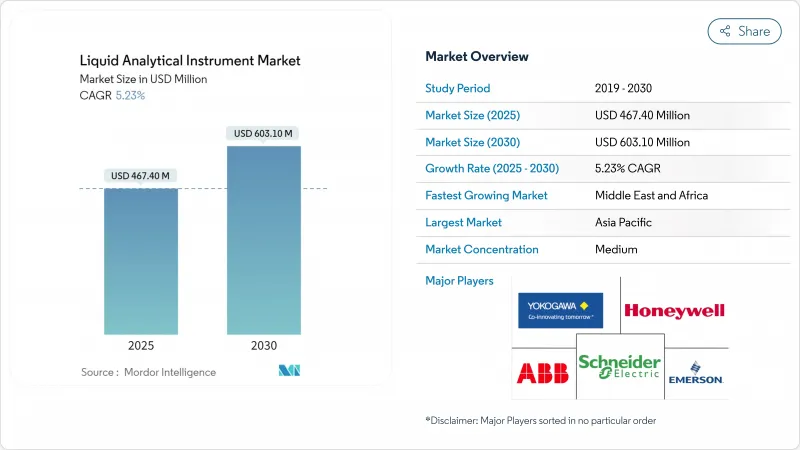
液体分析仪器市场规模预计在 2025 年达到 4.674 亿美元,在 2030 年达到 6.031 亿美元,在此期间的复合年增长率为 5.23%。
公共产业日益增长的合规压力、快速发展的工业自动化以及向智慧感测器平台的转变,正在支撑核心应用领域的稳定成长。半导体製造、一次性生物製程和绿氢能计划中日益严格的水质规范,正在加速对线上pH值、电导率和总有机碳 (TOC) 分析仪的订单。供应商正在将人工智慧融入探头和控制器,使公用事业公司能够从例行检查转向预测性维护,从而降低营运成本并满足更严格的排放法规。亚太地区凭藉着积极的产能扩张,在设备采用方面处于领先地位,而中东地区的海水淡化和电解大型企划正在扩大高盐度仪表的覆盖范围。
全球液体分析仪器市场趋势与洞察
市政公共产业加速采用智慧感测器和工业物联网进行即时水质管理
公用事业公司正在用连续感测器网路取代定期抓取取样,该网路可将加密资料流传输到云端仪表板。辛辛那提公共污水处理区将pH值、电导率和溶氧探头与工业物联网平台整合后,雨水收集能力提高了20%,处理成本降低了90%。即时警报使操作员能够在溢流发生之前转移流量,从而减少了监管罚款和保险索赔。因此,内建无线射频的坚固设备的更换需求高于有线传统设备。在美国和西欧,智慧下水道系统的资金投入正在蓬勃发展,随着各城市对百年老管网进行现代化改造,这为液体分析仪器市场提供了支撑。然而,成功的规模化扩张依赖于能够限制系统整合瓶颈的开放通讯协定。
製药业转向一次性生物加工,需要随线分析
连续生技药品生产需要即时确认纯净水符合美国和欧洲药典的监管限值。 Endress+Hauser 的 CA78/CA79 分析仪提供 50 秒 TOC 读数,具有紫外线氧化和差分电导率检测功能,可为操作员提供即时回馈以调整进料流。线上感测器可减少与离线采样相关的停机时间,同时限制一次性生物反应器中交叉污染的风险。随着美国、爱尔兰和新加坡的生物製药厂的发展,超纯水分析仪供应商正在签订多年的框架合约。新型探头透过自动诊断和智慧验证功能缩短了验证週期,吸引了扩大多分子规模的合约开发和受託製造公司。对基因和细胞治疗生产的监管审查日益严格,进一步推动了对高精度、低维护测量平台的需求。
熟练技术人员的短缺增加了校准和维护停机成本
复杂的分析仪需要定期进行多点校准、隔膜更换以及与认证参考材料相符。许多公用事业公司难以留住技术人员,导致设备停机两週或更长时间,并存在违规的风险。 2025 年对 350 家供水商的调查指出,劳动力差异是数位转型的最大障碍。虽然製造商现在正在添加自清洁接头和远端协助功能,但关键维护仍然需要现场专业知识。当线上探头未通过认证并停止批次时,停机成本会增加。培训计画和扩增实境支援工具只能部分缓解此限制,劳动力可用性仍然是液体分析仪市场采用的长期限制因素。
細項分析
pH/ORP分析仪将占2024年收入的37.8%,这证实了它们在中和、消毒和化学注入过程中的普遍应用。由于监管授权通常会规定排放pH值范围,即使是微小的偏差也可能腐蚀设备或损害生物处理,因此需求强劲。该细分市场受益于微型化、无玻璃感测器,这些感测器能够承受微电子和製药行业使用的高纯度水。由于大多数设施已经配备pH迴路,因此增长将缓慢,但考虑到电极的劣化,更换週期仍然可靠。
总有机碳、化学需氧量和生物需氧量分析仪的复合年增长率最高,预计2030年将达到5.7%。线上紫外线-过硫酸盐TOC系统目前反应时间仅30秒,让操作员即时调整营养物去除曝气。在超纯水成本较高的无尘室中,这些系统的采用与零液体排放目标一致。因此,预计到2030年,TOC分析仪市场将超越传统参数,而传统的批量取样测试的合规性审核仍然具有挑战性。
随着持续监控对分散式控制策略至关重要,随线分析将在2024年贡献54.7%的收入。这些系统透过乙太网路APL将数位讯号传输到监控平台,使操作员能够每隔几秒钟优化一次化学药剂投加量。在全天候运作的工厂中,线上设备是首选,因为手动采样的停机时间会影响产量。带有热插拔墨盒的冗余感测器设计可减少维护时间并提高长期可靠性。
可携式仪表的复合年增长率最高,达到 5.2%,这得益于环境官员和合约服务人员对整个流域进行快速、检验测量的需求。手持式装置现已与智慧型手机配对,使用近红外线微光谱仪在单一比色皿中评估颜色、浊度和硝酸盐。多参数探头减轻了现场工程师的套件负担,蓝牙资料登录支援云报告。因此,液体分析仪市场正积极响应这一需求,推出坚固的 IP67 外壳、感应式充电和通用 USB-C韧体更新,即使在偏远地区也能进行现场韧体实用化。
区域分析
2024年,亚太地区将占全球总收入的34.2%,其中中国大陆、台湾和韩国将安装超纯水厂,为先进的半导体生产线提供水源。该地区每年新增多个300毫米晶圆厂,每个晶圆厂都需要数千个pH值、二氧化硅和电阻率环路来保障晶圆产量比率。新加坡和印度的製药业丛集正在效仿美国GMP规范,安装电导率网络,以即时检验纯水的储存。政府的环保措施正在推动纺织厂和电镀厂的持续监测,从而刺激液体分析设备市场的基准需求。
由于沙乌地阿拉伯和阿联酋强制使用逆渗透海水淡化以确保市政供水,到2030年,中东和非洲的复合年增长率将达到6.3%。基于电解的绿色氢能计画严重依赖海水淡化基础设施,并需要在共用製程岛上安装耐高盐度的感测器。取水口、盐水出口和氢电解槽之间的管道距离较长,需要每公里进行分散式分析,以满足ISO 22734的要求。与全球供应商的伙伴关係将加速服务中心的在地化,并加强区域售后服务网路。
在欧盟关于微量污染物的严格指令下,欧洲保持了稳步增长,棕地炼油厂和石化厂纷纷升级为在线光谱仪,以符合色度计的要求。北美地区在2029年截止日期之前增加了PFAS检测设备的支出。拉丁美洲和非洲的公用事业面临预算限制,但正在获得世界银行的洩漏检测和水质监测资金,以支持其逐步现代化。
其他福利:
- Excel 格式的市场预测 (ME) 表
- 3个月的分析师支持
目录
第一章 引言
- 研究假设和市场定义
- 调查范围
第二章调查方法
第三章执行摘要
第四章 市场状况
- 市场概况
- 市场驱动因素
- 市政当局加速采用智慧感测器和工业物联网进行即时水质管理
- 製药业转向需要线上电导率和 TOC 分析的一次性生物工艺
- 北美和欧盟更严格的 PFAS 和微量污染物排放法规推动了先进分析设备的发展
- 中东地区绿色氢能和海水淡化计划的扩张推动了对高盐度pH/ORP的需求
- 东亚半导体产能快速扩张需要超纯水监测
- 随着食品业转向连续加工,对卫生型 CIP 相容感测器的需求日益增加
- 市场限制
- 熟练技术人员短缺导致校准和维护的停机成本增加
- 光学溶解氧/浊度感测器的交叉敏感性和污垢问题限制了现场的可靠性
- 预算冻结推迟了开发中国家地方政府的更替週期
- 碎片化的通讯协定标准阻碍即插即用集成
- 产业生态系统分析
- 技术展望
- 波特五力分析
- 新进入者的威胁
- 买家/消费者的议价能力
- 供应商的议价能力
- 替代品的威胁
- 竞争对手之间的竞争强度
第五章市场规模及成长预测(金额)
- 按测量参数
- pH/ORP
- 电导率
- 溶氧(DO)
- 浊度
- 总有机碳/COD/BOD
- 氯和残留氯
- 钠和硅酸盐
- 营养分析仪(硝酸盐、磷酸盐等)
- 依设备类型
- 线上/线上分析仪
- 可携式/手持式仪表
- 桌上型/实验室系统
- 按组件
- 分析单元
- 感测器/探头
- 显示器/控制器
- 试剂和耗材
- 软体和整合服务
- 按最终用户产业
- 水和污水处理
- 石油天然气/石化
- 发电(热能、核能、可再生能源)
- 饮食
- 製药和生物技术
- 化学
- 纸浆和造纸
- 半导体和电子
- 金属和采矿
- 其他终端使用者产业(海洋、农业、学术等)
- 按地区
- 北美洲
- 美国
- 加拿大
- 墨西哥
- 欧洲
- 德国
- 英国
- 法国
- 北欧的
- 其他欧洲国家
- 南美洲
- 巴西
- 南美洲其他地区
- 亚太地区
- 中国
- 日本
- 印度
- 东南亚
- 其他亚太地区
- 中东和非洲
- 中东
- 波湾合作理事会成员国
- 土耳其
- 其他中东地区
- 非洲
- 南非
- 其他非洲国家
- 北美洲
第六章 竞争态势
- 市场集中度
- 策略倡议
- 市占率分析
- 公司简介
- Endress+Hauser Group
- Emerson Electric Co.
- Yokogawa Electric Corporation
- ABB Ltd.
- Hach Company(Danaher)
- Schneider Electric SE
- Honeywell International Inc.
- Mettler-Toledo International Inc.
- Teledyne Technologies Inc.
- Thermo Fisher Scientific Inc.
- Xylem Inc.
- Georg Fischer(GF)Piping Systems
- KROHNE Messtechnik GmbH
- Hanna Instruments Inc.
- Burkert Fluid Control Systems
- Horiba Ltd.
- Swan Analytical Instruments AG
- Electro-Chemical Devices Inc.
- Analytical Systems Keco Inc.
- Sensorex(Ametek)
第七章 市场机会与未来展望
The liquid analytical instrument market size is valued at USD 467.4 million in 2025 and is forecast to reach USD 603.1 million by 2030, reflecting a 5.23% CAGR during the period.
Rising compliance pressure on municipal utilities, rapid industrial automation, and a pivot toward smart sensor platforms anchor steady growth across core applications. Semiconductor fabrication, single-use bioprocessing, and green hydrogen projects demand ever-tighter water quality specifications, accelerating orders for inline pH, conductivity, and total organic carbon (TOC) analyzers. Vendors are embedding artificial intelligence into probes and controllers so that utilities can shift from scheduled checks to predictive maintenance, trimming operating expenses while meeting stricter discharge rules. Asia-Pacific leads equipment uptake on the back of aggressive capacity additions, while Middle East megaprojects for desalination and electrolysis expand the addressable base for high-salinity instruments.
Global Liquid Analytical Instrument Market Trends and Insights
Accelerating adoption of smart sensors and IIoT for real-time water quality control in municipal utilities
Utilities are replacing periodic grab sampling with continuous sensor networks that send encrypted data streams to cloud dashboards. Cincinnati's Metropolitan Sewer District raised wet-weather collection capacity by 20% and cut treatment costs by 90% after integrating pH, conductivity, and dissolved oxygen probes with an IIoT platform. Real-time alerts let operators divert flows before overflows occur, which lowers regulatory fines and insurance claims. Ruggedized instruments with built-in wireless radios therefore post stronger replacement demand than cabled legacy devices. The surge in smart sewer funding across the United States and western Europe sustains the liquid analytical instrument market as cities modernize century-old networks. Successful scale-up, however, hinges on open communication protocols that limit system integration bottlenecks.
Pharmaceutical shift to single-use bioprocessing demanding inline conductivity and TOC analytics
Continuous biologics manufacturing mandates instant confirmation that purified water meets United States Pharmacopeia and European Pharmacopoeia limits. Endress+Hauser's CA78/CA79 analyzers provide 50-second TOC readouts with UV oxidation and differential conductivity detection, giving operators immediate feedback to adjust feed streams. Inline sensors reduce downtime associated with off-line sampling while curbing cross-contamination risks in disposable bioreactors. As biopharmaceutical plants multiply across the United States, Ireland, and Singapore, suppliers of ultrapure water analyzers secure multi-year framework agreements. New probes use autodiagnostics and Smart-Verify functions to shorten validation cycles, which appeals to contract development and manufacturing organizations scaling multiple molecules. Growing regulatory scrutiny of gene and cell therapy production further boosts demand for high-accuracy, low-maintenance measurement platforms.
Skilled technician shortage inflating calibration and maintenance downtime costs
Complex analyzers require periodic multi-point calibration, diaphragm replacement, and verification against certified reference materials. Many utilities struggle to secure technicians, extending instrument downtime beyond two weeks and risking compliance breaches. A 2025 survey of 350 water operators identified workforce gaps as the top obstacle to digital transformation. Manufacturers now add self-cleaning junctions and remote-assist features, yet critical maintenance still demands on-site expertise. Downtime costs swell when batch processes halt because an inline probe fails qualification. Training programs and augmented-reality support tools only partly mitigate the constraint, leaving labor availability as a long-term drag on adoption for the liquid analytical instrument market.
Other drivers and restraints analyzed in the detailed report include:
- Tightening PFAS and micro-pollutant discharge limits
- Expansion of green hydrogen and desalination projects in Middle East
- Cross-sensitivity and fouling issues in optical DO/turbidity sensors
For complete list of drivers and restraints, kindly check the Table Of Contents.
Segment Analysis
pH and ORP analyzers held 37.8% of 2024 revenue, underlining their ubiquity across neutralization, disinfection, and chemical dosing processes. Demand persists because regulatory permits often specify discharge pH bands, and even minor deviations can corrode assets or impair biological treatment. The segment benefits from miniaturized glass-free sensors that withstand high-purity water used in microelectronics and pharmaceutical utilities. Growth moderates as most facilities already own pH loops, yet replacement cycles remain dependable given electrode aging.
Total organic carbon, chemical oxygen demand, and biological oxygen demand analyzers record the fastest 5.7% CAGR to 2030 as regulators turn to organic-load metrics for catchment-wide pollution control. Inline UV-persulfate TOC systems now deliver 30-second responses, letting operators adjust nutrient removal aeration in real time. Adoption inside clean-rooms where ultrapure water costs run high aligns with zero-liquid-discharge targets. As a result, the liquid analytical instrument market size for TOC analyzers is projected to outpace legacy parameters through 2030 while challenging traditional batch grab testing for compliance audits.
Inline analyzers contributed 54.7% revenue in 2024 as continuous monitoring became integral to distributed control strategies. These systems stream digital signals over Ethernet-APL to supervisory platforms so operators can optimize chemical dosing every few seconds. Plants running around-the-clock favor inline devices because downtime for manual sampling threatens throughput. Redundant sensor designs with hot-swap cartridges reduce maintenance windows, advancing long-term reliability.
Portable meters deliver the highest 5.2% CAGR because environmental officers and contract service crews need fast verification readings across catchments. Handheld units now pair with smartphones, using near-infrared micro-spectrometers to assess color, turbidity, and nitrate with one cuvette. Multi-parameter probes shrink kit weight for field engineers, and Bluetooth data logging supports cloud reporting. Consequently, the liquid analytical instrument market responds with rugged IP67 housings, inductive charging, and universal USB-C firmware updates that make on-site firmware refresh practical even in remote areas
The Liquid Analytical Instrument Market Report is Segmented by Measurement Parameter (pH/ORP, Conductivity, Turbidity, and More), Instrument Form Factor (In-line/On-line Analyzers, Portable/Hand-held, and More), Component (Analyzer Unit, Sensor/Probe, Display/Controller, and More), End-User Industry (Water and Wastewater Treatment, Chemicals, and More), and Geography. The Market Forecasts are Provided in Terms of Value (USD).
Geography Analysis
Asia-Pacific retained 34.2% of 2024 revenue, with China, Taiwan, and South Korea installing ultrapure water plants to feed advanced semiconductor lines. The region adds multiple 300 mm fabs annually, each requiring thousands of pH, silica, and resistivity loops to guard wafer yields. Pharmaceutical clusters in Singapore and India replicate U.S. GMP practices, installing conductivity networks that verify purified water storage in real time. Government environmental crackdowns enforce continuous monitoring across textile and electroplating parks, adding to baseline demand in the liquid analytical instrument market.
Middle East and Africa posts a 6.3% CAGR through 2030 as Saudi Arabia and United Arab Emirates mandate reverse-osmosis desalination to secure municipal supply. Electrolysis-based green hydrogen initiatives piggyback on desalination infrastructure, requiring high-salinity-tolerant sensors in shared process islands. Long pipeline distances between intake, brine outfall, and hydrogen electrolyzers necessitate distributed analytics every kilometer to meet ISO 22734 requirements. Partnerships with global vendors accelerate localization of service centers, strengthening after-sales networks in the region.
Europe maintains steady growth amid strict Union directives on micro-pollutants, while brownfield refineries and petrochemical plants upgrade to inline spectroscopy for color-number compliance. North America boosts spend on PFAS detection instruments ahead of the 2029 deadline. Latin American and African utilities face budget constraints but receive World Bank funds earmarked for leak-detection and water quality monitoring, supporting gradual modernization.
- Endress+Hauser Group
- Emerson Electric Co.
- Yokogawa Electric Corporation
- ABB Ltd.
- Hach Company (Danaher)
- Schneider Electric SE
- Honeywell International Inc.
- Mettler-Toledo International Inc.
- Teledyne Technologies Inc.
- Thermo Fisher Scientific Inc.
- Xylem Inc.
- Georg Fischer (GF) Piping Systems
- KROHNE Messtechnik GmbH
- Hanna Instruments Inc.
- Burkert Fluid Control Systems
- Horiba Ltd.
- Swan Analytical Instruments AG
- Electro-Chemical Devices Inc.
- Analytical Systems Keco Inc.
- Sensorex (Ametek)
Additional Benefits:
- The market estimate (ME) sheet in Excel format
- 3 months of analyst support
TABLE OF CONTENTS
1 INTRODUCTION
- 1.1 Study Assumptions and Market Definition
- 1.2 Scope of the Study
2 RESEARCH METHODOLOGY
3 EXECUTIVE SUMMARY
4 MARKET LANDSCAPE
- 4.1 Market Overview
- 4.2 Market Drivers
- 4.2.1 Accelerating Adoption of Smart Sensors and IIoT for Real-Time Water Quality Control in Municipal Utilities
- 4.2.2 Pharmaceutical Shift to Single-Use Bioprocessing Demanding Inline Conductivity and TOC Analytics
- 4.2.3 Tightening PFAS and Micro-Pollutant Discharge Limits in North America and EU Driving Advanced Analyzers
- 4.2.4 Expansion of Green Hydrogen and Desalination Projects in Middle East Boosting High-Salinity pH/ORP Demand
- 4.2.5 Rapid Semiconductor capacity Additions in East Asia Requiring Ultrapure Water Monitoring
- 4.2.6 Food Industry's Move to Continuous Processing Elevating Need for Hygienic, CIP-Ready Sensors
- 4.3 Market Restraints
- 4.3.1 Skilled Technician Shortage Inflating Calibration and Maintenance Downtime Costs
- 4.3.2 Cross-Sensitivity and Fouling Issues in Optical DO/Turbidity Sensors Limiting Field Reliability
- 4.3.3 Budget Freezes in Municipal Utilities of Developing Nations Slowing Replacement Cycles
- 4.3.4 Fragmented Communication Protocol Standards Hindering Plug-and-Play Integration
- 4.4 Industry Ecosystem Analysis
- 4.5 Technological Outlook
- 4.6 Porter's Five Forces Analysis
- 4.6.1 Threat of New Entrants
- 4.6.2 Bargaining Power of Buyers/Consumers
- 4.6.3 Bargaining Power of Suppliers
- 4.6.4 Threat of Substitute Products
- 4.6.5 Intensity of Competitive Rivalry
5 MARKET SIZE AND GROWTH FORECASTS (VALUES)
- 5.1 By Measurement Parameter
- 5.1.1 pH/ORP
- 5.1.2 Conductivity
- 5.1.3 Dissolved Oxygen (DO)
- 5.1.4 Turbidity
- 5.1.5 Total Organic Carbon/COD/BOD
- 5.1.6 Chlorine and Residual Chlorine
- 5.1.7 Sodium and Silicate
- 5.1.8 Nutrient Analyzers (Nitrate, Phosphate, etc.)
- 5.2 By Instrument Form Factor
- 5.2.1 In-line/On-line Analyzers
- 5.2.2 Portable/Hand-held Meters
- 5.2.3 Benchtop/Laboratory Systems
- 5.3 By Component
- 5.3.1 Analyzer Unit
- 5.3.2 Sensor/Probe
- 5.3.3 Display/Controller
- 5.3.4 Reagents and Consumables
- 5.3.5 Software and Integration Services
- 5.4 By End-User Industry
- 5.4.1 Water and Wastewater Treatment
- 5.4.2 Oil and Gas/Petrochemical
- 5.4.3 Power Generation (Thermal, Nuclear, Renewables)
- 5.4.4 Food and Beverage
- 5.4.5 Pharmaceuticals and Biotechnology
- 5.4.6 Chemicals
- 5.4.7 Pulp and Paper
- 5.4.8 Semiconductor and Electronics
- 5.4.9 Metals and Mining
- 5.4.10 Other End-User Industries (Marine, Agriculture, Academic, etc.)
- 5.5 By Geography
- 5.5.1 North America
- 5.5.1.1 United States
- 5.5.1.2 Canada
- 5.5.1.3 Mexico
- 5.5.2 Europe
- 5.5.2.1 Germany
- 5.5.2.2 United Kingdom
- 5.5.2.3 France
- 5.5.2.4 Nordics
- 5.5.2.5 Rest of Europe
- 5.5.3 South America
- 5.5.3.1 Brazil
- 5.5.3.2 Rest of South America
- 5.5.4 Asia-Pacific
- 5.5.4.1 China
- 5.5.4.2 Japan
- 5.5.4.3 India
- 5.5.4.4 South-East Asia
- 5.5.4.5 Rest of Asia-Pacific
- 5.5.5 Middle East and Africa
- 5.5.5.1 Middle East
- 5.5.5.1.1 Gulf Cooperation Council Countries
- 5.5.5.1.2 Turkey
- 5.5.5.1.3 Rest of Middle East
- 5.5.5.2 Africa
- 5.5.5.2.1 South Africa
- 5.5.5.2.2 Rest of Africa
- 5.5.1 North America
6 COMPETITIVE LANDSCAPE
- 6.1 Market Concentration
- 6.2 Strategic Moves
- 6.3 Market Share Analysis
- 6.4 Company Profiles (includes Global level Overview, Market level overview, Core Segments, Financials as available, Strategic Information, Market Rank/Share for key companies, Products and Services, and Recent Developments)
- 6.4.1 Endress+Hauser Group
- 6.4.2 Emerson Electric Co.
- 6.4.3 Yokogawa Electric Corporation
- 6.4.4 ABB Ltd.
- 6.4.5 Hach Company (Danaher)
- 6.4.6 Schneider Electric SE
- 6.4.7 Honeywell International Inc.
- 6.4.8 Mettler-Toledo International Inc.
- 6.4.9 Teledyne Technologies Inc.
- 6.4.10 Thermo Fisher Scientific Inc.
- 6.4.11 Xylem Inc.
- 6.4.12 Georg Fischer (GF) Piping Systems
- 6.4.13 KROHNE Messtechnik GmbH
- 6.4.14 Hanna Instruments Inc.
- 6.4.15 Burkert Fluid Control Systems
- 6.4.16 Horiba Ltd.
- 6.4.17 Swan Analytical Instruments AG
- 6.4.18 Electro-Chemical Devices Inc.
- 6.4.19 Analytical Systems Keco Inc.
- 6.4.20 Sensorex (Ametek)
7 MARKET OPPORTUNITIES AND FUTURE OUTLOOK
- 7.1 White-space and Unmet-Need Assessment


