


 |
市场调查报告书
商品编码
1849871
安全和漏洞管理:市场份额分析、行业趋势、统计数据和成长预测(2025-2030 年)Security And Vulnerability Management - Market Share Analysis, Industry Trends & Statistics, Growth Forecasts (2025 - 2030) |
||||||
※ 本网页内容可能与最新版本有所差异。详细情况请与我们联繫。
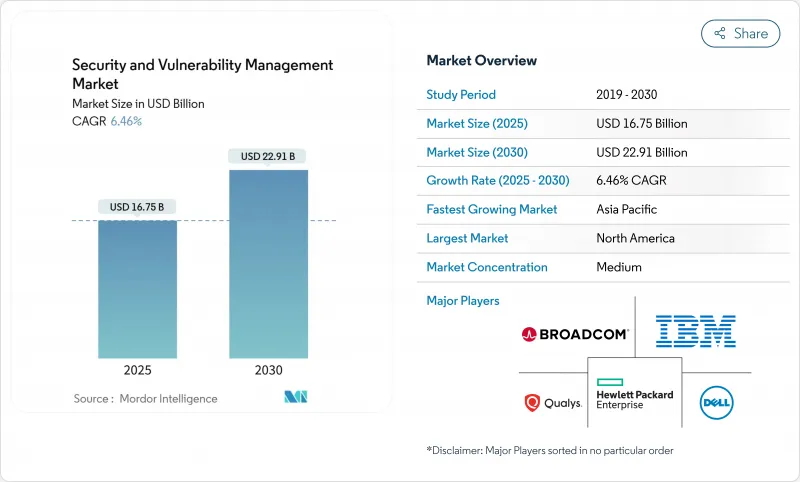
预计2025年安全和漏洞管理市场规模将达到167.5亿美元,到2030年将扩大到229.1亿美元,在此期间的复合年增长率为6.5%。
安全和漏洞管理市场持续受益于强制性网路风险法规、董事会意识的提升以及向统一风险管理平台(旨在抑制工具氾滥)的策略转变。儘管面临宏观经济压力,快速数位化、人工智慧攻击和零信任的采用仍维持了预算成长,显示安全和漏洞管理市场是企业韧性的核心支柱。供应商整合仍然是决定性力量,四分之三的公司正在寻求减少供应商数量,而平台公司正在推动从扫描到自动修復的转变。基于风险的分析如今已超越严重性计数,这反映出安全和漏洞管理市场正与保险公司对承保决策持续可见性的需求保持一致。
全球安全和漏洞管理市场趋势和见解
网路攻击增多且更加复杂
IBM 记录到,透过网路钓鱼窃取资讯的数量年增了 84%,ChatGPT-4 在提供识别码的情况下利用了 87% 的单日 CVE。製造业仍然是最受攻击的行业,因为操作技术的差距容易招致勒索者的攻击。 2024 年,亚太地区的事件数量增加了 13%,进一步提升了其在安全和漏洞管理市场的优先顺序。以身分为中心的入侵目前占漏洞攻击的 30%,而窃取的凭证是主要的存取媒介。因此,安全和漏洞管理市场正在将重点转向优先考虑可用性,而不是一刀切的修补。
云和 DevOps 的快速采用扩大了攻击面
微软进行的一项多重云端风险调查发现,38% 的组织运行着公开暴露、高权限工作负载,且这些工作负载存在严重漏洞。 Palo Alto Networks 发现,80% 的暴露存在于容器化环境中,这凸显了 DevOps 带来的复杂性。虽然 68% 的小型企业声称已实施 DevSecOps,但只有 12% 的企业会扫描每一次提交,这为安全和漏洞管理市场提供了提供内建扫描功能的机会。无代理程式覆盖(例如 Google Cloud 的安全指挥中心)消除了部署阻力,并加速了安全性和漏洞管理市场的采用。
中小型企业的整体拥有成本较高
儘管93%的中小企业主管意识到网路风险,但只有36%的人投资新工具。一项欧洲研究显示,60%遭受网路攻击的中小企业在六个月内关闭,这给预算带来了巨大压力。纽约一家医院估计,小型机构每年的合规遵循成本为5万美元,大型网路每年的合规成本为200万美元。安全性和漏洞管理市场正采用订阅模式来应对这项挑战,该模式将扫描、风险评分和仪表板分析功能捆绑到一个云端许可证中。
細項分析
安全和漏洞管理市场将在2024年实现56亿美元的漏洞评估和彙报,占总收入的33.5%。 RBVM(漏洞管理与漏洞管理)的复合年增长率为7.1%,因为买家瞄准的是3%真正构成风险的缺陷,Tenable收购Vulcan Cyber检验了这项策略。容器和云端工作负载扫描将随着Kubernetes的采用而成长,应用程式安全测试将整合到涵盖程式码、管道和运行时工件的态势管理平台中。
RBVM 产品现在能够收集威胁情报来源、资产关键性评分并利用可用性来产生按排名排序的待办事项列表,而非静态列表。因此,安全和漏洞管理市场正在从检测转向决策支援。修补程式和配置模组对于受监管的垂直产业仍然至关重要,而物联网/营运技术 (IoT/OT) 扫描器则能够解析专有通讯协定以发现韧体漏洞。这种模组的多样性预示着支撑企业更新周期的单一管理平台愿景。
由于银行、国防企业和公共产业在实体边界内保护敏感数据,本地部署将在2024年占据安全和漏洞管理市场的68.9%。儘管如此,到2030年,云端采用率仍将以8.1%的复合年增长率飙升。 Google Cloud的无代理程式漏洞扫描功能增强了SaaS交付的吸引力,因为它消除了软体部署的需要,并加快了概念验证工作。
混合模式正在主导大型企业的蓝图,将内部网路的低延迟扫描与弹性云分析结合。安全性和漏洞管理市场正由此演变成由本地收集器、私有云端节点和超大规模分析组成的网路。策略联合使客户能够充分利用云端的优势,同时满足 NIS2 和 CMMC 的要求,并且任何部署模式都可以满足所有控制框架的要求。
区域分析
到2024年,北美将占据安全和漏洞管理市场的37.4%。 CMMC 2.0和第14144号行政命令等联邦法规正在将持续漏洞管治纳入采购规则。加拿大和墨西哥已针对跨境关键基础设施计划采取了类似的基准,以确保支出的连续性。高昂的违规成本、庞大的技术供应商群体以及活跃的网路保险市场将使其保持领先。
亚太地区未来复合年增长率最高,达7.5%。普华永道预测,2027年亚太地区网路安全支出将达520亿美元,用于因应全球31%的网路事件。澳洲的《2024年网路安全法案》强制执行智慧设备基准,并要求披露勒索软体支付信息,而新西兰的《国家网路安全中心》(NCSC)则负责实施公共部门管控。中国、日本、印度和韩国将推动製造业主导的需求,将安全和漏洞管理市场推向工厂车间和云端。
在欧洲,NIS2 已在 27 个成员国实施,对能源、交通、金融和医疗保健营运商处以最高 1,000 万欧元(1,160 万美元)的罚款。德国、法国、义大利、西班牙和英国已修改其国家法律以符合该指令,并正在建立稳定的计划储备。随着数位服务的成长创造了新的攻击面,以及各国正在製定受欧盟和美国框架启发的策略,南美、中东和非洲地区正呈现新的发展动能。
其他福利:
- Excel 格式的市场预测 (ME) 表
- 3个月的分析师支持
目录
第一章 引言
- 研究假设和市场定义
- 调查范围
第二章调查方法
第三章执行摘要
第四章 市场状况
- 市场概况
- 市场驱动因素
- 网路攻击增多且复杂
- 云和 DevOps 的快速采用扩大了攻击面
- 监理合规和资料主权义务
- 关键基础设施中物联网/营运技术资产的激增
- 网路保险承保需要持续的漏洞可见性
- 整个供应链中的材料清单(SBOM) 义务
- 市场限制
- 中小型企业的整体拥有成本较高
- 网路安全人才短缺
- 漏洞资料过载导致警报疲劳
- 对供应商整合和平台锁定的担忧
- 价值链分析
- 监管格局
- 技术展望
- 波特五力分析
- 供应商的议价能力
- 买方的议价能力
- 新进入者的威胁
- 替代品的威胁
- 竞争对手之间的竞争
- 评估宏观经济趋势对市场的影响
第五章市场规模及成长预测
- 按类型
- 漏洞评估和报告
- 补丁和配置管理
- 基于风险的漏洞管理(RBVM)
- 容器和云端工作负载扫描
- 应用程式安全测试
- IoT/OT 漏洞管理
- 依部署方式
- 本地部署
- 云
- 按组织规模
- 大公司
- 小型企业
- 按最终用户
- BFSI
- 医疗保健和生命科学
- 政府和国防
- 资讯科技和通讯
- 製造业和工业
- 零售与电子商务
- 能源和公共产业
- 其他的
- 按地区
- 北美洲
- 美国
- 加拿大
- 墨西哥
- 欧洲
- 德国
- 英国
- 法国
- 义大利
- 西班牙
- 其他欧洲地区
- 亚太地区
- 中国
- 日本
- 印度
- 韩国
- 澳洲
- 其他亚太地区
- 南美洲
- 巴西
- 阿根廷
- 南美洲其他地区
- 中东和非洲
- 中东
- 沙乌地阿拉伯
- 阿拉伯聯合大公国
- 土耳其
- 其他中东地区
- 非洲
- 南非
- 埃及
- 奈及利亚
- 其他非洲国家
- 北美洲
第六章 竞争态势
- 市场集中度
- 策略趋势
- 市占率分析
- 公司简介
- Tenable Holdings Inc.
- Qualys Inc.
- Rapid7 Inc.
- IBM Corporation
- Cisco Systems Inc.
- Microsoft Corporation
- Broadcom Inc.(Symantec)
- Hewlett Packard Enterprise Company
- Dell Technologies Inc.
- Trend Micro Inc.
- Palo Alto Networks Inc.
- Check Point Software Technologies Ltd.
- CrowdStrike Holdings Inc.
- Fortinet Inc.
- McAfee Corp.
- Tripwire Inc.(Belden)
- Ivanti
- ServiceNow Inc.
- ATandT Cybersecurity(AlienVault)
- Skybox Security Inc.
- F-Secure Corporation
- Flexera Software LLC(Secunia Research)
- Netskope Inc.
第七章 市场机会与未来展望
The Security and Vulnerability Management market size reached USD 16.75 billion in 2025 and is forecast to climb to USD 22.91 billion by 2030, delivering a 6.5% CAGR over the period.
The Security and Vulnerability Management market continues to benefit from mandatory cyber-risk regulations, heightened board awareness, and a strategic shift toward unified exposure-management platforms that limit tool sprawl. Rapid digitization, AI-enabled attacks, and zero-trust adoption sustain budget growth despite macroeconomic pressure, showing the Security and Vulnerability Management market as a core pillar of enterprise resilience. Vendor consolidation remains a defining force because three-quarters of organizations want fewer suppliers, urging platform players to stretch from scanning to automated remediation. Risk-based analytics now outrank raw severity counts, reflecting how the Security and Vulnerability Management market aligns with insurers that demand continuous visibility for underwriting decisions.
Global Security And Vulnerability Management Market Trends and Insights
Rising Volume and Sophistication of Cyber-Attacks
IBM recorded an 84% year-on-year rise in infostealers delivered through phishing, while ChatGPT-4 exploited 87% of one-day CVEs when presented with identifiers, signalling a critical shift in adversarial capabilities. Manufacturing remains the most targeted industry as operational-technology gaps tempt extortionists. The Asia-Pacific region saw a 13% incident increase in 2024, reinforcing its priority within the Security and Vulnerability Management market. Identity-centric intrusions now make up 30% of breaches, turning credential theft into the main access vector. The Security and Vulnerability Management market therefore pivots toward exploitability-led prioritisation rather than blanket patching.
Rapid Cloud and DevOps Adoption Enlarging Attack Surface
Microsoft's multicloud risk study found that 38% of organisations run publicly exposed, highly privileged workloads with critical vulnerabilities. Palo Alto Networks discovered that 80% of exposures sit in containerised environments, underscoring the complexity DevOps introduces. Although 68% of small firms claim DevSecOps practices, only 12% scan at each commit, creating opportunity for the Security and Vulnerability Management market to deliver embedded scanning. Agentless coverage, exemplified by Google Cloud's Security Command Center, removes deployment friction and accelerates adoption across the Security and Vulnerability Management market.
High Total Cost of Ownership for SMEs
Ninety-three percent of SME executives recognise cyber risk, yet only 36% invest in new tools because two-thirds cite cost hurdles. European studies reveal that 60% of breached SMEs shut within six months, illustrating budget tension. Hospitals in New York estimate yearly compliance bills that range from USD 50,000 for small facilities to USD 2 million for large networks. The Security and Vulnerability Management market answers with subscription models that bundle scanning, risk scoring, and dashboard analytics into a single cloud licence.
Other drivers and restraints analyzed in the detailed report include:
- Regulatory Compliance and Data Sovereignty Mandates
- Proliferation of IoT/OT Assets in Critical Infrastructure
- Shortage of Skilled Cybersecurity Talent
For complete list of drivers and restraints, kindly check the Table Of Contents.
Segment Analysis
The Security and Vulnerability Management market size attributed to Vulnerability Assessment and Reporting stood at USD 5.6 billion in 2024, equivalent to 33.5% of total revenue. RBVM is expanding at 7.1% CAGR because buyers target the 3% of flaws that raise real risk, a strategy validated by Tenable's Vulcan Cyber acquisition. Container and cloud workload scanning rise in tandem with Kubernetes adoption, while Application Security Testing integrates into posture-management platforms that cover code, pipeline, and runtime artefacts.
RBVM products now ingest threat-intelligence feeds, asset criticality scores, and exploit availability, generating ranked backlogs rather than static lists. The Security and Vulnerability Management market therefore migrates from detection to decision support. Patch-and-configuration modules remain crucial for regulated verticals, and IoT/OT scanners parse proprietary protocols to uncover firmware weaknesses. This diversity of modules foreshadows a single-pane-of-glass vision that anchors enterprise renewal cycles.
On-premise deployments controlled 68.9% of the Security and Vulnerability Management market in 2024 as banks, defence primes, and utilities protect sensitive data inside physical boundaries. Nonetheless, cloud deployment is surging at an 8.1% CAGR through 2030. Google Cloud's agentless vulnerability scanning eliminates software rollouts and speeds proof-of-concept efforts, raising the attractiveness of SaaS delivery.
Hybrid models dominate large-enterprise roadmaps because they combine low-latency scanning of internal networks with elastic cloud analytics. The Security and Vulnerability Management market thus evolves into a mesh of on-premise collectors, private-cloud nodes, and hyperscale analytics. Policy federations allow customers to meet NIS2 or CMMC obligations while capitalising on cloud benefits, ensuring that no deployment model alone will satisfy every control framework.
The Security and Vulnerability Management Market Report is Segmented by Type (Vulnerability Assessment and Reporting, Patch and Configuration Management, and More), Deployment Mode (On-Premise and Cloud), Organization Size (Large Enterprises and Small and Medium Enterprises (SMEs)), End-User Vertical (BFSI, Healthcare and Life Sciences, and More), and Geography. The Market Forecasts are Provided in Terms of Value (USD).
Geography Analysis
North America dominated the Security and Vulnerability Management market with a 37.4% share in 2024. Federal mandates such as CMMC 2.0 and Executive Order 14144 embed continuous vulnerability governance into procurement rules. Canada and Mexico adopt similar baselines for cross-border critical-infrastructure projects, ensuring spending continuity. High breach costs, a large technology vendor base, and active cyber-insurance markets sustain leadership.
Asia-Pacific registers the highest future CAGR at 7.5%. PwC projects regional cybersecurity outlays of USD 52 billion in 2027 as boards react to a 31% slice of global cyber incidents. Australia's Cyber Security Act 2024 enforces baselines for smart devices and requires ransomware payment disclosure, while New Zealand's NCSC implements public-sector controls. China, Japan, India, and South Korea drive manufacturing-led demand, pushing the Security and Vulnerability Management market into factory floors and cloud stacks alike.
Europe follows a firm path as NIS2 takes effect across 27 member states, subjecting energy, transport, finance, and healthcare operators to penalty levels that reach EUR 10 million (USD 11.60 million). Germany, France, Italy, Spain, and the United Kingdom have adapted domestic legislation to align with the directive, creating steady project pipelines. South America and the Middle East and Africa record emerging momentum because digital services growth exposes fresh attack surfaces, prompting nations to draft strategies that reference EU and U.S. frameworks.
- Tenable Holdings Inc.
- Qualys Inc.
- Rapid7 Inc.
- IBM Corporation
- Cisco Systems Inc.
- Microsoft Corporation
- Broadcom Inc. (Symantec)
- Hewlett Packard Enterprise Company
- Dell Technologies Inc.
- Trend Micro Inc.
- Palo Alto Networks Inc.
- Check Point Software Technologies Ltd.
- CrowdStrike Holdings Inc.
- Fortinet Inc.
- McAfee Corp.
- Tripwire Inc. (Belden)
- Ivanti
- ServiceNow Inc.
- ATandT Cybersecurity (AlienVault)
- Skybox Security Inc.
- F-Secure Corporation
- Flexera Software LLC (Secunia Research)
- Netskope Inc.
Additional Benefits:
- The market estimate (ME) sheet in Excel format
- 3 months of analyst support
TABLE OF CONTENTS
1 INTRODUCTION
- 1.1 Study Assumptions and Market Definition
- 1.2 Scope of the Study
2 RESEARCH METHODOLOGY
3 EXECUTIVE SUMMARY
4 MARKET LANDSCAPE
- 4.1 Market Overview
- 4.2 Market Drivers
- 4.2.1 Rising volume and sophistication of cyber-attacks
- 4.2.2 Rapid cloud and DevOps adoption enlarging attack surface
- 4.2.3 Regulatory compliance and data sovereignty mandates
- 4.2.4 Proliferation of IoT/OT assets in critical infrastructure
- 4.2.5 Cyber-insurance underwriting now requires continuous vulnerability visibility
- 4.2.6 Software Bill of Materials (SBOM) mandates across supply-chains
- 4.3 Market Restraints
- 4.3.1 High total cost of ownership for SMEs
- 4.3.2 Shortage of skilled cybersecurity talent
- 4.3.3 Alert-fatigue from vulnerability data overload
- 4.3.4 Vendor consolidation and platform lock-in concerns
- 4.4 Value Chain Analysis
- 4.5 Regulatory Landscape
- 4.6 Technological Outlook
- 4.7 Porter's Five Forces Analysis
- 4.7.1 Bargaining Power of Suppliers
- 4.7.2 Bargaining Power of Buyers
- 4.7.3 Threat of New Entrants
- 4.7.4 Threat of Substitutes
- 4.7.5 Intensity of Competitive Rivalry
- 4.8 Assessment of the Impact of Macroeconomic Trends on the Market
5 MARKET SIZE AND GROWTH FORECASTS (VALUE)
- 5.1 By Type
- 5.1.1 Vulnerability Assessment and Reporting
- 5.1.2 Patch and Configuration Management
- 5.1.3 Risk-Based Vulnerability Management (RBVM)
- 5.1.4 Container and Cloud Workload Scanning
- 5.1.5 Application Security Testing
- 5.1.6 IoT / OT Vulnerability Management
- 5.2 By Deployment Mode
- 5.2.1 On-premise
- 5.2.2 Cloud
- 5.3 By Organization Size
- 5.3.1 Large Enterprises
- 5.3.2 Small and Medium Enterprises (SMEs)
- 5.4 By End-User Vertical
- 5.4.1 BFSI
- 5.4.2 Healthcare and Life Sciences
- 5.4.3 Government and Defense
- 5.4.4 IT and Telecom
- 5.4.5 Manufacturing and Industrial
- 5.4.6 Retail and E-Commerce
- 5.4.7 Energy and Utilities
- 5.4.8 Others
- 5.5 By Geography
- 5.5.1 North America
- 5.5.1.1 United States
- 5.5.1.2 Canada
- 5.5.1.3 Mexico
- 5.5.2 Europe
- 5.5.2.1 Germany
- 5.5.2.2 United Kingdom
- 5.5.2.3 France
- 5.5.2.4 Italy
- 5.5.2.5 Spain
- 5.5.2.6 Rest of Europe
- 5.5.3 Asia-Pacific
- 5.5.3.1 China
- 5.5.3.2 Japan
- 5.5.3.3 India
- 5.5.3.4 South Korea
- 5.5.3.5 Australia
- 5.5.3.6 Rest of Asia-Pacific
- 5.5.4 South America
- 5.5.4.1 Brazil
- 5.5.4.2 Argentina
- 5.5.4.3 Rest of South America
- 5.5.5 Middle East and Africa
- 5.5.5.1 Middle East
- 5.5.5.1.1 Saudi Arabia
- 5.5.5.1.2 United Arab Emirates
- 5.5.5.1.3 Turkey
- 5.5.5.1.4 Rest of Middle East
- 5.5.5.2 Africa
- 5.5.5.2.1 South Africa
- 5.5.5.2.2 Egypt
- 5.5.5.2.3 Nigeria
- 5.5.5.2.4 Rest of Africa
- 5.5.1 North America
6 COMPETITIVE LANDSCAPE
- 6.1 Market Concentration
- 6.2 Strategic Moves
- 6.3 Market Share Analysis
- 6.4 Company Profiles (includes Global level Overview, Market level overview, Core Segments, Financials as available, Strategic Information, Market Rank/Share for key companies, Products and Services, and Recent Developments)
- 6.4.1 Tenable Holdings Inc.
- 6.4.2 Qualys Inc.
- 6.4.3 Rapid7 Inc.
- 6.4.4 IBM Corporation
- 6.4.5 Cisco Systems Inc.
- 6.4.6 Microsoft Corporation
- 6.4.7 Broadcom Inc. (Symantec)
- 6.4.8 Hewlett Packard Enterprise Company
- 6.4.9 Dell Technologies Inc.
- 6.4.10 Trend Micro Inc.
- 6.4.11 Palo Alto Networks Inc.
- 6.4.12 Check Point Software Technologies Ltd.
- 6.4.13 CrowdStrike Holdings Inc.
- 6.4.14 Fortinet Inc.
- 6.4.15 McAfee Corp.
- 6.4.16 Tripwire Inc. (Belden)
- 6.4.17 Ivanti
- 6.4.18 ServiceNow Inc.
- 6.4.19 ATandT Cybersecurity (AlienVault)
- 6.4.20 Skybox Security Inc.
- 6.4.21 F-Secure Corporation
- 6.4.22 Flexera Software LLC (Secunia Research)
- 6.4.23 Netskope Inc.
7 MARKET OPPORTUNITIES AND FUTURE OUTLOOK
- 7.1 White-space and Unmet-Need Assessment
 修补程式管理市场:按组件、部署类型、组织规模和最终用户产业分類的全球市场预测,2026-2032 年安全与漏洞管理市场:按组件、组织规模、部署模式、应用和产业划分-2026年至2032年全球市场预测
 2026年全球安全与漏洞管理市场报告2026年全球开放原始码漏洞扫描器市场报告2026年全球修补程式和修復软体市场报告2026年全球补丁管理市场报告
 安全与漏洞管理市场规模、份额及成长分析:按组件、解决方案类型、部署模式、安全类型、企业规模、产业和地区划分 - 2026-2033 年产业预测
 安全与漏洞管理市场分析及预测(至 2035 年):按类型、产品类型、服务、技术、组件、应用、部署类型、最终用户和解决方案划分API漏洞扫描器市场按组件类型、部署类型、组织规模和行业划分 - 全球预测,2026-2032年
 全球安全与漏洞管理 (SVM) 市场按解决方案、目标、垂直产业和地区划分-预测至 2030 年