


 |
市场调查报告书
商品编码
1849903
锑:市场占有率分析、产业趋势、统计数据、成长预测(2025-2030 年)Antimony - Market Share Analysis, Industry Trends & Statistics, Growth Forecasts (2025 - 2030) |
||||||
※ 本网页内容可能与最新版本有所差异。详细情况请与我们联繫。
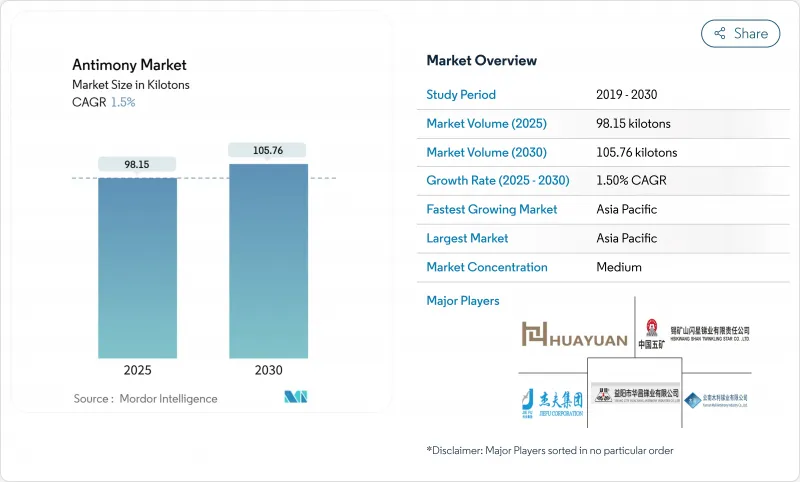
预计到 2025 年锑市场规模将达到 98.15 千吨,到 2030 年将达到 105.76 千吨,预测期(2025-2030 年)复合年增长率为 1.5%。
儘管销售成长较为温和,但背后的变化却十分显着:中国于2024年9月实施的出口限制扰乱了全球供应,导致价格飙升至每吨2.2万美元,单日涨幅高达40%。下游产业正透过原料来源多元化、投资回收利用以及加速锑替代品的研发来应对这项挑战。在欧洲,日益严格的法规对阻燃剂配方提出了更高的要求,而亚太地区电网级电池的快速普及则推动了需求成长。在日益严格的环境监管下,储能技术的创新以及PET树脂产量的復苏仍在持续刺激消费。
全球锑市场趋势与洞察
塑胶产业需求不断成长
建筑、汽车和家电行业的防火安全法规持续推动聚合物向锑基阻燃系统的重大转变。儘管在40%的测试饮料中,锑的浸出量超过了加州的公共卫生标准,但PET生产商仍然依赖锑催化剂来实现高反应速率和理想的颜色。监管压力尚未催生出性能相近且成本更具竞争力的替代催化剂,这使得全球聚合物生产在中期内受到限制。塑胶产业占锑消费量的48%,为锑的生产提供了基准支撑,并进一步推动了锑市场的成长。由于再生PET通常需要添加锑以维持聚合物的质量,因此向循环包装的转变反而增加了对锑的需求。
亚太地区电网级铅酸蓄电池的快速扩张
中国、印度和东南亚的电力公司正在将间歇性可再生能源与采用锑铅合金的成熟铅酸电池系统相结合,这些合金经过优化,可延长循环寿命。电声充电和合金调校技术降低了维护成本,提高了放电深度,使铅酸电池在某些电网中更具竞争力。由于电池栅格合金通常含有1%至6%(重量比)的锑,这些计划正在推动该地区锑的需求成长。在北美,公用事业公司对经济高效的长期储能的需求也为锑市场带来了额外的结构性需求。
欧洲向无卤阻燃剂的转变
欧洲生产商正在逐步淘汰依赖锑协同作用的溴化阻燃剂,并以磷氮阻燃剂取而代之。欧洲化学品管理局的SVHC清单目前包含247种物质,这加大了对锑化合物及其下游卤代化合物的审查力度。原始设备製造商(OEM)的偏好和生态标籤正在巩固这一转变,从长远来看,这将从结构上削弱该地区对锑的需求,儘管全球市场仍然依赖卤锑配方。
细分市场分析
到2024年,三氧化二锑将占总销售量的57%,成为阻燃母粒用锑化学品市场中最大的份额。预计三氧化二锑的消费量将以接近产业整体成长速度的速度成长,儘管面临欧盟法规的不利影响,仍将保持主导。金属锭和五氧化二锑的流通仍主要集中在特种玻璃和电池应用领域,呈现出低成长但稳定的现金流特征。
相较之下,合金细分市场虽然仅占1.66%的市场份额,但随着锑改质锌镁铝涂层在汽车领域的应用日益广泛,该细分市场正呈现强劲成长动能。先导计画已证实,该涂层能够改善耐腐蚀性和微观结构,从而延长车身面板的使用寿命。这个细分市场可望超越整体市场成长速度,并为锑市场中提供客製化合金化学成分的供应商带来更高的利润空间和更紧密的客户关係。
2024年,辉锑矿将占锑原料开采量的96.2%,占锑原料市场的大部分份额。依赖这种单一硫化物矿物的加工会带来集中的地缘政治风险,因为其主要矿床位于中国、俄罗斯和塔吉克斯坦。该矿石会产生富含砷的废弃物,从而增加全球环境管理成本。
在中国以外地区勘探矿床的活动正在增加。美国锑业公司收购阿拉斯加斯蒂布奈特溪3,840英亩的矿区,旨在确保国内供应的稳定性。在澳洲和加拿大类似的多元化投资,反映出锑业正逐步调整策略,以降低锑市场对辉锑矿的依赖,并为未来十年或更长时间内更稳定的供应奠定基础。
区域分析
到2024年,亚太地区将占全球锑消费量的88%,反映出该地区在塑胶、电子和电池领域无可比拟的製造业深度。日本、韩国和印度的买家目前正在与替代供应商签订长期合同,以对冲供应风险。区域能源转型将为铅酸电池和高纯度半导体化合物带来新的结构性需求,从而推动锑市场保持缓慢但稳定的成长,预计到2030年年均复合成长率将达到1.53%。
北美82%的锑依赖进口,用于国防和关键基础设施建设,虽然储量虽小,但战略意义重大。爱达荷州辉锑矿开采计画的核准,将打造美国唯一获得许可的原生矿床,预计矿场寿命期内产量将达1.48亿磅。该计划与阿拉斯加的锑矿计画一道,开始逐步恢復部分锑市场供应链,可望缓解未来对进口的依赖。
欧洲自身也面临监管上的挑战。 REACH法规的合规成本以及向无卤化学的转型正在抑制三氧化硅的生产,而高性能玻璃、陶瓷和电子产品领域的需求则保持着一定的细分市场。正在进行的CoRAP评估带来了不确定性,使得欧洲买家对大规模投资锑基化学品持谨慎态度。然而,汽车和航太应用领域维持了欧洲在全球锑市场的地位,特种阻燃剂的需求弥补了通用阻燃剂吨位的下降。
其他福利:
- Excel格式的市场预测(ME)表
- 3个月的分析师支持
目录
第一章 引言
- 研究假设和市场定义
- 调查范围
第二章调查方法
第三章执行摘要
第四章 市场情势
- 市场概览
- 市场驱动因素
- 塑胶产业需求不断成长
- 亚太地区电网级铅酸蓄电池的快速扩张
- PET树脂的繁荣增加了锑催化剂的消耗量
- 电子产业对锑的需求不断成长
- 新兴经济体对建筑和汽车的需求不断增长
- 市场限制
- 中国不稳定的出口配额导致价格不稳定。
- 欧洲向无卤阻燃剂的过渡
- 欧盟REACH法规对Sb2O3生产商的毒性合规成本
- 价值链分析
- 波特五力模型
- 供应商的议价能力
- 买方的议价能力
- 新进入者的威胁
- 替代品的威胁
- 竞争程度
第五章 市场规模及成长预测(销售)
- 按类型
- 金属锭
- 三氧化锑
- 五氧化二锑
- 合金
- 其他类型
- 依矿石类型
- 辉锑矿
- 其他的
- 透过使用
- 阻燃剂
- 电池
- 催化剂
- 陶瓷和玻璃
- 其他用途
- 按最终用途行业划分
- 塑胶和聚合物
- 汽车与运输
- 化学品和催化剂
- 电子和半导体
- 储能与公用事业
- 其他行业
- 区域生产分析
- 中国
- 俄罗斯
- 澳洲
- 塔吉克
- 玻利维亚
- 缅甸
- 其他国家
- 区域消费分析
- 亚太地区
- 中国
- 印度
- 日本
- 韩国
- 印尼
- 亚太其他地区
- 北美洲
- 美国
- 加拿大
- 墨西哥
- 欧洲
- 德国
- 英国
- 法国
- 义大利
- 西班牙
- 其他欧洲地区
- 南美洲
- 巴西
- 阿根廷
- 智利
- 其他南美洲
- 中东和非洲
- 沙乌地阿拉伯
- 阿拉伯聯合大公国
- 南非
- 其他中东和非洲地区
- 亚太地区
第六章 竞争情势
- 市场集中度
- 策略趋势
- 市占率(%)/排名分析
- 公司简介
- AMG(AMG Advanced Metallurgical Group NV)
- Anhua Huayu Antimony Industry Co.
- Belmont Metals
- Campine NV
- Guangxi Huayuan Metal Chemical Co. Ltd
- Hsikwangshan Twinkling Star Co. Ltd
- Jiefu Corporation
- KOREAZINC
- Lambert Metals International Limited
- Mandalay Resources
- Nihon Seiko Co. Ltd
- Stibium Mining(Consolidated Murchison)
- Suzuhiro Chemical Co. Ltd
- Tri-Star Resources PLC
- United States Antimony Corporation
- Yiyang City Huachang Antimony Industry Co. Ltd
- Yunnan Muli Antimony Industry Co. Ltd
第七章 市场机会与未来展望
The Antimony Market size is estimated at 98.15 kilotons in 2025, and is expected to reach 105.76 kilotons by 2030, at a CAGR of 1.5% during the forecast period (2025-2030).
Expansion is modest in volume terms, yet underlying shifts are substantial: China's September 2024 export controls disrupted global supply, driving prices to USD 22,000 per ton and triggering a 40% single-day price jump. Downstream sectors are responding by searching for diversified raw-material sources, investing in recycling, and accelerating R&D on antimony substitutes. Regulatory tightening in Europe is pressuring flame-retardant formulations, while rapid grid-scale battery deployment in Asia-Pacific is reinforcing demand. Energy-storage innovation, coupled with a resurgence in PET resin output, continues to lift consumption even as environmental scrutiny intensifies.
Global Antimony Market Trends and Insights
Growing demand from the plastic industry
Fire-safety rules in construction, automotive, and consumer electronics continue to move large polymer volumes toward antimony-based flame-retardant systems. PET producers still rely on antimony catalysts that deliver high reaction rates and favorable color even though antimony leaching exceeds California public-health goals in 40% of tested beverages. Regulatory pressure has not yet produced a cost-competitive catalyst alternative with similar performance, so global polymer lines are locked in for the medium term. The plastics sector, already holding 48% of antimony consumption, is therefore underpinning the baseline offtake and supporting incremental growth in the antimony market. Ongoing transition to circular packaging paradoxically lifts demand because recycled PET often requires additional antimony to preserve polymer quality.
Rapid grid-scale lead-acid battery expansion in Asia-Pacific
Utilities in China, India, and Southeast Asia are pairing intermittent renewables with familiar lead-acid systems that now incorporate optimized antimony-lead alloys to extend cycle life. Electro-acoustic charging and alloy tweaks have reduced maintenance and improved depth-of-discharge, making lead-acid competitive for certain grid roles. These projects boost regional antimony pull-through because each battery grid alloy typically contains 1%-6% antimony by weight. Spillover procurement in North America is emerging as utilities seek cost-effective long-duration storage, adding a further layer of structural demand to the antimony market.
Shift toward halogen-free flame retardants in Europe
European producers are phasing out brominated systems that rely on antimony synergy, replacing them with phosphorus-nitrogen chemistries. The European Chemicals Agency's SVHC list now encompasses 247 substances, intensifying scrutiny on antimony compounds and downstream halogenated partners. OEM preferences and eco-labels are cementing this transition, which structurally erodes antimony demand in the region over the long run, even though global markets still rely on halogen-Sb formulations.
Other drivers and restraints analyzed in the detailed report include:
- PET resin boom boosting Sb-catalyst consumption
- Rising demand in the electronics industry
- EU-REACH toxicology compliance costs for Sb2O3 producers
For complete list of drivers and restraints, kindly check the Table Of Contents.
Segment Analysis
Antimony trioxide commanded 57% of 2024 volume, underpinning the largest slice of the antimony market size for chemicals used in flame-retardant masterbatches. Trioxide consumption climbs at a pace near the overall industry, sustaining leadership even under EU regulatory headwinds. Metal ingot and pentoxide streams remain oriented to specialized glass and battery uses, showing low growth yet stable cash-flow characteristics.
In contrast, the alloys segment-holding only 1.66% share-shows outsized momentum as antimony-modified Zn-Mg-Al coatings gain automotive acceptance. Pilot projects demonstrate corrosion-resistance and microstructural improvements that unlock lifespan benefits for exposed body panels. This niche should outpace base-market growth, offering premium margin potential and higher customer stickiness for suppliers that deliver tailored alloy chemistries within the antimony market.
Stibnite contributed 96.2% of mined feedstock in 2024, translating to the vast majority of the antimony market size at the raw-material level. Processing reliance on this single sulfide mineral concentrates geopolitical risk, given that dominant deposits lie in China, Russia, and Tajikistan. The ore generates arsenic-rich waste streams, elevating environmental-management costs worldwide.
The exploration of non-Chinese deposits is rising. United States Antimony Corporation's acquisition of 3,840 acres at Stibnite Creek in Alaska aims to underwrite domestic supply resilience. Similar diversification drives in Australia and Canada reflect a gradual pivot intended to dilute the stibnite concentration in the antimony market, laying groundwork for incremental security of supply over the decade.
The Antimony Market Report Segments the Industry by Type (Metal Ingot, Antimony Trioxide, and More), Ore Type (Stibnite and Others), Application (Flame Retardants, Batteries, and More), End-Use Industry (Plastics and Polymers, Automotive and Transportation, and More), and Geography (Asia-Pacific, North America, Europe, South America, and Middle East and Africa). The Market Forecasts are Provided in Terms of Volume (tons).
Geography Analysis
Asia-Pacific held 88% of antimony consumption in 2024, reflecting unmatched manufacturing depth in plastics, electronics, and batteries. Chinese export permits have upended regional trade flows; Japanese, South-Korean, and Indian buyers now lock in long-term contracts with alternative sources to hedge supply risk. Regional energy transitions add new structural demand for lead-acid storage and high-purity semiconductor compounds, keeping the antimony market on a modest yet consistent expansion path of 1.53% CAGR to 2030.
North America is smaller by volume yet strategically pivotal, importing 82% of antimony for defense and critical infrastructure. Approval of the Stibnite Mine plan in Idaho gives the United States its only permitted primary deposit, with an anticipated output of 148 million pounds across the life-of-mine. This project, alongside Alaskan claims, begins to re-shore part of the antimony market supply chain and could temper future import reliance.
Europe faces unique regulatory compression. REACH compliance costs and the shift toward halogen-free chemistry curb trioxide volumes, while high-performance glass, ceramics, and electronics preserve niche demand. Ongoing CoRAP evaluations inject uncertainty, making European buyers cautious about large-scale investments tied to antimony-based chemistries. Nonetheless, essential automotive and aerospace applications keep the region engaged in the global antimony market, with specialty segments offsetting losses in commoditized flame-retardant tonnage.
- AMG (AMG Advanced Metallurgical Group N.V.)
- Anhua Huayu Antimony Industry Co.
- Belmont Metals
- Campine NV
- Guangxi Huayuan Metal Chemical Co. Ltd
- Hsikwangshan Twinkling Star Co. Ltd
- Jiefu Corporation
- KOREAZINC
- Lambert Metals International Limited
- Mandalay Resources
- Nihon Seiko Co. Ltd
- Stibium Mining (Consolidated Murchison)
- Suzuhiro Chemical Co. Ltd
- Tri-Star Resources PLC
- United States Antimony Corporation
- Yiyang City Huachang Antimony Industry Co. Ltd
- Yunnan Muli Antimony Industry Co. Ltd
Additional Benefits:
- The market estimate (ME) sheet in Excel format
- 3 months of analyst support
TABLE OF CONTENTS
1 Introduction
- 1.1 Study Assumptions and Market Definition
- 1.2 Scope of the Study
2 Research Methodology
3 Executive Summary
4 Market Landscape
- 4.1 Market Overview
- 4.2 Market Drivers
- 4.2.1 Growing Demand from the Plastic Industry
- 4.2.2 Rapid Grid-Scale Lead-Acid Battery Expansion in Asia-Pacific
- 4.2.3 PET Resin Boom Boosting Sb-Catalyst Consumption
- 4.2.4 Rising Demand for Antimony in Electronics Industry
- 4.2.5 Rising Construction and Automotive Demand in Developing Economies
- 4.3 Market Restraints
- 4.3.1 Volatile Chinese Export Quotas Causing Price Instability
- 4.3.2 Shift Toward Halogen-Free Flame Retardants in Europe
- 4.3.3 EU-REACH Toxicology Compliance Costs for Sb2O3 Producers
- 4.4 Value Chain Analysis
- 4.5 Porter's Five Forces
- 4.5.1 Bargaining Power of Suppliers
- 4.5.2 Bargaining Power of Buyers
- 4.5.3 Threat of New Entrants
- 4.5.4 Threat of Substitutes
- 4.5.5 Degree of Competition
5 Market Size and Growth Forecasts ( Volume)
- 5.1 By Type
- 5.1.1 Metal Ingot
- 5.1.2 Antimony Trioxide
- 5.1.3 Antimony Pentoxide
- 5.1.4 Alloys
- 5.1.5 Other Types
- 5.2 By Ore type
- 5.2.1 Stibnite
- 5.2.2 Others
- 5.3 By Application
- 5.3.1 Flame Retardants
- 5.3.2 Batteries
- 5.3.3 Catalysts
- 5.3.4 Ceramics and Glass
- 5.3.5 Other Applications
- 5.4 By End-use Industry
- 5.4.1 Plastics and Polymers
- 5.4.2 Automotive and Transportation
- 5.4.3 Chemicals and Catalysts
- 5.4.4 Electronics and Semiconductor
- 5.4.5 Energy Storage and Utilities
- 5.4.6 Other Industries
- 5.5 By Geography - Production Analysis
- 5.5.1 China
- 5.5.2 Russia
- 5.5.3 Australia
- 5.5.4 Tajikistan
- 5.5.5 Bolivia
- 5.5.6 Myanmar
- 5.5.7 Other Countries
- 5.6 By Geography - Consumption Analysis
- 5.6.1 Asia-Pacific
- 5.6.1.1 China
- 5.6.1.2 India
- 5.6.1.3 Japan
- 5.6.1.4 South Korea
- 5.6.1.5 Indonesia
- 5.6.1.6 Rest of Asia-Pacific
- 5.6.2 North America
- 5.6.2.1 United States
- 5.6.2.2 Canada
- 5.6.2.3 Mexico
- 5.6.3 Europe
- 5.6.3.1 Germany
- 5.6.3.2 United Kingdom
- 5.6.3.3 France
- 5.6.3.4 Italy
- 5.6.3.5 Spain
- 5.6.3.6 Rest of Europe
- 5.6.4 South America
- 5.6.4.1 Brazil
- 5.6.4.2 Argentina
- 5.6.4.3 Chile
- 5.6.4.4 Rest of South America
- 5.6.5 Middle East and Africa
- 5.6.5.1 Saudi Arabia
- 5.6.5.2 United Arab Emirates
- 5.6.5.3 South Africa
- 5.6.5.4 Rest of Middle East and Africa
- 5.6.1 Asia-Pacific
6 Competitive Landscape
- 6.1 Market Concentration
- 6.2 Strategic Moves
- 6.3 Market Share (%)/Ranking Analysis
- 6.4 Company Profiles (includes Global and Market Overview, Core Segments, Financials, Strategic Info, Market Rank/Share, Products and Services, Recent Developments)
- 6.4.1 AMG (AMG Advanced Metallurgical Group N.V.)
- 6.4.2 Anhua Huayu Antimony Industry Co.
- 6.4.3 Belmont Metals
- 6.4.4 Campine NV
- 6.4.5 Guangxi Huayuan Metal Chemical Co. Ltd
- 6.4.6 Hsikwangshan Twinkling Star Co. Ltd
- 6.4.7 Jiefu Corporation
- 6.4.8 KOREAZINC
- 6.4.9 Lambert Metals International Limited
- 6.4.10 Mandalay Resources
- 6.4.11 Nihon Seiko Co. Ltd
- 6.4.12 Stibium Mining (Consolidated Murchison)
- 6.4.13 Suzuhiro Chemical Co. Ltd
- 6.4.14 Tri-Star Resources PLC
- 6.4.15 United States Antimony Corporation
- 6.4.16 Yiyang City Huachang Antimony Industry Co. Ltd
- 6.4.17 Yunnan Muli Antimony Industry Co. Ltd
7 Market Opportunities and Future Outlook
- 7.1 Recycling of Antimony from End-of-Life Lead-Acid Batteries
- 7.2 White-space and Unmet-need Assessment
 全球三氧化二锑市场规模、份额、趋势和成长分析报告(2026-2034年)锑全球市场规模、份额、趋势和成长分析报告(2026-2034)
 2026年全球锑市场报告
 掩蔽化合物市场依固化类型、技术、形态、通路、最终用途产业和应用划分-2026-2032年全球预测电子级砷化氢市场按混合类型、纯度等级、应用、终端用户产业和分销管道划分-2026-2032年全球预测
 锑市场规模、份额及成长分析(按类型、应用、最终用途产业和地区划分)-产业预测(2026-2033 年)
 锑矿:全球市占率及排名、总收入及需求预测(2025-2031年)
 2025-2033年锑市场报告(依产品类型、应用、最终用途产业和地区)
 Stivium 目标市场报告:趋势、预测和竞争分析(至 2031 年)
 锑市场规模、份额、趋势分析报告:按类型、按应用、按地区、细分市场预测,2024-2030