


 |
市场调查报告书
商品编码
1849918
模组化UPS:市场份额分析、行业趋势、统计数据和成长预测(2025-2030年)Modular UPS - Market Share Analysis, Industry Trends & Statistics, Growth Forecasts (2025 - 2030) |
||||||
※ 本网页内容可能与最新版本有所差异。详细情况请与我们联繫。
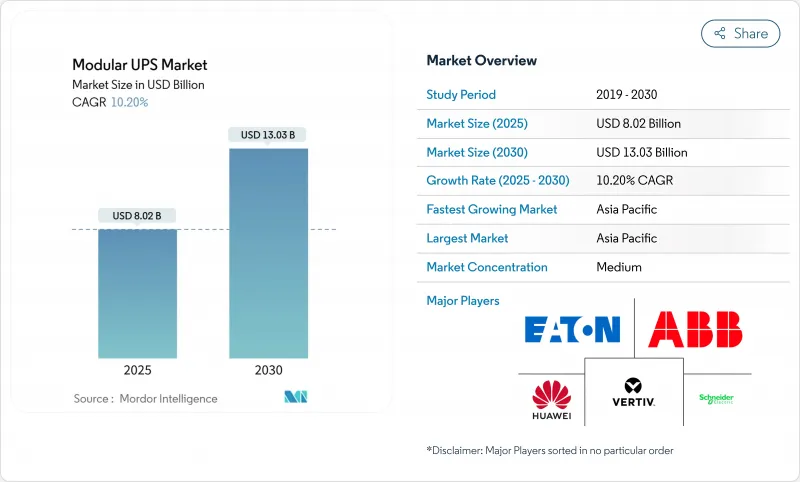
预计到 2025 年,模组化 UPS 市场规模将达到 80.2 亿美元,到 2030 年将达到 130.3 亿美元,在预测期(2025-2030 年)内,复合年增长率将达到 10.20%。
资料中心的快速建置、边缘运算的部署以及严格的执行时间要求将持续推动强劲的需求,而锂离子电池和併网互动设计将使系统功能超越备用电源。以 50 kW 为单位进行扩充可减少閒置容量并加快部署速度。在监管机构在 2024 年发现了超过 20,000 个存在漏洞的 UPS 监控单元后,供应商也透过增强网路安全来提升自身竞争力。亚太地区是规模最大且成长最快的地区,中国、印度和日本正以创纪录的速度建造兆瓦级园区。
全球模组化UPS市场趋势与洞察
超大规模、託管和云端资料中心的成长
超大规模营运商计划在2024年全球整体新增5000兆瓦的容量,这将推动对可扩展电源模组前所未有的需求,以满足分阶段建设的需求。人工智慧训练集群将使机架功耗从10千瓦增加到40千瓦,迫使设计人员部署可在数週内扩展的模组化电源组串,而不是耗时12-18个月的整体式维修。伊顿和西门子能源的合作凸显了这种迫切性。他们标准化的500兆瓦现场解决方案声称可将资料中心建设时间缩短两年,这凸显了业主为何现在将电力架构视为一项竞争优势。此外,采购团队更倾向于选择可安装在预製电气撬装平台上的模组化UPS产品,从而简化审核和试运行。
模组化架构,降低整体拥有成本并提高可扩展性
生命週期研究表明,合理配置容量可减少30-40%的过剩容量,从而抵消比整体式机架高出15-25%的价格溢价。热插拔模组可将平均维修时间从数小时缩短至数分钟,提高服务等级协定 (SLA) 的合规性,并减少对託管服务提供者的罚款。财务长们更倾向于计量收费模式,因为这种模式允许他们将资金投入推迟到实际利用率得到验证之后,这在高利率环境下至关重要。模组化UPS市场也受惠于供应商融资经营租赁模式的日益普及,这种模式将资本支出转化为营运支出,并有助于预算核准。
东南亚和拉丁美洲对价格敏感的买家仍然倾向于选择整体式机柜,因为其购买成本比模组化UPS每千瓦时低15%至25%。即使生命週期分析结果显示模组化UPS具有优势,但优先选择最低竞标的采购政策仍然阻碍了模组化UPS的普及。供应商正在推出基于使用量的融资方案,让客户以类似云端收费的订阅模式添加模组。儘管如此,这种溢价仍是一个显着的阻碍因素,短期内将使模组化UPS市场成长减少1.2个百分点。
细分市场分析
儘管51-100 kVA的UPS产品占2024年总收入的41%,但500 kVA以上的UPS产品成长最快,复合年增长率达14%。这款高阶产品可容纳40 kW的AI机架,目前託管服务供应商普遍采用配备热插拔模组的2 MW机房,以保持弹性。到2030年,该细分市场的模组化UPS规模将达到37亿美元。营运商将模组级冗余和锂离子电池相容性列为关键选择标准。 101-500 kVA等级的UPS产品对于企业资料中心至关重要,因为企业资料中心优先考虑成本和未来扩充性之间的平衡。而50 kVA以下的细分市场则主要面向电信机房和智慧工厂生产线,在这些场所,壁挂式安装至关重要。
宽能带隙半导体技术的进步已将转换效率提升至98%以上,从而在不增加冷却设备规模的情况下实现更高的热密度。菲尼克斯电气的QUINT HP展示了由UPS IQ韧体监控的五个热插拔电池组。至2030年,随着区域边缘核心设施整合为10MW园区,301-500kVA级UPS的出货量将超过101-300kVA等级。这种均衡的需求曲线支撑了模组化UPS市场抵御景气衰退的能力。
资料中心反映了超大规模和託管资料中心的规模扩张,在2024年占支出的48%。工业厂房的复合年增长率达到12.5%,这得益于工业4.0投资为机器人生产线和晶圆厂增加了电力品质保证。模组化UPS在製造业的市占率从2024年到2025年成长了210个基点。半导体工厂由于需要满足亚毫秒的故障復原要求,将UPS容量视为产量比率保障,因此购买了冗余的N+2组UPS,每组UPS可独立运作20分钟。随着5G网路密集化,数千个微型资料中心迅速扩展,电信业者纷纷订购了10kVA的壁挂式UPS模组。
商业建筑和银行、金融服务和保险机构也纷纷效仿,这主要是受到数位银行服务等级协议(SLA)的推动,该协议对停机时间处以惩罚。政府机构正在指定采用微电网设计以满足弹性要求,这一趋势在国防部2024年统一设施控制(UFC)指南中有所阐述。医疗机构则重视热插拔电池,将其应用于感染控制区域,因为在这些区域频繁维护并不现实。
模组化UPS市场按功率容量(小于50KVA、51-100KVA、101-300KVA及其他)、终端用户产业(资料中心、工业製造及其他)、相型(单相和三相)、组件(解决方案和服务)以及地区进行细分。市场预测以美元(USD)计价。
区域分析
亚太地区将引领整个产业,预计2024年营收成长将达到36%,到2030年将维持11.2%的年复合成长率,遥遥领先。中国在解除区域电网建设限制后加快了资料中心审批速度,而印度的数位公共基础设施计画则推动了孟买、海得拉巴和钦奈週边地区超大规模资料中心的建设。日本半导体产业的復苏正为新建工厂注入数十亿美元资金,这些工厂指定使用500kVA以上的锂离子UPS串联电源来降低建筑负载。深圳和清奈的在地化电力电子製造缩短了前置作业时间,在全球零件短缺的情况下提供了关键优势。因此,预计到2030年,亚太地区模组化UPS市场规模将超过50亿美元。
北美位居第二,这主要得益于北维吉尼亚、达拉斯和凤凰城等地成熟的超大规模园区。 PJM 和 ERCOT 的公共产业正积极购买频率调节服务,并鼓励部署电网互动式系统,以实现閒置电池资产的商业价值。美国国防部强制要求在关键任务基地使用微电网相容型 UPS,从而推动了对具备黑启动功能的坚固耐用型 NEMA机壳UPS 的需求。加拿大提出的 Tier 2 能源效率标准将进一步促进无变压器、高效率设计的应用。
在欧洲,碳中和目标和不断上涨的电费正促使企业更加重视99%高效节能的生态模式。英国正在加强永续性评级,德国联邦金融监理局(BaFin)则在监管金融服务供应商的资料中心弹性。两国营运商都在积极采用动态容量调整技术,根据IT负载自动开启或关闭模组,从而减少年度能源浪费。由于可再生能源的丰富供应,託管服务在法国和北欧地区蓬勃发展。该地区也是锂离子电池和钠离子电池试点计画的所在地,例如Natron Energy计划在北卡罗来纳州建造的超级工厂,该工厂的产品将于2026年向欧盟供货。
其他福利:
- Excel格式的市场预测(ME)表
- 3个月的分析师支持
目录
第一章 引言
- 研究假设和市场定义
- 调查范围
第二章调查方法
第三章执行摘要
第四章 市场情势
- 市场概览
- 市场驱动因素
- 超大规模、託管和云端资料中心的成长
- 模组化架构降低了整体拥有成本并扩充性
- 快速部署边缘和 5G 微型资料中心
- 强制性绿色认证促进高效UPS的发展
- 电网互动式UPS用于辅助收入来源
- 适用于关键基础设施的微电网就绪设计
- 市场限制
- 与整体式系统相比,初始投资更高。
- 在IT产业之外,认可度较低
- 电力电子供应链的不稳定性
- 网路UPS中的网路安全风险
- 产业价值链分析
- 监管环境
- 技术展望
- 产业吸引力-波特五力分析
- 供应商的议价能力
- 买方/消费者的议价能力
- 新进入者的威胁
- 替代品的威胁
- 竞争对手之间的竞争
- 影响市场的宏观经济因素
第五章 市场规模与成长预测
- 按功率容量
- 50千伏安或以下
- 51~100kVA
- 101~300kVA
- 301~500kVA
- 500千伏安或以上
- 按最终用户行业划分
- 资料中心
- 工业製造
- 通讯
- 商业建筑
- BFSI
- 政府和公共基础设施
- 卫生保健
- 其他终端用户产业
- 依相位类型
- 单相
- 三相
- 按组件
- 解决方案(硬体)
- 服务
- 按地区
- 北美洲
- 美国
- 加拿大
- 墨西哥
- 南美洲
- 巴西
- 阿根廷
- 智利
- 其他南美洲
- 欧洲
- 英国
- 德国
- 法国
- 义大利
- 西班牙
- 俄罗斯
- 其他欧洲地区
- 亚太地区
- 中国
- 日本
- 印度
- 韩国
- 澳洲
- 马来西亚
- 新加坡
- 亚太其他地区
- 中东和非洲
- 中东
- 沙乌地阿拉伯
- 阿拉伯聯合大公国
- 土耳其
- 其他中东地区
- 非洲
- 南非
- 奈及利亚
- 其他非洲地区
- 北美洲
第六章 竞争情势
- 市场集中度
- 策略趋势
- 市占率分析
- 公司简介
- Schneider Electric SE
- Vertiv Holdings Co.
- Eaton Corporation plc
- ABB Ltd.
- Huawei Technologies Co. Ltd.
- Delta Electronics Inc.
- Riello UPS(Riello Elettronica)
- AEG Power Solutions
- Socomec Group
- Borri SpA
- Kehua Data Co., Ltd.
- KSTAR Science and Technology
- CyberPower Systems, Inc.
- Tripp Lite(by Eaton)
- Gamatronic(SolarEdge)
- Salicru SA
- Piller Power Systems
- Centiel SA
- Hitec Power Protection
- Statron AG
- PowerShield Ltd.
- Fuji Electric Co., Ltd.
- Mitsubishi Electric Corp.
- Toshiba ESS
- Shenzhen Zhicheng Champion Co., Ltd.
- Zhongheng Electric(China UPS)
第七章 投资分析
第八章:市场机会与未来趋势
- 閒置频段与未满足需求评估
The Modular UPS Market size is estimated at USD 8.02 billion in 2025, and is expected to reach USD 13.03 billion by 2030, at a CAGR of 10.20% during the forecast period (2025-2030).
Rapid data-center construction, edge-computing rollouts, and stringent uptime requirements keep demand strong, while lithium-ion batteries and grid-interactive designs expand system functionality beyond standby power. Scaling in 50 kW building blocks reduces stranded capacity and speeds deployment, a decisive advantage as AI workloads lift rack densities. Vendors also differentiate through cybersecurity hardening after regulators highlighted more than 20,000 vulnerable UPS monitoring devices in 2024. Asia-Pacific commands the largest regional footprint and grows fastest as China, India, and Japan commission multi-megawatt campuses at a record pace.
Global Modular UPS Market Trends and Insights
Growth of Hyperscale, Colocation and Cloud Data Centers
Hyperscale operators plan to add 5,000 MW of global capacity in 2024, driving unprecedented demand for scalable power blocks that align with phased build schedules. AI training clusters raise rack power draw from 10 kW to 40 kW, compelling designers to deploy modular strings that can be expanded in weeks rather than the 12-18-month cycle of monolithic retrofits. Collaboration between Eaton and Siemens Energy underscores the urgency; their standardized 500 MW onsite solution claims to trim data-center construction time by two years and underscores why owners now view power architecture as a competitive lever. Procurement teams further prefer modular UPS market products because they fit inside prefabricated electrical skids, streamlining permitting and commissioning. Together, these forces add an estimated 3.2 percentage points to the overall CAGR through 2030.
Lower TCO and Scalability of Modular Architecture
Lifecycle studies indicate that right-sizing cuts stranded capacity by 30-40%, offsetting the 15-25% price premium versus monolithic frames. Hot-swappable modules slash mean-time-to-repair from hours to minutes, which improves SLA compliance and lowers penalty payments for colocation providers. CFOs favor the pay-as-you-grow model because it defers capital until utilization proves out, a vital hedge in high-interest environments. The modular UPS market also benefits from rising adoption of vendor-financed operating leases that convert capex to opex, easing budget approvals. Collectively, incremental scalability contributes 2.4 percentage points to forecast growth.
High Up-Front Capex Versus Monolithic Systems
Price-sensitive buyers in Southeast Asia and Latin America still favor monolithic cabinets that cost 15-25% less per kilowatt at acquisition. Even though lifecycle analyses prove favorable, procurement policies prioritized around the lowest bid continue to delay adoption. Vendors respond with usage-based financing, allowing clients to add modules under subscription models that mimic cloud billing. Nonetheless, the premium remains a meaningful drag, subtracting 1.2 percentage points from modular UPS market expansion over the near term.
Other drivers and restraints analyzed in the detailed report include:
- Rapid Deployment for Edge and 5 G Micro-Data Centers
- Green-Certification Mandates Driving High-Efficiency UPS
- Cyber-Security Risks in Networked UPS
For complete list of drivers and restraints, kindly check the Table Of Contents.
Segment Analysis
The >500 kVA class generated the fastest growth at 14% CAGR, despite 51-100 kVA units holding 41% of 2024 revenue. This upper tier addresses AI racks drawing 40 kW each, and colocation providers now standardize on 2 MW power rooms filled with hot-plug bricks to maintain flexibility. The modular UPS market size for this slice will reach USD 3.7 billion by 2030. Operators cite module-level redundancy and lithium-ion compatibility as primary selection criteria. The 101-500 kVA tiers remain vital for corporate data halls that balance cost with future expansion. The <=50 kVA niche serves telecom shelters and smart-factory lines where wall-mount footprints matter.
Advancements in wide-band-gap semiconductors lift conversion efficiency above 98%, allowing heat-density gains without oversizing cooling plants. Phoenix Contact's QUINT HP demonstrates five hot-swappable battery strings monitored by UPS IQ firmware that predicts remaining life to within 3% accuracy. By 2030, shipments in the 301-500 kVA cohort will overtake the 101-300 kVA class as regional edge-core facilities aggregate into 10 MW campuses. This balanced demand curve underpins the modular UPS market's resilience against cyclical spending dips.
Data centers accounted for 48% of 2024 spending, reflecting hyperscale and colocation scale-out. Industrial plants post 12.5% CAGR as Industry 4.0 investments attach power-quality guarantees to robotics lines and wafer fabs. The modular UPS market share within manufacturing rose 210 basis points between 2024 and 2025. Semiconductor fabs, subject to sub-millisecond ride-through requirements, purchase redundant N+2 strings with 20-minute autonomy, treating UPS capacity as yield insurance. Telecom expanded after 5 G densification triggered thousands of micro data hubs, each ordering 10 kVA wall-mount modules.
Commercial buildings and BFSI follow, driven by digital-banking SLAs that penalize downtime. Government adopters specify microgrid-ready designs to meet resiliency mandates, a trend codified in the 2024 DoD UFC guideline. Healthcare facilities value hot-swap batteries for infection-control zones where frequent maintenance visits are impractical. This broadening end-user base shields the modular UPS market from over-reliance on data centers alone.
Modular UPS Market is Segmented by Power Capacity (<= 50 KVA, 51 - 100 KVA, 101 - 300 KVA, and More), End User Industry ( Data Centers, Industrial Manufacturing, and More), Phase Type (Single-Phase and Three-Phase), Component (Solutions and Services), and Geography. The Market Forecasts are Provided in Terms of Value (USD).
Geography Analysis
Asia-Pacific led the sector with 36% revenue in 2024, and its 11.2% CAGR through 2030 remains unmatched. China accelerated data-center approvals after lifting regional power-grid moratoriums, while India's Digital Public Infrastructure program triggered hyperscale builds around Mumbai, Hyderabad, and Chennai. Japan's semiconductor revival funnels billions into new fabs that specify lithium-ion UPS strings above 500 kVA to cut floor-loading. Local manufacturing of power electronics in Shenzhen and Suzhou reduces lead times, a decisive edge during global component shortages. As a result, the modular UPS market in Asia-Pacific will eclipse USD 5 billion by 2030.
North America ranks second on the back of mature hyperscale campuses in Northern Virginia, Dallas, and Phoenix. Utilities across PJM and ERCOT actively procure frequency-regulation services, encouraging grid-interactive deployments that monetize idle battery assets. The Department of Defense mandates microgrid-compatible UPS for mission-critical bases, elevating demand for ruggedized NEMA enclosures capable of black-start functionality. Canada's proposed Tier 2 energy-efficiency standard further nudges adoption of transformer-less, high-efficiency designs.
Europe follows, propelled by carbon-neutrality targets and rising electricity costs that sharpen the ROI of 99%-efficient eco-modes. The United Kingdom tightens sustainability assessments, and Germany's BaFin regulates data-center resilience for financial services providers. Operators in both nations incorporate dynamic capacity right-sizing that ramps modules on or off to match IT load, cutting annual energy waste. France and the Nordics see brisk colocation growth backed by renewable-energy availability, setting the stage for lithium-ion and sodium-ion battery pilots such as Natron Energy's planned gigafactory in North Carolina, which will ship into the EU by 2026.
- Schneider Electric SE
- Vertiv Holdings Co.
- Eaton Corporation plc
- ABB Ltd.
- Huawei Technologies Co. Ltd.
- Delta Electronics Inc.
- Riello UPS (Riello Elettronica)
- AEG Power Solutions
- Socomec Group
- Borri S.p.A.
- Kehua Data Co., Ltd.
- KSTAR Science and Technology
- CyberPower Systems, Inc.
- Tripp Lite (by Eaton)
- Gamatronic (SolarEdge)
- Salicru S.A.
- Piller Power Systems
- Centiel SA
- Hitec Power Protection
- Statron AG
- PowerShield Ltd.
- Fuji Electric Co., Ltd.
- Mitsubishi Electric Corp.
- Toshiba ESS
- Shenzhen Zhicheng Champion Co., Ltd.
- Zhongheng Electric (China UPS)
Additional Benefits:
- The market estimate (ME) sheet in Excel format
- 3 months of analyst support
TABLE OF CONTENTS
1 INTRODUCTION
- 1.1 Study Assumptions and Market Definition
- 1.2 Scope of the Study
2 RESEARCH METHODOLOGY
3 EXECUTIVE SUMMARY
4 MARKET LANDSCAPE
- 4.1 Market Overview
- 4.2 Market Drivers
- 4.2.1 Growth of Hyperscale, Colocation and Cloud Data Centers
- 4.2.2 Lower TCO and Scalability of Modular Architecture
- 4.2.3 Rapid Deployment for Edge and 5G Micro-Data Centers
- 4.2.4 Green-Certification Mandates Driving High-Efficiency UPS
- 4.2.5 Grid-Interactive UPS for Ancillary Revenue Streams
- 4.2.6 Microgrid-Ready Designs for Critical Infrastructure
- 4.3 Market Restraints
- 4.3.1 High Up-Front Capex Versus Monolithic Systems
- 4.3.2 Limited Awareness Outside IT Verticals
- 4.3.3 Power-Electronics Supply-Chain Volatility
- 4.3.4 Cyber-Security Risks in Networked UPS
- 4.4 Industry Value Chain Analysis
- 4.5 Regulatory Landscape
- 4.6 Technological Outlook
- 4.7 Industry Attractiveness - Porter's Five Forces Analysis
- 4.7.1 Bargaining Power of Suppliers
- 4.7.2 Bargaining Power of Buyers/Consumers
- 4.7.3 Threat of New Entrants
- 4.7.4 Threat of Substitute Products
- 4.7.5 Intensity of Competitive Rivalry
- 4.8 Impact of Macroeconomic Factors on the Market
5 MARKET SIZE AND GROWTH FORECASTS (VALUE)
- 5.1 By Power Capacity
- 5.1.1 <= 50 kVA
- 5.1.2 51 - 100 kVA
- 5.1.3 101 - 300 kVA
- 5.1.4 301 - 500 kVA
- 5.1.5 > 500 kVA
- 5.2 By End User Industry
- 5.2.1 Data Centers
- 5.2.2 Industrial Manufacturing
- 5.2.3 Telecommunications
- 5.2.4 Commercial Buildings
- 5.2.5 BFSI
- 5.2.6 Government and Public Infrastructure
- 5.2.7 Healthcare
- 5.2.8 Other End User Industries
- 5.3 By Phase Type
- 5.3.1 Single-Phase
- 5.3.2 Three-Phase
- 5.4 By Component
- 5.4.1 Solutions (Hardware)
- 5.4.2 Services
- 5.5 By Geography
- 5.5.1 North America
- 5.5.1.1 United States
- 5.5.1.2 Canada
- 5.5.1.3 Mexico
- 5.5.2 South America
- 5.5.2.1 Brazil
- 5.5.2.2 Argentina
- 5.5.2.3 Chile
- 5.5.2.4 Rest of South America
- 5.5.3 Europe
- 5.5.3.1 United Kingdom
- 5.5.3.2 Germany
- 5.5.3.3 France
- 5.5.3.4 Italy
- 5.5.3.5 Spain
- 5.5.3.6 Russia
- 5.5.3.7 Rest of Europe
- 5.5.4 Asia-Pacific
- 5.5.4.1 China
- 5.5.4.2 Japan
- 5.5.4.3 India
- 5.5.4.4 South Korea
- 5.5.4.5 Australia
- 5.5.4.6 Malaysia
- 5.5.4.7 Singapore
- 5.5.4.8 Rest of Asia-Pacific
- 5.5.5 Middle East and Africa
- 5.5.5.1 Middle East
- 5.5.5.1.1 Saudi Arabia
- 5.5.5.1.2 United Arab Emirates
- 5.5.5.1.3 Turkey
- 5.5.5.1.4 Rest of Middle East
- 5.5.5.2 Africa
- 5.5.5.2.1 South Africa
- 5.5.5.2.2 Nigeria
- 5.5.5.2.3 Rest of Africa
- 5.5.1 North America
6 COMPETITIVE LANDSCAPE
- 6.1 Market Concentration
- 6.2 Strategic Moves
- 6.3 Market Share Analysis
- 6.4 Company Profiles (includes Global Overview, Market Overview, Core Segments, Financials, Strategic Info, Market Rank/Share, Products and Services, Recent Developments)
- 6.4.1 Schneider Electric SE
- 6.4.2 Vertiv Holdings Co.
- 6.4.3 Eaton Corporation plc
- 6.4.4 ABB Ltd.
- 6.4.5 Huawei Technologies Co. Ltd.
- 6.4.6 Delta Electronics Inc.
- 6.4.7 Riello UPS (Riello Elettronica)
- 6.4.8 AEG Power Solutions
- 6.4.9 Socomec Group
- 6.4.10 Borri S.p.A.
- 6.4.11 Kehua Data Co., Ltd.
- 6.4.12 KSTAR Science and Technology
- 6.4.13 CyberPower Systems, Inc.
- 6.4.14 Tripp Lite (by Eaton)
- 6.4.15 Gamatronic (SolarEdge)
- 6.4.16 Salicru S.A.
- 6.4.17 Piller Power Systems
- 6.4.18 Centiel SA
- 6.4.19 Hitec Power Protection
- 6.4.20 Statron AG
- 6.4.21 PowerShield Ltd.
- 6.4.22 Fuji Electric Co., Ltd.
- 6.4.23 Mitsubishi Electric Corp.
- 6.4.24 Toshiba ESS
- 6.4.25 Shenzhen Zhicheng Champion Co., Ltd.
- 6.4.26 Zhongheng Electric (China UPS)
7 INVESTMENT ANALYSIS
8 MARKET OPPORTUNITIES AND FUTURE TRENDS
- 8.1 White-Space and Unmet-Need Assessment
 2026年全球模组化不断电系统(UPS)市场报告
 模组化不断电系统(UPS) 市场规模、份额和成长分析(按拓扑结构、阶段、组织规模、容量、最终用户和地区划分)—产业预测 (2026-2033)
 全球模组化 UPS 市场:按技术、按相类型、按电压、按功率容量、按外形规格、按电池类型 - 预测(至 2030 年)
 模组化不断电系统(UPS)的全球市场:2024年
 模组化 UPS 市场 – 2024 年至 2029 年预测
 模组化 UPS 市场,按组件、组织规模、垂直行业和地区 - 2024-2032 年行业分析、市场规模、市场份额和预测
 组合式UPS的市场规模,占有率,预测,趋势分析:电力各容量,各组织规模,各最终用途产业,各地区-2031年为止的世界预测