


 |
市场调查报告书
商品编码
1849934
自助服务:市场占有率分析、产业趋势、统计数据和成长预测(2025-2030 年)Self-Service - Market Share Analysis, Industry Trends & Statistics, Growth Forecasts (2025 - 2030) |
||||||
※ 本网页内容可能与最新版本有所差异。详细情况请与我们联繫。
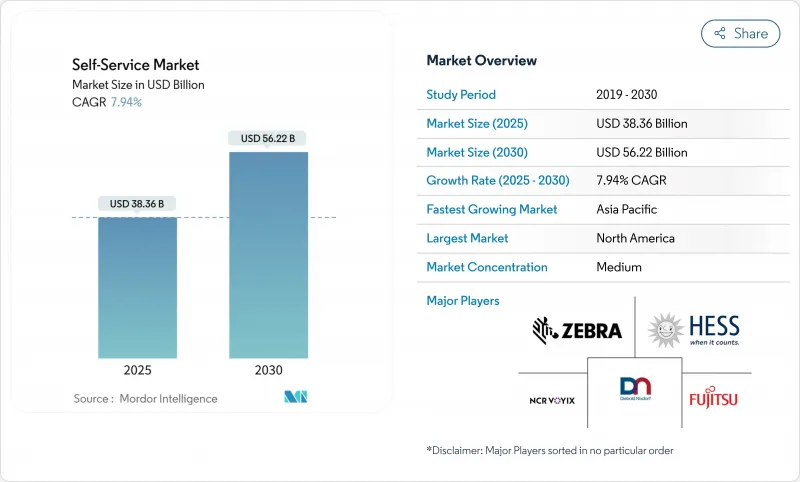
预计到 2025 年自助服务市场规模将成长至 383.6 亿美元,到 2030 年将成长至 562.2 亿美元,在此期间的复合年增长率为 7.9%。
这种成长与疫情后非接触式支付的加速转变、企业对数位化的要求不断提高以及公众对数位钱包的广泛喜爱直接相关。硬体和软体供应商正在透过整合人工智慧、电脑视觉和生物识别模组来应对这一趋势,这些模组可以减少等待时间、增强安全性并在银行、零售、医疗保健、公共场所等领域开闢新的用例。基于二维码和 NFC 构建的支付生态系统现已成为许多城市中心的主流,支持了对可接受用户喜欢的任何凭证的自助终端的稳定需求。供应商也正在强调服务合约和平台费用,将曾经的一次性硬体销售转变为平滑现金流的经常性收益来源。然而,抵御破坏、极端户外天气和电子商务替代品仍然是获利部署的先决条件。
全球自助服务市场趋势与洞察
新冠疫情后非接触式交易的兴起
到2022年,全球数位支付参与率将从2014年的44%飙升至三分之二的成年人,证实了无现金支付行为的永久转变。欧洲的调查显示,出于卫生方面的考虑,人们持续倾向于避免使用现金,小型市场营运商报告称,安装无现金模组后收益增加。像瑞典这样的国家,过去十年现金使用量减少了一半,凸显了政策、商家和消费者正迅速转向数位化。这种偏好也延伸到了生物识别辨识和语音提示,推动了自助服务市场非接触式身分验证的普及。
智慧零售业态快速发展
预计依赖RFID门、电脑视觉和智慧货架的无人商店将大幅成长。德国自助结帐商店数量近期已突破5,000家,零售商计画进一步加速发展。在美国,山姆会员商店等批发连锁店正在部署人工智慧增强型设备,可在几秒钟内扫描购物车,从而减少排队并重新部署员工。微型仓配中心虽然整合存在问题,但承诺在人口密集地区实现当日补货,从而吸引人们购买储物柜和混合自助服务终端,这些设备可以全天候提供取货和送货服务。
处理现金时持续存在的破坏行为和安全风险
根据英国电信的数据,在重型锁和警报器遏制此类事件之前,每年都有数万起针对付费电话的攻击事件发生。预计到2032年,复杂的累积奖金和盗刷诈骗将推动实体和网路安全市场规模达到324亿美元。营运商正在添加指纹认证、脸部认证和多因素提示以打击诈骗,但每个新模组都会增加成本并延长认证週期。联合警务巡逻和人工智慧监控可以减少损失,但无法完全消除损失。
細項分析
到 2024 年,自助服务终端将占据自助服务市场份额的 36.2%,这突显了它们在办理登机、票务和支付帐单方面的灵活性。自助服务终端相关的自助服务市场规模受益于持续的软体更新,增加了语言包、人工智慧头像和支付选项。随着杂货店和百货公司控制人事费用并缩短结帐排队时间,自助结帐正以 8.3% 的复合年增长率成长。虽然 ATM 仍然是现金生态系统的支柱,但由于行动支付满足了许多低价值支付需求,年度安装量已趋于平稳。自动贩卖机正在将其社交足迹从零嘴零食扩展到成药、个人防护装备和时间紧迫的疫苗。在降低最后一哩成本的压力下,智慧储物柜正在记录来自物流公司的有效订单,以便在非工作时间提取小包裹。医疗保健自助服务终端的市场规模预计将从2024年的8亿美元增长到2028年的18.1亿美元,这表明诊断、远端医疗和处方笺续订功能将在一个紧凑的空间内融合。零售商正在积极拥抱电脑视觉技术,利用摄影机自动称重商品,以最大限度地减少错误和消费者的不满。产品组合将持续惠及那些兼具耐用性和云端功能、能够提供即时洞察和远端服务的供应商。
自助服务终端供应商正在投资抗菌处理、触觉回馈、轮椅无障碍布局等技术,以领先无障碍法规。自助结帐机製造商正在与金融科技闸道合作,在遵守支付安全标准的同时,提供「先买后付」服务。 ATM供应商正在转向视讯柜员和加密货币模组,以保持市场竞争力。自动贩卖机专家正在测试动态冷冻和人工智慧货架图,透过优先展示快速週转的库存来提高每平方英吋的销售额。储物柜供应商正在为食品杂货和药品部门增加温控功能。因此,投资组合的广度仍然是自助服务市场中应对消费者流量和商家经济变化的一种对冲手段。
虽然硬体将占2024年收益的54.0%,但软体每年成长9.0%,使其成为终身收益的关键。供应商正在部署容器化作业系统,无需现场存取即可进行安全更新,从而加快新功能的上市时间。云端仪表板突出显示使用量峰值,使零售商仅在流量需要时才预先加载人员。 Diebold Nixdorf的DN Vynamic套件连接了超过230,000个端点,并推送预测性维护警报,以减少非计划性停机时间。人工智慧引擎位于边缘,可在几毫秒内标记可疑的提款模式并支援即时锁定。与忠诚度平台的整合还可以实现萤幕提升销售。
服务完善了组件功能,包括安装、移除、软体修补和合规性审核。随着固定期限合约的成长,服务利润率可能会超过硬体运输利润率。无障碍顾问确保符合《联邦公报》中规定的触觉、听觉和视觉标准。将 ERP 和 POS 资料与自助服务终端远端检测结合的公司能够实现闭合迴路分析,显示按 SKU、班次和位置分類的销售提升情况。对于在自助服务市场中资本支出週期较短且在全球范围内部署自助服务终端的大型连锁企业而言,这种视觉性对于采购决策至关重要。
自助服务市场报告按产品类型(自助服务终端、ATM、其他)、组件(硬体、软体、服务)、最终用户行业(BFSI、零售、快餐店、其他)、技术(生物识别、NFC/非接触式、人工智慧、电脑视觉、其他)、部署位置(室内、室外)和地区进行细分。
区域分析
2024年,北美将占总收入的39.4%,这反映了自动提款机技术的长期采用、零售店的广泛存在以及对保护条例的支持。支付卡的使用率几乎达到普遍水平,数位钱包占据主导地位,这促使商家优先考虑接受晶片、感应卡和行动凭证的终端。联邦机构将利用奖励策略资金资助宽频和数位政府入口网站,并在公共服务亭打造一致的用户体验。企业对人工智慧、云端运算和网路安全的需求随着每个预算週期而增长,推动了在现有硬体基础上进行以软体为中心的升级的需求。
欧洲在永续性和包容性之间取得平衡。欧盟委员会正在推广生态设计和透明的供应链,鼓励製造商延长设备使用寿命并揭露其碳足迹。无障碍法规要求使用触觉小键盘、语音提示和可调字体大小,这些都会影响材料清单清单和韧体设计。德国的EHI倡议透过统计数千条自助结帐通道展示了商业性雄心,同时该地区正在讨论能够与自助服务终端和ATM无缝连接的数位欧元的最佳格式。营运商正在实施远端遥测,以减少服务车行驶里程并实现气候变迁目标。
受惠于数位化措施和智慧型手机QR CODE支付的爆炸性成长,亚太地区的复合年增长率达到 8.5%。印度每月透过 UPI 汇款金额达数十亿,在农村自助服务终端,二维码支付也越来越普遍。中国正在试行一种央行数位货币,该货币可能会融入交通和自动贩卖机网络,这要求业者快速更新韧体。东协各国政府正在资助邮局内部的电子政府游说活动,以确保偏远地区的公民获得平等的服务,同时减少繁文缛节。南美和中东地区落后,但随着通讯业者大力推广行动货币以及旅游业重新激发人们对多语种票务的兴趣,该地区的发展正在加速。
其他福利:
- Excel 格式的市场预测 (ME) 表
- 3个月的分析师支持
目录
第一章 引言
- 研究假设和市场定义
- 调查范围
第二章调查方法
第三章执行摘要
第四章 市场状况
- 市场概况
- 市场驱动因素
- 新冠疫情后非接触式交易的兴起
- 智慧零售业态快速发展
- 全通路银行自动化浪潮
- 政府推动低现金社会
- 人工智慧驱动的自适应使用者介面
- 微型仓配和全天候无人驾驶营运概念
- 市场限制
- 持续存在的破坏行为与现金处理安全风险
- 在恶劣气候条件下进行户外部署时,整体拥有成本更高
- 无障碍标准的协调有限
- 不涉及自动贩卖机的电子商务的兴起
- 价值链分析
- 技术展望
- 波特五力分析
- 供应商的议价能力
- 买方的议价能力
- 新进入者的威胁
- 替代品的威胁
- 竞争对手之间的竞争
- 主要技术发展
- 自助服务亭的演变
- 无障碍自助服务终端标准与工作小组
- 关键案例研究和使用者研究
第五章市场规模及成长预测
- 依产品类型
- 亭
- ATM
- 自动贩卖机
- 自助结帐系统系统
- 智慧储物柜/包裹站
- 按组件
- 硬体
- 软体
- 服务
- 按最终用户产业
- BFSI
- 零售店和速食店
- 饭店业
- 卫生保健
- 交通和旅游枢纽
- 政府和公共部门
- 依技术
- 支援生物识别
- NFC/非接触式
- 人工智慧驱动和电脑视觉
- 云端连线
- 按位置
- 室内的
- 户外
- 按地区
- 北美洲
- 美国
- 加拿大
- 墨西哥
- 欧洲
- 德国
- 英国
- 法国
- 义大利
- 西班牙
- 俄罗斯
- 其他欧洲地区
- 亚太地区
- 中国
- 日本
- 印度
- 韩国
- ASEAN
- 澳洲和纽西兰
- 其他亚太地区
- 南美洲
- 巴西
- 阿根廷
- 南美洲其他地区
- 中东和非洲
- 中东
- 沙乌地阿拉伯
- 阿拉伯聯合大公国
- 土耳其
- 其他中东地区
- 非洲
- 南非
- 奈及利亚
- 其他非洲国家
- 北美洲
第六章 竞争态势
- 市场集中度
- 策略趋势
- 市占率分析
- 公司简介
- NCR Corporation
- Diebold Nixdorf
- Crane Payment Innovations
- Fujitsu Ltd.
- Glory Global Solutions
- Zebra Technologies
- Advantech Co. Ltd.
- Frank Mayer and Associates Inc.
- HESS Cash Systems GmbH
- Azkoyen Group
- Embross
- SEDCO
- IER Group
- Maas International BV
- RedyRef Interactive
- Olea Kiosks Inc.
- Posiflex Technology Inc.
- SlabbKiosks
- KIOSK Information Systems
第七章 市场机会与未来展望
The self-service market size stood at USD 38.36 billion in 2025 and is forecast to advance to USD 56.22 billion by 2030, reflecting a 7.9% CAGR over the period.
This growth links directly to the shift toward contactless engagement that gathered pace after the pandemic, tighter corporate mandates for digitization, and broad public familiarity with digital wallets. Hardware and software suppliers are responding by embedding AI, computer vision, and biometric modules that cut wait times, strengthen security, and open new use-cases across banking, retail, healthcare, and public venues. Payment ecosystems built on QR and NFC are now mainstream in many urban centers, and they underpin steady demand for self-service terminals able to accept any credential the user prefers. Vendors also highlight service contracts and platform fees, turning what was once a one-off hardware sale into a recurring revenue stream that smooths cash flow. However, resilience against vandalism, outdoor weather extremes, and e-commerce substitution remains a prerequisite for profitable roll-outs.
Global Self-Service Market Trends and Insights
Ubiquity of Contact-Free Transactions Post-COVID
Global digital payment participation jumped from 44% in 2014 to two-thirds of adults in 2022, confirming a permanent tilt toward cashless behaviors. European research shows sustained intentions to avoid cash because of hygiene concerns, and operators of micro-markets report higher revenues after installing cashless modules. Countries like Sweden, where cash use halved in the past decade, underscore how rapidly policy, merchants, and consumers converge on digital rails. This preference extends to biometric taps and voice prompts, driving every corner of the self-service market to support no-touch authentication.
Rapid Rollout of Smart Retail Formats
Autonomous stores relying on RFID gates, computer vision, and smart shelving are projected to grow significantly. Germany counted more than 5,000 self-checkout outlets recently, and retailers plan further acceleration. In the United States, wholesale chains such as Sam's Club deployed AI-enhanced devices that scan carts in seconds, shrinking queues and redeploying staff. Micro-fulfilment hubs, despite integration headaches, promise same-hour replenishment for densely populated districts, creating a pull for lockers and hybrid kiosks able to dispense and accept goods around the clock.
Persistent Vandalism and Cash-Handling Security Risks
Data from British Telecom revealed tens of thousands of attacks on pay-phones each year until ruggedized locks and alarms curbed incidents. Sophisticated jackpotting and skimming drives a physical and cyber security market forecast to reach USD 32.4 billion by 2032. Operators add fingerprint, facial recognition and multi-factor prompts to counter fraud, yet every new module raises cost per unit and elongates certification cycles. Collaborative patrols with police and AI-driven surveillance mitigate losses but cannot erase them entirely.
Other drivers and restraints analyzed in the detailed report include:
- Omni-Channel Banking Automation Wave
- Government Push for Cash-Lite Societies
- High TCO for Outdoor Deployments in Harsh Climates
For complete list of drivers and restraints, kindly check the Table Of Contents.
Segment Analysis
Kiosks controlled 36.2% self-service market share in 2024, highlighting their flexibility across check-in, ticketing, and bill payment. The self-service market size tied to kiosks benefits from continuous software refreshes that add language packs, AI avatars, and payment choices. Self-checkout lanes are growing at an 8.3% CAGR as grocers and general merchandisers curb labor expenses and speed the line. ATMs still anchor cash ecosystems, yet annual installations are plateauing because mobile transfers now satisfy many low-value needs. Vending machines move beyond snacks into OTC medicines, PPE, and time-sensitive vaccines, which widens their social footprint. Smart lockers registered brisk orders from logistics firms under pressure to cut last-mile costs and allow after-hours parcel pick-up. Healthcare kiosks, projected to ramp from USD 0.8 billion in 2024 to USD 1.81 billion by 2028, illustrate how diagnosis, telehealth, and prescription renewal can converge in compact footprints. Retailers adopt computer vision so cameras automatically weigh produce, minimizing errors and shopper frustration. The product mix will continue to reward vendors who merge durability with cloud hooks that unlock real-time insights and remote service.
Kiosk suppliers invest in antimicrobial surfaces, haptic feedback, and wheelchair-friendly layouts to stay ahead of accessibility rules. Self-checkout makers partner with fintech gateways to switch on buy-now-pay-later while still conforming to payment security standards. ATM vendors pivot toward Video Teller Machines and cryptocurrency modules to preserve relevance. Vending specialists test dynamic refrigeration and AI planograms to display fast-moving inventory first, which uplifts sales per square inch. Locker providers add temperature control for the grocery and pharmaceutical segments. Portfolio breadth, therefore, remains a hedge against shifts in consumer flow and merchant economics within the self-service market.
Hardware was responsible for 54.0% of revenue in 2024, yet software is advancing 9.0% each year and is the key to lifetime monetization. Vendors deploy containerized operating systems that permit secure updates without field visits, shortening mean-time-to-market for new features. Cloud dashboards spotlight usage spikes, allowing retailers to preload staff only when traffic demands. Diebold Nixdorf's DN Vynamic suite connects more than 230,000 endpoints and pushes predictive maintenance alerts that reduce unscheduled downtime. AI engines sit at the edge, flagging suspicious withdrawal patterns within milliseconds and supporting instant lockouts. Integrations with loyalty platforms also open upsell moments right on the screen.
Services round out the component play, spanning installation, decommissioning, software patching, and compliance audits. As recurring contracts expand, service margins may eclipse those of hardware shipments. Accessibility consultants ensure adherence to tactile, speech, and visual standards laid out in the Federal Register. Firms that couple ERP and point-of-sale data with kiosk telemetry enable closed-loop analytics showing sales uplift by SKU, shift, and location. This visibility is central to procurement decisions at large chains that roll kiosks worldwide on thin capex cycles within the self-service market.
The Self-Service Market Report is Segmented by Product Type (Kiosk, ATM, and More), Component (Hardware, Software, and Services), End-User Industry (BFSI, Retail and Quick-Service Restaurant, and More), Technology (Biometric-Enabled, NFC / Contactless, AI-Driven and Computer-Vision, and More), Deployment Location (Indoor and Outdoor), and Geography.
Geography Analysis
North America held 39.4% of revenue in 2024, reflecting long-standing adoption of automated teller technology, wide retail deployment, and supportive privacy regulations. Payment card penetration is nearly universal, and digital wallets are mainstream, so merchants prioritize terminals that handle chip, tap, and mobile credentials. Federal agencies devote stimulus budgets to broadband and digital government portals, fostering a consistent user experience in public service kiosks. Corporate appetite for AI, cloud, and cybersecurity rises each budget cycle, reinforcing demand for software-centric upgrades that sit atop existing hardware.
Europe balances sustainability and inclusion. The European Commission urges eco-design and transparent supply chains, pushing manufacturers to lengthen device lifespans and publish carbon footprints. Accessibility law compels tactile keypads, audio prompts, and adjustable font sizes, which influence BOM and firmware design. Germany's EHI initiative demonstrates commercial appetite by counting thousands of self-checkout lanes, while the region debates best formats for a digital euro that could seamlessly link to kiosks and ATMs. Operators retrofit remote telemetry to trim service van miles, aligning with climate targets.
Asia-Pacific, advancing at an 8.5% CAGR, benefits from pro-digitization edicts and an explosion of smartphone-linked QR payments. India stages billions of UPI transfers each month, normalizing QR taps even in rural kiosks. China pilots a central bank digital currency that will likely integrate into transit and vending networks, placing pressure on operators to update firmware fast. Governments in ASEAN fund e-government lobbies inside post offices, reducing red tape while ensuring remote citizens receive equal service. South America and the Middle East trail but accelerate as telcos push mobile money and as tourism revives interest in multi-language ticketing stations.
- NCR Corporation
- Diebold Nixdorf
- Crane Payment Innovations
- Fujitsu Ltd.
- Glory Global Solutions
- Zebra Technologies
- Advantech Co. Ltd.
- Frank Mayer and Associates Inc.
- HESS Cash Systems GmbH
- Azkoyen Group
- Embross
- SEDCO
- IER Group
- Maas International B.V.
- RedyRef Interactive
- Olea Kiosks Inc.
- Posiflex Technology Inc.
- SlabbKiosks
- KIOSK Information Systems
Additional Benefits:
- The market estimate (ME) sheet in Excel format
- 3 months of analyst support
TABLE OF CONTENTS
1 INTRODUCTION
- 1.1 Study Assumptions and Market Definition
- 1.2 Scope of the Study
2 RESEARCH METHODOLOGY
3 EXECUTIVE SUMMARY
4 MARKET LANDSCAPE
- 4.1 Market Overview
- 4.2 Market Drivers
- 4.2.1 Ubiquity of contact-free transactions post-COVID
- 4.2.2 Rapid rollout of smart retail formats
- 4.2.3 Omni-channel banking automation wave
- 4.2.4 Government push for cash-lite societies
- 4.2.5 AI-powered adaptive user interfaces
- 4.2.6 Micro-fulfilment and 24/7 unmanned concepts
- 4.3 Market Restraints
- 4.3.1 Persistent vandalism and cash-handling security risks
- 4.3.2 High TCO for outdoor deployments in harsh climates
- 4.3.3 Limited accessibility standards harmonisation
- 4.3.4 Rising e-commerce bypassing vending channels
- 4.4 Value Chain Analysis
- 4.5 Technological Outlook
- 4.6 Porter's Five Forces Analysis
- 4.6.1 Bargaining Power of Suppliers
- 4.6.2 Bargaining Power of Buyers
- 4.6.3 Threat of New Entrants
- 4.6.4 Threat of Substitutes
- 4.6.5 Competitive Rivalry
- 4.7 Major Technological Developments
- 4.7.1 Evolution of Self-Service Kiosks
- 4.7.2 Barrier-Free Kiosk Standards and Working Groups
- 4.7.3 Leading Case Studies and User-Surveys
5 MARKET SIZE AND GROWTH FORECASTS (VALUE)
- 5.1 By Product Type
- 5.1.1 Kiosk
- 5.1.2 ATM
- 5.1.3 Vending Machine
- 5.1.4 Self-Checkout System
- 5.1.5 Smart Locker / Parcel Station
- 5.2 By Component
- 5.2.1 Hardware
- 5.2.2 Software
- 5.2.3 Services
- 5.3 By End-user Industry
- 5.3.1 BFSI
- 5.3.2 Retail and Quick-Service Restaurant
- 5.3.3 Hospitality
- 5.3.4 Healthcare
- 5.3.5 Transportation and Travel Hubs
- 5.3.6 Government and Public Sector
- 5.4 By Technology
- 5.4.1 Biometric-Enabled
- 5.4.2 NFC / Contactless
- 5.4.3 AI-Driven and Computer-Vision
- 5.4.4 Cloud-Connected
- 5.5 By Deployment Location
- 5.5.1 Indoor
- 5.5.2 Outdoor
- 5.6 By Geography
- 5.6.1 North America
- 5.6.1.1 United States
- 5.6.1.2 Canada
- 5.6.1.3 Mexico
- 5.6.2 Europe
- 5.6.2.1 Germany
- 5.6.2.2 United Kingdom
- 5.6.2.3 France
- 5.6.2.4 Italy
- 5.6.2.5 Spain
- 5.6.2.6 Russia
- 5.6.2.7 Rest of Europe
- 5.6.3 Asia-Pacific
- 5.6.3.1 China
- 5.6.3.2 Japan
- 5.6.3.3 India
- 5.6.3.4 South Korea
- 5.6.3.5 ASEAN
- 5.6.3.6 Australia and New Zealand
- 5.6.3.7 Rest of Asia-Pacific
- 5.6.4 South America
- 5.6.4.1 Brazil
- 5.6.4.2 Argentina
- 5.6.4.3 Rest of South America
- 5.6.5 Middle East and Africa
- 5.6.5.1 Middle East
- 5.6.5.1.1 Saudi Arabia
- 5.6.5.1.2 UAE
- 5.6.5.1.3 Turkey
- 5.6.5.1.4 Rest of Middle East
- 5.6.5.2 Africa
- 5.6.5.2.1 South Africa
- 5.6.5.2.2 Nigeria
- 5.6.5.2.3 Rest of Africa
- 5.6.1 North America
6 COMPETITIVE LANDSCAPE
- 6.1 Market Concentration
- 6.2 Strategic Moves
- 6.3 Market Share Analysis
- 6.4 Company Profiles (includes Global level Overview, Market level overview, Core Segments, Financials as available, Strategic Information, Market Rank/Share for key companies, Products and Services, and Recent Developments)
- 6.4.1 NCR Corporation
- 6.4.2 Diebold Nixdorf
- 6.4.3 Crane Payment Innovations
- 6.4.4 Fujitsu Ltd.
- 6.4.5 Glory Global Solutions
- 6.4.6 Zebra Technologies
- 6.4.7 Advantech Co. Ltd.
- 6.4.8 Frank Mayer and Associates Inc.
- 6.4.9 HESS Cash Systems GmbH
- 6.4.10 Azkoyen Group
- 6.4.11 Embross
- 6.4.12 SEDCO
- 6.4.13 IER Group
- 6.4.14 Maas International B.V.
- 6.4.15 RedyRef Interactive
- 6.4.16 Olea Kiosks Inc.
- 6.4.17 Posiflex Technology Inc.
- 6.4.18 SlabbKiosks
- 6.4.19 KIOSK Information Systems
7 MARKET OPPORTUNITIES AND FUTURE OUTLOOK
- 7.1 White-Space and Unmet-Need Assessment
 自助式超级市场市场规模、份额及成长分析(依技术、配送类型、应用、最终用户及地区划分)-2026-2033年产业预测
 自助服务市场规模、份额和成长分析(按类型、最终用户和地区划分)-2026-2033年产业预测
 2032 年自助服务技术市场预测:按产品类型、部署模式、技术、应用、最终用户和地区进行的全球分析2030 年自助服务技术市场预测:按产品类型、部署模式、介面、最终用户和地区进行的全球分析
 自助服务技术的全球市场
 自助服务应用程式市场,按产品类型、按组件、按部署、按应用程式、按国家和地区 - 2024-2032 年行业分析、市场规模、市场份额和预测
 自助服务技术的全球市场 2024-2028