


 |
市场调查报告书
商品编码
1850003
工作空间即服务 (WaaS):市场占有率分析、产业趋势、统计数据和成长预测(2025-2030 年)Workspace As A Service (WaaS) - Market Share Analysis, Industry Trends & Statistics, Growth Forecasts (2025 - 2030) |
||||||
※ 本网页内容可能与最新版本有所差异。详细情况请与我们联繫。
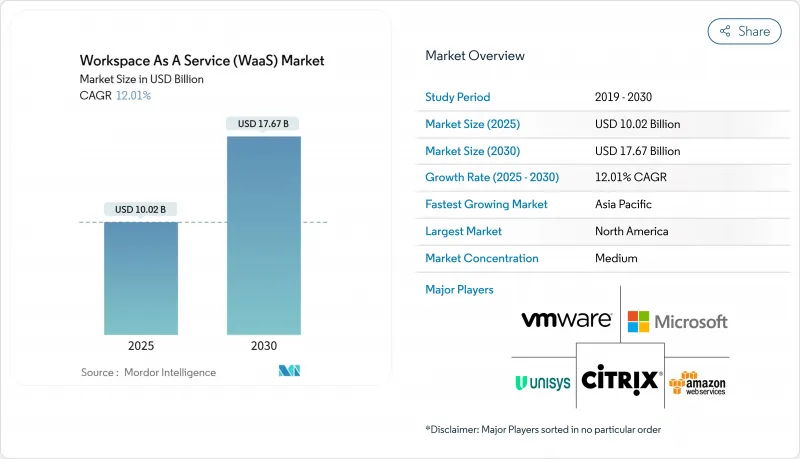
预计工作空间即服务 (WaaS) 市场规模将在 2025 年达到 100.2 亿美元,并在 2030 年达到 176.7 亿美元。
企业向云端优先的数位化工作场所架构转型,将安全性、合规性和生产力工具整合到单一虚拟体验中,推动了成长。超大规模资料中心的资本支出超过 3,800 亿美元,释放了全球 GPU 容量,以支援 AI主导的虚拟桌面。零信任框架的快速采用、合规性审查的加强以及安全的混合工作需求,正在支撑受监管行业的需求。同时,市场集中度的降低,使得成熟和新兴的云端原生供应商能够围绕图形设计、金融交易和即时协作等专业工作负载进行创新。
全球工作空间即服务 (WaaS) 市场趋势与洞察
BYOD 的兴起推动了对 WaaS 的需求
采用 BYOD(自带设备)策略的公司越来越依赖集中式虚拟桌面来保护资料并确保统一的安全。 WaaS 内建的多因素身份验证、细粒度的条件存取和会话隔离功能降低了非託管硬体带来的风险。会计、法律和设计公司报告称,由于虚拟应用程式可以即时交付到个人笔记型电脑和平板电脑上,季节性员工的入职速度更快。资讯长也表示,由于设备无关的交付方式将智慧财产权保留在资料中心而非终端,IT 资产的可视性也得到了提升。这种势头使 BYOD 成为成熟市场和新兴市场的中期驱动力。
云端 VDI 的成本和可扩展性优势
云端託管虚拟桌面透过消除批量硬体更新并将支出转向基于消费的模式,降低了整体拥有成本。 Amazon WorkSpaces 瘦客户端装置起价为 195 美元,可从云端传输加密像素。 Microsoft Azure 虚拟桌面新增多会话 Windows 11 以达到最大密度,其全球资料中心覆盖范围可在合併或计划高峰期即时扩充。这些效率优势在亚太地区的中小企业中尤为突出,这些企业先前缺乏部署企业级基础设施的资金。
持续的网路延迟和频宽差距
虚拟桌面对往返延迟高度敏感。 Citrix 基准测试表明,超过 150 毫秒,使用者体验会急剧下降,超过 300 毫秒则无法接受。许多农村和新兴市场仍然依赖不稳定的宽频,输入延迟、音讯遗失和影像模糊等问题阻碍了其普及。超大规模资料中心营运商正在透过邻近边缘区域和自适应 UDP 传输来缓解限制,但最后一英里的基础设施仍然参差不齐。政府主导的光纤部署和 5G 固定无线试验至关重要,尤其对于涉及高清视讯和 CAD 工作负载的部署。
細項分析
2024年,桌面即服务占据了工作空间即服务市场56.7%的份额,这反映出对支援传统商用软体的完整作业系统镜像的强劲需求。企业青睐这种模式,因为与单一笔记型电脑相比,它透过集中式修补程式、黄金镜像管理和即时回滚功能简化了合规性。 DaaS的采用还可以顺利扩展到按小时收费的承包商和季节性员工。该细分市场的领先地位推动了平台供应商将身分、可观察性和端点分析等互补功能整合到统一的主机中。
整合协作套件是成长最快的类别,到2030年的复合年增长率将达到13.1%。融合了聊天、通话、文件协作和工作流程自动化的套件可以减少工具的氾滥,并促进许可证整合。 Microsoft Teams在现有的Office 365合约中占据主导地位,而Google Workspace在教育机构和新兴企业中占据主导地位。供应商现在正在整合会议记录AI、白板和低程式码流程建构器,将其套件定位为更广泛数位体验平台的垫片。随着企业走向紧密的生态系统,这种趋势将逐渐削弱独立的会议和储存解决方案。
到 2024 年,本地部署将占工作空间即服务市场规模的 67.5%。这些设施通常将 VDI 软体与在私有资料中心运作的超融合丛集相结合,但严格的容量规划、硬体更新週期和单独的灾害復原站点使资本成本居高不下。
到2030年,云端运算的采用将达到最高的复合年增长率,达到13.8%。供应商提供企业级GPU、自动化弹性和全球冗余,且无需任何前期成本。微软基于Azure Stack HCI的Azure虚拟桌面透过在本地端託管虚拟会话主机并从云端控制它们,连接了两个世界。欧洲公司正在寻求符合GDPR和Schrems II资料传输法规的主权云端区域。最终,即使对于受到严格监管的公司,公共云端营运模式也将主导新的待开发区部署和工作负载扩展。
区域分析
到2024年,北美将以35.6%的市场份额继续保持其在工作空间即服务市场的领先地位,这得益于成熟的云端基础设施、高宽频普及率以及科技、金融和媒体行业的早期应用。远端工作资料管理的监管明确加速了相关技术的推广,而多个大都会圈的超大规模资料中心的密集部署使延迟保持在最佳阈值范围内。私人部门持续投资于人工智慧优化的资料中心,例如亚马逊斥资100亿美元在北卡罗来纳州建造的园区,这将继续增强该地区的供应基础。
预计到2030年,亚太地区的复合年增长率将达到12.7%,位居榜首。印度、印尼和越南政府已累计补贴和频谱奖励,以扩大光纤和5G覆盖范围,使中小企业和公共机构能够从本地IT迁移到云端桌面。亚马逊斥资200亿澳元用于澳洲资料中心建设,并新建太阳能发电厂,凸显了该地区在绿色基础设施方面的雄心。日本和韩国的国内云端服务供应商也宣布了支援语言模型开发和3D设计的GPU集群,这刺激了邻近地区对高效能工作站的需求。
欧洲继续成为以主权云端框架为中心的成长中心。由于《欧洲数据法案》和行业法规强制工作负载必须限制在区域范围内,法国、德国和北欧国家正在采用值得信赖的云端合作伙伴网路。 VMware 的主权云端参考架构提供了标准化的合规性模板,可快速认证虚拟桌面。随着硬体更新周期的推进,许多企业正在缩减其本地机架规模,并加入授权的公共云端区域。中东和非洲正在经历与经济多元化计画相关的新部署,而随着光纤主干网路和边缘节点缩小历史性的频宽缺口,拉丁美洲正呈现稳定成长动能。
其他福利:
- Excel 格式的市场预测 (ME) 表
- 3个月的分析师支持
目录
第一章 引言
- 研究假设和市场定义
- 调查范围
第二章调查方法
第三章执行摘要
第四章 市场状况
- 市场概况
- 市场驱动因素
- BYOD 的兴起推动了对 WaaS 的需求
- 云端 VDI 的成本和可扩展性优势
- 混合工作安全要求
- 超大规模资料中心业者扩展 DaaS 产品组合
- 嵌入数位化工作场所的 ESG 仪表板
- GPU加速虚拟工作站(AI/图形)
- 市场限制
- 持续的网路延迟和频宽差距
- 整合遗留应用程式的复杂性
- 云端运算出口费用上涨对TCO带来压力
- 资料主权规则强製本地 VDI 覆盖
- 价值链分析
- 监管格局
- 技术展望
- 波特五力分析
- 供应商的议价能力
- 买方的议价能力
- 新进入者的威胁
- 替代品的威胁
- 竞争对手之间的竞争
- 评估宏观经济趋势对市场的影响
第五章市场规模及成长预测
- 按解决方案
- 桌面即服务 (DaaS)
- 应用程式即服务 (AaaS)
- 託管安全与合规性 - aaS
- 整合协作套件
- 按部署模型
- 本地部署
- 云
- 按组织规模
- 大公司
- 小型企业
- 按最终用户
- BFSI
- 教育
- 零售与电子商务
- 政府和公共部门
- 资讯科技和通讯
- 其他最终用户领域
- 按地区
- 北美洲
- 美国
- 加拿大
- 墨西哥
- 欧洲
- 德国
- 英国
- 法国
- 义大利
- 西班牙
- 其他欧洲地区
- 亚太地区
- 中国
- 日本
- 印度
- 韩国
- 澳洲
- 其他亚太地区
- 南美洲
- 巴西
- 阿根廷
- 南美洲其他地区
- 中东和非洲
- 中东
- 沙乌地阿拉伯
- 阿拉伯聯合大公国
- 土耳其
- 其他中东地区
- 非洲
- 南非
- 埃及
- 奈及利亚
- 其他非洲国家
- 北美洲
第六章 竞争态势
- 市场集中度
- 策略趋势
- 市占率分析
- 公司简介
- Amazon Web Services Inc.
- VMware Inc.
- Citrix Systems Inc.
- Microsoft Corporation
- Google LLC
- IBM Corporation
- Cisco Systems Inc.
- Accenture plc
- DXC Technology Co.
- Hewlett Packard Enterprise
- Nutanix Inc.
- Workspot Inc.
- Cloudalize NV
- Dizzion Inc.
- Getronics NV
- Unisys Corporation
- NTT DATA Corporation
- Colt Technology Services
- Oracle Corporation
- Huawei Technologies Co. Ltd.
第七章 市场机会与未来展望
The Workspace As A Service (WaaS) Market size reached USD 10.02 billion in 2025 and is projected to climb to USD 17.67 billion by 2030, reflecting a steady 12% CAGR over the forecast period.
Growth is underpinned by enterprises shifting to cloud-first digital workplace architectures that converge security, compliance, and productivity tools into a single virtual experience. Hyperscaler capital spending exceeding USD 380 billion has unlocked global GPU capacity that supports AI-driven virtual desktops, while pay-as-you-go pricing keeps barriers low for small teams in every sector. Rapid adoption of zero-trust frameworks, rising compliance scrutiny, and secure hybrid-work requirements sustain demand across regulated verticals. Meanwhile, moderate market concentration encourages both incumbents and emerging cloud-native vendors to innovate around specialized workloads such as graphics design, financial trading, and real-time collaboration.
Global Workspace As A Service (WaaS) Market Trends and Insights
BYOD Proliferation Boosts WaaS Demand
Organizations adopting Bring Your Own Device policies increasingly rely on centralized virtual desktops to protect data and enforce uniform security. Multi-factor authentication, granular conditional access, and session isolation embedded in WaaS reduce risks tied to unmanaged hardware. Accounting, legal, and design firms report faster onboarding of seasonal staff because virtual apps are delivered instantly to personal laptops and tablets. CIOs also cite improved IT asset visibility, since device-agnostic delivery keeps intellectual property inside the datacenter rather than on endpoints. This momentum positions BYOD as a mid-term driver across mature and emerging markets.
Cloud-VDI Cost and Scalability Advantages
Cloud-hosted virtual desktops lower total cost of ownership by removing bulk hardware refreshes and shifting expenditure to consumption-based models. Amazon WorkSpaces Thin Client devices start at USD 195 and stream encrypted pixels from the cloud, illustrating how central management reduces desk-side support. Microsoft Azure Virtual Desktop adds multi-session Windows 11 to maximize density, while global datacenter footprints enable instant scaling during mergers or peak project phases. These efficiencies resonate most strongly with Asia-Pacific SMEs that previously lacked capital for enterprise-grade infrastructure.
Persistent Network Latency and Bandwidth Gaps
Virtual desktops are highly sensitive to round-trip delay. Citrix benchmark testing shows user experience falls sharply once latency breaches 150 milliseconds and becomes unacceptable beyond 300 milliseconds. Many rural districts and emerging economies still rely on inconsistent broadband, leading to input lag, audio dropouts, and blurred graphics that discourage adoption. Hyperscalers mitigate constraints through nearby edge zones and adaptive UDP transport, yet last-mile infrastructure remains uneven. Government-sponsored fiber rollouts and 5G fixed-wireless pilots will be pivotal, especially for deployments involving high-definition video or CAD workloads.
Other drivers and restraints analyzed in the detailed report include:
- Hybrid-Work Security Requirements
- Hyperscaler DaaS Portfolio Expansion
- Legacy-App Integration Complexity
For complete list of drivers and restraints, kindly check the Table Of Contents.
Segment Analysis
Desktop as a Service secured 56.7% share of the Workspace as a Service market in 2024, reflecting persistent demand for full operating-system images that support legacy line-of-business software. Enterprises favor the model because centralized patching, golden-image management, and instant rollback simplify compliance compared with individual laptops. DaaS adoption also scales smoothly for contractors and seasonal staff thanks to hourly billing. The segment's leadership has prompted platform vendors to merge complementary functions such as identity, observability, and endpoint analytics into unified consoles.
Integrated Collaboration Suites represent the fastest-rising category at 13.1% CAGR through 2030. Bundles combining chat, calling, document co-authoring, and workflow automation reduce tool sprawl and encourage license consolidation. Microsoft Teams inside existing Office 365 agreements and Google Workspace in education and startup cohorts dominate volumes. Vendors now embed meeting-transcription AI, whiteboarding, and low-code process builders, positioning suites as a launchpad for broader digital experience platforms. This trajectory will gradually dilute standalone conferencing or storage solutions as firms gravitate toward cohesive ecosystems.
On-premise deployments controlled 67.5% of the Workspace as a Service market size in 2024 as enterprises leveraged sunk investments and asserted data sovereignty. Such estates often pair VDI software with hyperconverged clusters running in private datacenters. However, stringent capacity planning, hardware refresh cycles, and separate disaster-recovery sites keep capital costs high.
Cloud deployment is set to register the strongest 13.8% CAGR to 2030. Providers deliver enterprise-grade GPUs, automated elasticity, and global redundancy without upfront spend. Microsoft's Azure Virtual Desktop on Azure Stack HCI bridges both worlds by hosting virtual session hosts on-premise while controlling them from the cloud. European organizations gravitate toward sovereign cloud regions that address GDPR and Schrems II data transfer rulings. Over time, the public-cloud operating model will dominate new greenfield deployments and workload expansion even among highly regulated entities.
The Workspace As A Service (WaaS) Market Report is Segmented by Solution (Desktop As A Service (DaaS), Application As A Service (AaaS), and More), Deployment Model (On-Premise and Cloud), Organization Size (Large Enterprises and Small and Medium Enterprises (SMEs)), End-User Vertical (BFSI, Education, Retail and E-Commerce, and More) and Geography. The Market Forecasts are Provided in Terms of Value (USD).
Geography Analysis
North America retained leadership with 35.6% share of the Workspace as a Service market in 2024, supported by mature cloud infrastructure, high broadband penetration, and early adoption across technology, finance, and media. Regulatory clarity around remote work data controls accelerated rollouts, while hyperscaler density in multiple metropolitan zones kept latency within optimal thresholds. Ongoing private-sector investments in AI-optimized datacenters, including Amazon's USD 10 billion North Carolina campus, continue to reinforce the regional supply base.
Asia-Pacific is projected to record the fastest 12.7% CAGR to 2030. Governments in India, Indonesia, and Vietnam earmark grants and spectrum incentives to extend fiber and 5G coverage, enabling SMEs and public agencies to leapfrog on-premise IT in favor of cloud desktops. Amazon's AU$20 billion allocation for Australian datacenters paired with new solar farms underscores regional appetite for green infrastructure. Domestic cloud providers in Japan and South Korea are also launching GPU-rich clusters to support language-model development and 3D design, fueling demand for high-performance workstations served from nearby zones.
Europe remains a growth pivot anchored on sovereign cloud frameworks. The European Data Act and sector-specific mandates force workloads to stay inside regional boundaries, prompting France, Germany, and the Nordics to adopt trusted cloud partner networks. VMware's sovereign-cloud reference architecture offers standardized compliance templates that expedite virtual desktop certification. As firms renew hardware cycles, many downsize on-premise racks and subscribe to sanctioned public-cloud regions, blending performance with legal assurance. The Middle East and Africa register nascent uptake tied to economic diversification programs, while Latin America sees steady momentum where fiber backbones and edge nodes close historic bandwidth gaps.
- Amazon Web Services Inc.
- VMware Inc.
- Citrix Systems Inc.
- Microsoft Corporation
- Google LLC
- IBM Corporation
- Cisco Systems Inc.
- Accenture plc
- DXC Technology Co.
- Hewlett Packard Enterprise
- Nutanix Inc.
- Workspot Inc.
- Cloudalize NV
- Dizzion Inc.
- Getronics NV
- Unisys Corporation
- NTT DATA Corporation
- Colt Technology Services
- Oracle Corporation
- Huawei Technologies Co. Ltd.
Additional Benefits:
- The market estimate (ME) sheet in Excel format
- 3 months of analyst support
TABLE OF CONTENTS
1 INTRODUCTION
- 1.1 Study Assumptions and Market Definition
- 1.2 Scope of the Study
2 RESEARCH METHODOLOGY
3 EXECUTIVE SUMMARY
4 MARKET LANDSCAPE
- 4.1 Market Overview
- 4.2 Market Drivers
- 4.2.1 BYOD proliferation boosts WaaS demand
- 4.2.2 Cloud-VDI cost and scalability advantages
- 4.2.3 Hybrid-work security requirements
- 4.2.4 Hyperscaler DaaS portfolio expansion
- 4.2.5 ESG dashboards embedded in digital workplace
- 4.2.6 GPU-accelerated virtual workstations (AI/graphics)
- 4.3 Market Restraints
- 4.3.1 Persistent network latency and bandwidth gaps
- 4.3.2 Legacy-app integration complexity
- 4.3.3 Rising cloud egress fees erode TCO
- 4.3.4 Data-sovereignty rules force local VDI footprint
- 4.4 Value Chain Analysis
- 4.5 Regulatory Landscape
- 4.6 Technological Outlook
- 4.7 Porter's Five Forces Analysis
- 4.7.1 Bargaining Power of Suppliers
- 4.7.2 Bargaining Power of Buyers
- 4.7.3 Threat of New Entrants
- 4.7.4 Threat of Substitutes
- 4.7.5 Intensity of Competitive Rivalry
- 4.8 Assessment of the Impact of Macroeconomic Trends on the Market
5 MARKET SIZE AND GROWTH FORECASTS (VALUE)
- 5.1 By Solution
- 5.1.1 Desktop as a Service (DaaS)
- 5.1.2 Application as a Service (AaaS)
- 5.1.3 Managed Security and Compliance-aaS
- 5.1.4 Integrated Collaboration Suites
- 5.2 By Deployment Model
- 5.2.1 On-Premise
- 5.2.2 Cloud
- 5.3 By Organization Size
- 5.3.1 Large Enterprises
- 5.3.2 Small and Medium Enterprises (SMEs)
- 5.4 By End-user Vertical
- 5.4.1 BFSI
- 5.4.2 Education
- 5.4.3 Retail and e-Commerce
- 5.4.4 Government and Public Sector
- 5.4.5 IT and Telecom
- 5.4.6 Other End-user Verticals
- 5.5 By Geography
- 5.5.1 North America
- 5.5.1.1 United States
- 5.5.1.2 Canada
- 5.5.1.3 Mexico
- 5.5.2 Europe
- 5.5.2.1 Germany
- 5.5.2.2 United Kingdom
- 5.5.2.3 France
- 5.5.2.4 Italy
- 5.5.2.5 Spain
- 5.5.2.6 Rest of Europe
- 5.5.3 Asia-Pacific
- 5.5.3.1 China
- 5.5.3.2 Japan
- 5.5.3.3 India
- 5.5.3.4 South Korea
- 5.5.3.5 Australia
- 5.5.3.6 Rest of Asia-Pacific
- 5.5.4 South America
- 5.5.4.1 Brazil
- 5.5.4.2 Argentina
- 5.5.4.3 Rest of South America
- 5.5.5 Middle East and Africa
- 5.5.5.1 Middle East
- 5.5.5.1.1 Saudi Arabia
- 5.5.5.1.2 United Arab Emirates
- 5.5.5.1.3 Turkey
- 5.5.5.1.4 Rest of Middle East
- 5.5.5.2 Africa
- 5.5.5.2.1 South Africa
- 5.5.5.2.2 Egypt
- 5.5.5.2.3 Nigeria
- 5.5.5.2.4 Rest of Africa
- 5.5.1 North America
6 COMPETITIVE LANDSCAPE
- 6.1 Market Concentration
- 6.2 Strategic Moves
- 6.3 Market Share Analysis
- 6.4 Company Profiles (includes Global level Overview, Market level overview, Core Segments, Financials as available, Strategic Information, Market Rank/Share, Products and Services, Recent Developments)
- 6.4.1 Amazon Web Services Inc.
- 6.4.2 VMware Inc.
- 6.4.3 Citrix Systems Inc.
- 6.4.4 Microsoft Corporation
- 6.4.5 Google LLC
- 6.4.6 IBM Corporation
- 6.4.7 Cisco Systems Inc.
- 6.4.8 Accenture plc
- 6.4.9 DXC Technology Co.
- 6.4.10 Hewlett Packard Enterprise
- 6.4.11 Nutanix Inc.
- 6.4.12 Workspot Inc.
- 6.4.13 Cloudalize NV
- 6.4.14 Dizzion Inc.
- 6.4.15 Getronics NV
- 6.4.16 Unisys Corporation
- 6.4.17 NTT DATA Corporation
- 6.4.18 Colt Technology Services
- 6.4.19 Oracle Corporation
- 6.4.20 Huawei Technologies Co. Ltd.
7 MARKET OPPORTUNITIES AND FUTURE OUTLOOK
- 7.1 White-space and Unmet-Need Assessment


