


 |
市场调查报告书
商品编码
1850008
智慧製造:市场占有率分析、产业趋势、统计数据和成长预测(2025-2030 年)Smart Manufacturing - Market Share Analysis, Industry Trends & Statistics, Growth Forecasts (2025 - 2030) |
||||||
※ 本网页内容可能与最新版本有所差异。详细情况请与我们联繫。
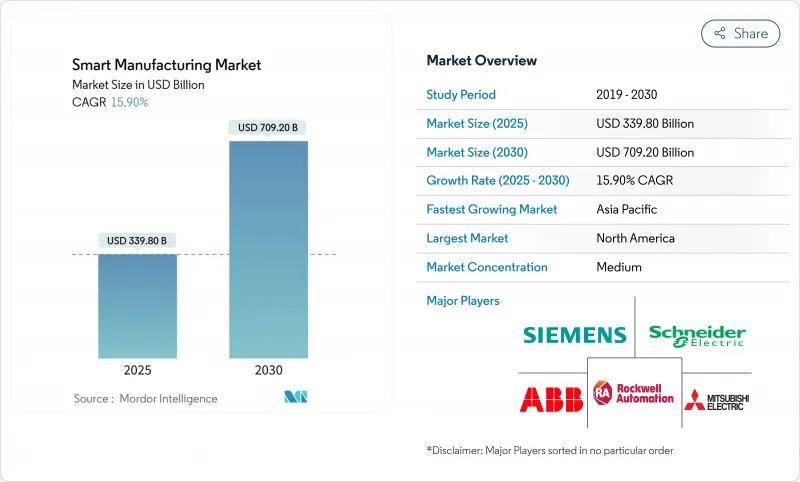
预计到 2025 年,智慧製造市场规模将达到 3,398 亿美元,到 2030 年将成长至 7,092 亿美元,年复合成长率为 15.90%。
即时分析、机器互联和人工智慧驱动的製程控制正在融合,从而显着提高效率;同时,各国政府也纷纷推出激励措施,以增强国内製造业的韧性。能源成本上涨和碳定价推动了对工厂级透明化解决方案的需求,而劳动力短缺则刺激了对协作机器人和自主物料输送系统的需求。供应商正在将私有5G和边缘分析技术融入新产品中,以实现安全关键流程的微秒响应速度。竞争格局也从硬体更新周期转向软体订阅模式,后者透过预测性洞察和能源优化来实现获利。
全球智慧製造市场趋势与洞察
工业4.0/工业物联网的日益普及可提高效率
工业物联网 (IIoT) 的应用目前可带来 52% 的生产效率提升和 25% 的成本节约,这得益于工厂对感测器、分析和云端仪錶板的整合。美国製造业拓展伙伴计画(美国 Manufacturing Extension Partnership )透过其智慧製造项目,已帮助 36,000 家公司在 2024 年前实现 162 亿美元的销售额成长。互联资产的数据汇入整合资料湖,使营运商能够消除生产线停机并动态调整产能。航太等对精度要求极高的行业正在积极采用数位化可追溯性来减少废品和保固索赔,从而推动其连接架构的持续升级。
政府对数位化工厂的奖励和政策要求
联邦和州政府层级的资助计画正透过有针对性的财政支持和法律规范,加速智慧製造的普及应用。例如,州製造业领导计画(Manufacturing Leadership Program)向中小型製造商提供5000万美元,透过提供高效能运算资源和技术援助来提升其製造能力。同时,德国的工业4.0倡议(由为中小企业提供技术应用指导的「中小企业4.0卓越中心」支持)预计到2020年每年将投资400亿欧元。
中小企业面临高资本支出和不确定的投资报酬率
由于前期投资和投资回报期的不确定性,中小企业在采用智慧製造技术方面面临着许多障碍。实施一套完整的智慧製造系统的成本可能从数十万美元到数百万美元不等,这给资源有限的企业带来了沉重的财务负担。互联繫统的投资报酬率计算复杂,使得中小企业决策者难以证明投资的合理性,尤其是在收益可能需要两到三年才能显现的情况下。
细分市场分析
2024年,製造执行系统(MES)将占据智慧製造市场22.4%的份额,凸显其作为工厂营运数位化支柱的重要地位。随着製造商要求实现全球工厂的即时可视性,预计到2032年,MES智慧製造市场规模将达到417.8亿美元。数位双胞胎平台正以18.7%的复合年增长率快速成长,使工程师能够模拟设备在各种负载下的运作情况,进而将试运行时间缩短30%。虽然PLC和SCADA仍然至关重要,但供应商正在整合人工智慧模组以实现参数的自主调整。边缘分析软体缩短了高速包装线上的决策週期,标誌着资料中心正从集中式伺服器转变为现场微型资料中心。
软体定义升级能够带来稳定的年度经常性收入,促使现有企业将分析功能捆绑到授权续约中。人机介面工具正朝着扩增实境发展,为第一线技术人员提供引导式工作流程。产品生命週期管理解决方案与供应链入口网站集成,使设计人员能够儘早检验产品的可製造性。这些技术创新巩固了智慧製造市场作为持续改善投资关键管道的地位。
到2024年,软体收入将占总收入的49.6%,反映出工作流程正向数据主导型转变。工业机器人预计将以17.5%的复合年增长率成长,有助于解决长期存在的劳动力短缺问题以及灵活批量生产的需求。控制设备现在整合了设备端推理引擎,无需云端延迟即可实现自主调整。随着工厂将整合、培训和网路安全管理等业务外包,服务收入也将成长。
私有5G网路将再形成通讯领域,在单层楼内支援数万个终端,并实现确定性延迟。供应商将与通讯业者共同製定频谱策略,将连接性转化为战略护城河。因此,智慧製造市场将继续模糊OT硬体和IT软体之间的界限,从而创建一个用于创造数位价值的整合平台。
区域分析
2024年,北美将占全球销售额的42.3%,这得益于美国能源局提供的3300万美元津贴计划以及製造拓展伙伴计划(Manufacturing Extension Partnership)在全国范围内的推广。创业投资正在加速技术应用,私募股权基金则致力于推出整合製造执行系统(MES)、机器人整合和保全服务的平台。区域供应商正在采用私有的5G测试平台来检验对延迟敏感的应用场景,例如远端焊接。
亚太地区是成长最快的地区,复合年增长率达15.9%。其中,中国在「中国製造2025」的旗帜下设立了33个研发中心,韩国则以每万名员工1,012台机器人的全球领先机器人密度位居世界前列。在三方合作伙伴的支持下,印度的「数位基础设施成长计画」正在降低新兴企业的进入门槛,并将印度定位为製造执行系统(MES)发展领域的新兴力量。
在欧洲,智慧製造正稳步普及,这主要得益于德国的工业4.0战略,该战略预计每年投资400亿欧元(约合440亿美元),并由德国的「中小企业4.0能力中心」推动。碳边境调节机制进一步提升了对能源强度仪錶板的需求,并使欧洲供应商在碳计量模组方面拥有先发优势。总而言之,这些动态共同增强了智慧製造市场的区域专业实力,并影响供应商的市场进入策略。
其他福利:
- Excel格式的市场预测(ME)表
- 3个月的分析师支持
目录
第一章 引言
- 研究假设和市场定义
- 调查范围
第二章调查方法
第三章执行摘要
第四章 市场情势
- 市场概览
- 市场驱动因素
- 工业4.0/工业物联网的日益普及提高了效率
- 政府对数位化工厂的奖励和政策要求
- 技术纯熟劳工短缺将加速自动化技术的普及应用。
- 碳边境调节机制(CBAM)促进工厂层级的能源透明度
- 基于数位双胞胎的预测性维护服务收入
- 部署可实现超低延迟控制的专用 5G 网络
- 市场限制
- 中小企业资本投入高,投资报酬率不确定性
- 网路安全/资料主权问题
- 传统类比设备限制了互通性
- 半导体供应链的不稳定性导致控制硬体交付延迟。
- 价值/供应链分析
- 监管环境
- 五力分析
- 供应商的议价能力
- 买方的议价能力
- 新进入者的威胁
- 替代品的威胁
- 竞争对手之间的竞争
- 投资分析
第五章 市场规模与成长预测
- 透过技术
- 可程式逻辑控制器(PLC)
- 监控与数据采集(SCADA)
- 企业资源规划(ERP)
- 分散式控制系统(DCS)
- 人机介面(HMI)
- 产品生命週期管理(PLM)
- 製造执行系统(MES)
- 数位双胞胎平台
- 边缘分析软体
- 其他技术
- 按组件
- 硬体
- 机器人技术
- 感应器
- 机器视觉系统
- 控制装置
- 软体
- MES
- PLM
- SCADA/ERP套件
- 数位双胞胎/人工智慧和分析
- 服务
- 整合与实施
- 咨询和培训
- 託管服务
- 通讯部门
- 硬体
- 透过部署模式
- 本地部署
- 云
- 杂交种
- 按最终用户行业划分
- 车
- 半导体和电子学
- 石油和天然气
- 化工和石油化工
- 製药和生命科学
- 航太与国防
- 食品/饮料
- 金属和采矿
- 能源与公共产业
- 物流和仓储
- 其他行业
- 按地区
- 北美洲
- 美国
- 加拿大
- 墨西哥
- 南美洲
- 巴西
- 阿根廷
- 智利
- 其他南美洲
- 欧洲
- 德国
- 英国
- 法国
- 义大利
- 西班牙
- 荷兰
- 俄罗斯
- 其他欧洲地区
- 亚太地区
- 中国
- 日本
- 印度
- 韩国
- 澳洲和纽西兰
- ASEAN-5
- 亚太其他地区
- 中东和非洲
- 中东
- 非洲
- 北美洲
第六章 竞争情势
- 市场集中度
- 策略趋势
- 市占率分析
- 公司简介
- ABB Ltd.
- Emerson Electric Co.
- FANUC Corporation
- General Electric Co.
- Honeywell International Inc.
- Mitsubishi Electric Corp.
- Robert Bosch GmbH
- Rockwell Automation Inc.
- Schneider Electric SE
- Siemens AG
- Texas Instruments Inc.
- Yokogawa Electric Corp.
- Cisco Systems Inc.
- IBM Corp.
- Oracle Corp.
- SAP SE
- Johnson Controls Intl. plc
- PTC Inc.
- Dassault Systems SE
- 3D Systems Corp.
- Stratasys Ltd.
- Delta Electronics Inc.
- Capgemini SE
第七章 市场机会与未来展望
The smart manufacturing market size is valued at USD 339.80 billion in 2025 and is projected to climb to USD 709.20 billion by 2030, registering a 15.90% CAGR.
Real-time analytics, machine connectivity, and AI-powered process control are converging to unlock large efficiency gains, while governments channel incentives toward resilient domestic production capacity. Rising energy costs and carbon-pricing schemes heighten interest in factory-level transparency solutions, and labor shortages intensify demand for collaborative robots and autonomous material-handling systems. Vendors are embedding private 5G and edge analytics in new offerings, enabling micro-second response times for safety-critical processes. Competitive focus is shifting from hardware refresh cycles to software subscription models that monetize predictive insights and energy optimization.
Global Smart Manufacturing Market Trends and Insights
Rising adoption of Industry 4.0 / IIoT for efficiency
IIoT deployments now deliver 52% productivity gains and 25% cost reductions as factories integrate sensors, analytics, and cloud dashboards. The U.S. Manufacturing Extension Partnership supported 36,000 firms in 2024, adding USD 16.2 billion in sales through smart manufacturing programs.As connected assets feed unified data lakes, operators can eliminate line stoppages and dynamically rebalance capacity. Precision-critical sectors such as aerospace embrace digital traceability to reduce scrap and warranty claims, fueling sustained upgrades in connectivity architectures.
Government incentives & policy mandates for digital factories
Federal and state-level funding initiatives are accelerating smart manufacturing adoption through targeted financial support and regulatory frameworks. The State Manufacturing Leadership Program offers USD 50 million to enhance manufacturing capacity through high-performance computing resources and technical assistance for small and medium manufacturers.Germany's Industrie 4.0 initiative projects EUR 40 billion annual investment by 2020, supported by Mittelstand 4.0 centers of excellence that provide SMEs with technology adoption guidance.
High CAPEX & uncertain SME ROI
Small and medium enterprises face significant barriers to smart manufacturing adoption due to substantial upfront capital requirements and unclear return on investment timelines. Implementation costs for comprehensive smart manufacturing systems can range from hundreds of thousands to millions of dollars, creating financial strain for companies with limited resources. The complexity of calculating ROI for interconnected systems makes it difficult for SME decision-makers to justify investments, particularly when benefits may not materialize for 2-3 years.
Other drivers and restraints analyzed in the detailed report include:
- Skilled-labour shortages accelerating automation uptake
- Carbon-Border Adjustment Mechanism spurring factory-level energy transparency
- Cyber-security / data-sovereignty concerns
For complete list of drivers and restraints, kindly check the Table Of Contents.
Segment Analysis
Manufacturing Execution Systems held 22.4% of the smart manufacturing market in 2024, underscoring their role as the digital backbone of plant operations. The smart manufacturing market size for MES is projected to reach USD 41.78 billion by 2032 as manufacturers mandate real-time visibility across global plants. Digital-twin platforms, expanding at an 18.7% CAGR, let engineers simulate equipment behavior under varying loads, trimming commissioning times by 30% . PLCs and SCADA remain foundational, yet vendors embed AI modules that autonomously tune parameters. Edge-analytics software shortens decision loops for high-speed packaging lines, illustrating the shift from centralized servers to shop-floor micro-data centers.
Software-defined upgrades create sticky annual recurring revenue, prompting incumbents to bundle analytics with license renewals. Human-machine interface tools migrate toward augmented reality, giving line technicians guided workflows. Product lifecycle management solutions integrate with supply-chain portals so designers validate manufacturability early. Collectively, these innovations reinforce the smart manufacturing market as the primary conduit for continuous improvement investments.
Software commanded 49.6% of 2024 revenue, reflecting the pivot toward data-driven workflows. Industrial robotics, projected to post a 17.5% CAGR, responds to chronic labor gaps and the need for flexible batch sizes.Smart sensors and machine-vision units feed high-resolution imagery to AI models that flag defects within milliseconds. Control devices now incorporate on-device inference engines, enabling autonomous adjustments without cloud latency. Service revenues expand as factories outsource integration, training, and managed cybersecurity.
Private 5G networks reshape the communication segment by supporting tens of thousands of end-points on a single floor with deterministic latency. Vendors co-develop spectrum strategies with telecom operators, turning connectivity into a strategic moat. As a result, the smart manufacturing market continues to blur lines between OT hardware and IT software, creating a unified platform for digital value creation.
The Smart Manufacturing Market is Segmented by Technology (Programmable Logic Controller (PLC), Supervisory Controller and Data Acquisition (SCADA), and More), Component (Hardware and More), Deployment Mode (On-Premise, Cloud and More), End-User Industry (Automotive, Semiconductors, and More), and Geography. The Market Forecasts are Provided in Terms of Value (USD).
Geography Analysis
North America accounted for 42.3% of 2024 revenue, underpinned by the U.S. Department of Energy's USD 33 million grant program and the Manufacturing Extension Partnership's nationwide outreach . Venture capital flows accelerate technology diffusion, and private equity funds pursue platform roll-ups that bundle MES, robotics integration, and cybersecurity services. Regional suppliers adopt private 5G testbeds to validate latency-sensitive use cases such as remote welding.
Asia Pacific is the fastest-growing region with a 15.9% CAGR, propelled by China's 33 Innovation Centers under the "Made in China 2025" banner and South Korea's world-leading robot density of 1,012 units per 10,000 employees. India's Digital Infrastructure Growth Initiative, backed by trilateral partners, lowers entry barriers for smart manufacturing startups, positioning the country as a rising hub for localized MES development.
Europe delivers steady adoption rooted in Germany's Industrie 4.0, backed by EUR 40 billion (USD 44 billion) annual investment projections and Mittelstand 4.0 competence centers. The Carbon Border Adjustment Mechanism amplifies demand for energy-intensity dashboards, giving European vendors first-mover advantage in carbon accounting modules. Collectively, these dynamics reinforce regional specialization within the smart manufacturing market, shaping vendor go-to-market playbooks.
- ABB Ltd.
- Emerson Electric Co.
- FANUC Corporation
- General Electric Co.
- Honeywell International Inc.
- Mitsubishi Electric Corp.
- Robert Bosch GmbH
- Rockwell Automation Inc.
- Schneider Electric SE
- Siemens AG
- Texas Instruments Inc.
- Yokogawa Electric Corp.
- Cisco Systems Inc.
- IBM Corp.
- Oracle Corp.
- SAP SE
- Johnson Controls Intl. plc
- PTC Inc.
- Dassault Systems SE
- 3D Systems Corp.
- Stratasys Ltd.
- Delta Electronics Inc.
- Capgemini SE
Additional Benefits:
- The market estimate (ME) sheet in Excel format
- 3 months of analyst support
TABLE OF CONTENTS
1 INTRODUCTION
- 1.1 Study Assumptions and Market Definition
- 1.2 Scope of the Study
2 RESEARCH METHODOLOGY
3 EXECUTIVE SUMMARY
4 MARKET LANDSCAPE
- 4.1 Market Overview
- 4.2 Market Drivers
- 4.2.1 Rising adoption of Industry 4.0 / IIoT for efficiency
- 4.2.2 Government incentives and policy mandates for digital factories
- 4.2.3 Skilled-labour shortages accelerating automation uptake
- 4.2.4 Carbon-Border Adjustment Mechanism (CBAM) spurring factory-level energy transparency
- 4.2.5 Digital-twin-based predictive-maintenance service revenues
- 4.2.6 Roll-out of private 5G networks enabling ultra-low-latency control
- 4.3 Market Restraints
- 4.3.1 High CAPEX and uncertain SME ROI
- 4.3.2 Cyber-security / data-sovereignty concerns
- 4.3.3 Legacy analogue equipment limiting interoperability
- 4.3.4 Semiconductor supply-chain volatility delaying control hardware
- 4.4 Value / Supply-Chain Analysis
- 4.5 Regulatory Landscape
- 4.6 Porters Five Forces
- 4.6.1 Bargaining Power of Suppliers
- 4.6.2 Bargaining Power of Buyers
- 4.6.3 Threat of New Entrants
- 4.6.4 Threat of Substitutes
- 4.6.5 Competitive Rivalry
- 4.7 Investment Analysis
5 MARKET SIZE AND GROWTH FORECASTS (VALUE)
- 5.1 By Technology
- 5.1.1 Programmable Logic Controller (PLC)
- 5.1.2 Supervisory Control and Data Acquisition (SCADA)
- 5.1.3 Enterprise Resource Planning (ERP)
- 5.1.4 Distributed Control System (DCS)
- 5.1.5 HumanMachine Interface (HMI)
- 5.1.6 Product Lifecycle Management (PLM)
- 5.1.7 Manufacturing Execution System (MES)
- 5.1.8 Digital-Twin Platforms
- 5.1.9 Edge-Analytics Software
- 5.1.10 Other Technologies
- 5.2 By Component
- 5.2.1 Hardware
- 5.2.1.1 Robotics
- 5.2.1.2 Sensors
- 5.2.1.3 Machine-Vision Systems
- 5.2.1.4 Control Devices
- 5.2.2 Software
- 5.2.2.1 MES
- 5.2.2.2 PLM
- 5.2.2.3 SCADA / ERP Suites
- 5.2.2.4 Digital-Twin / AI and Analytics
- 5.2.3 Services
- 5.2.3.1 Integration and Implementation
- 5.2.3.2 Consulting and Training
- 5.2.3.3 Managed Services
- 5.2.4 Communication Segment
- 5.2.1 Hardware
- 5.3 By Deployment Mode
- 5.3.1 On-Premise
- 5.3.2 Cloud
- 5.3.3 Hybrid
- 5.4 By End-user Industry
- 5.4.1 Automotive
- 5.4.2 Semiconductors and Electronics
- 5.4.3 Oil and Gas
- 5.4.4 Chemical and Petrochemical
- 5.4.5 Pharmaceuticals and Life Sciences
- 5.4.6 Aerospace and Defense
- 5.4.7 Food and Beverage
- 5.4.8 Metals and Mining
- 5.4.9 Energy and Utilities
- 5.4.10 Logistics and Warehousing
- 5.4.11 Other Industries
- 5.5 By Geography
- 5.5.1 North America
- 5.5.1.1 United States
- 5.5.1.2 Canada
- 5.5.1.3 Mexico
- 5.5.2 South America
- 5.5.2.1 Brazil
- 5.5.2.2 Argentina
- 5.5.2.3 Chile
- 5.5.2.4 Rest of South America
- 5.5.3 Europe
- 5.5.3.1 Germany
- 5.5.3.2 United Kingdom
- 5.5.3.3 France
- 5.5.3.4 Italy
- 5.5.3.5 Spain
- 5.5.3.6 Netherlands
- 5.5.3.7 Russia
- 5.5.3.8 Rest of Europe
- 5.5.4 APAC
- 5.5.4.1 China
- 5.5.4.2 Japan
- 5.5.4.3 India
- 5.5.4.4 South Korea
- 5.5.4.5 Australia and New Zealand
- 5.5.4.6 ASEAN-5
- 5.5.4.7 Rest of APAC
- 5.5.5 Middle East and Africa
- 5.5.5.1 Middle East
- 5.5.5.2 Africa
- 5.5.1 North America
6 COMPETITIVE LANDSCAPE
- 6.1 Market Concentration
- 6.2 Strategic Moves
- 6.3 Market Share Analysis
- 6.4 Company Profiles (includes Global level Overview, Market level overview, Core Segments, Financials as available, Strategic Information, Market Rank/Share, Products & Services, Recent Developments)
- 6.4.1 ABB Ltd.
- 6.4.2 Emerson Electric Co.
- 6.4.3 FANUC Corporation
- 6.4.4 General Electric Co.
- 6.4.5 Honeywell International Inc.
- 6.4.6 Mitsubishi Electric Corp.
- 6.4.7 Robert Bosch GmbH
- 6.4.8 Rockwell Automation Inc.
- 6.4.9 Schneider Electric SE
- 6.4.10 Siemens AG
- 6.4.11 Texas Instruments Inc.
- 6.4.12 Yokogawa Electric Corp.
- 6.4.13 Cisco Systems Inc.
- 6.4.14 IBM Corp.
- 6.4.15 Oracle Corp.
- 6.4.16 SAP SE
- 6.4.17 Johnson Controls Intl. plc
- 6.4.18 PTC Inc.
- 6.4.19 Dassault Systems SE
- 6.4.20 3D Systems Corp.
- 6.4.21 Stratasys Ltd.
- 6.4.22 Delta Electronics Inc.
- 6.4.23 Capgemini SE
7 MARKET OPPORTUNITIES AND FUTURE OUTLOOK
- 7.1 White-space and Unmet-need Assessment
 2026年全球云端製造市场报告
 智慧製造市场分析及预测(至2035年):按类型、产品类型、服务、技术、组件、应用、设备、流程及最终用户划分智慧製造平台市场分析及预测(至2035年):按类型、产品类型、服务、技术、组件、应用、部署类型、最终用户、功能和解决方案划分Dark Factory全球市场报告2026
 智慧製造市场规模、占有率、成长及全球产业分析:依类型、应用和地区划分的洞察与未来预测(2026-2034)
 北美智慧製造市场:市场占有率分析、产业趋势与统计、成长预测(2026-2031)
 日本智慧製造市场报告(按组件、技术、最终用途和地区划分,2026-2034 年)
 智慧製造自动化市场预测至2032年:按组件、产品类型、技术、部署类型、应用、最终用户和地区分類的全球分析
 智慧製造市场规模、份额和成长分析(按组件、技术、产业细分和地区划分)-2026-2033年产业预测
 智慧製造平台市场规模、份额和成长分析(按类型、组织规模、应用、产业和地区划分)-2026-2033年产业预测