


 |
市场调查报告书
商品编码
1850033
模组化资料中心:市场份额分析、行业趋势、统计数据和成长预测(2025-2030 年)Modular Data Center - Market Share Analysis, Industry Trends & Statistics, Growth Forecasts (2025 - 2030) |
||||||
※ 本网页内容可能与最新版本有所差异。详细情况请与我们联繫。
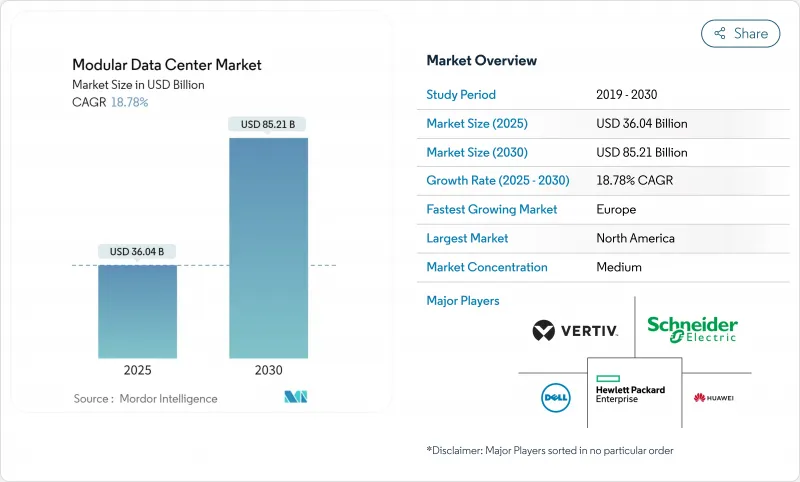
预计2025年模组化资料中心市场规模将达360.4亿美元,2030年将达852.1亿美元。
这一快速成长轨迹反映了向预製化、工厂整合设施的转变。人工智慧带来的高密度需求、靠近用户的边缘站点激增以及超大规模云端营运商的全球建置标准化推动了这一需求。曾经的小众液冷设计如今已具备商业性可行性,在某些情况下,其PUE值低于1.05,为许多新模组供电。同时,由于企业更倾向于承包整合而非内部组装,以服务为中心的收益正在加速成长。随着企业开始着眼于未来的工作负载而非适应过去的架构,待开发区计划也正在加速发展。
全球模组化资料中心市场趋势与洞察
边缘运算的快速部署
由于视讯分析、自主系统和工业IoT要求低于 10 毫秒的延迟,边缘部署的扩展速度远快于集中式设施。模组化资料中心市场受益于安装在零售屋顶、工厂车间和基地台机房的微型设施,因此无需长时间的施工。边缘资料中心预计将以 37.9% 的复合年增长率成长,电讯和运输业者越来越多地选择一体化预製机壳,这些机柜在出厂时已经过电源、冷却和机架的预先测试。Delta的 SmartNode 产品线展示了整合式电池组和直列冷却系统如何在恶劣的边缘环境中保持运作。服务供应商也重视在数百个远端位置复製设计的能力,从而简化备件和培训需求。对于供应商而言,分散式占地面积可以扩大容量,即使每个单独的占地面积都小于核心站点。
超大规模和云端采用激增
超大规模资料中心营运商每月新增的占地面积相当于几个足球场,而模组化资料中心市场正成为紧跟步伐的首选方式。模组化结构可实现跨大洲的一致品管,并将部署时间从18个月缩短至不到9个月。云端品牌受益于标准化的电源和网路拓扑,从而实现跨区域容量转移,并简化灾害復原规划。 ARANER预测,到2032年,超大规模资料中心产业规模将扩大至9,353亿美元,对快速容量扩建的需求持续存在。从机器人布线到基于人工智慧的气流调节的整合自动化系统,如今已配备许多模组,并支援远端位置的「熄灯」运行。这些因素共同增强了飞轮效应,缩短了建设週期,更快地释放了资金,从而实现了更频繁的扩张。
初始投资高且供应商锁定
工厂整合的电源模组成本在每兆瓦75万美元到100万美元之间,这对中小型企业来说是一笔不小的开销。专有互连技术加剧了资金筹措的复杂性,使得后期混合品牌的成本高昂,也加剧了企业对单一供应商锁定的担忧。由于低成本资本的取得管道有限,新兴市场的门槛更高。营运费用的节省最终抵消了溢价,而财务长通常更重视短期现金流而非全生命週期经济效益。提供租赁、收入分成或「容量即服务」协议的供应商可以缓解锁定感,并鼓励企业采用。
細項分析
到 2024 年,功能模组将占模组化资料中心市场收入的 62.12%。整合 UPS、冷却器和机架的标准化钢骨块提供了无风险的扩展途径。营运商确切地知道将到达码头的是什么以及它将如何运作。这种可预测性降低了计划管理开销并加快了併网审批。然而,随着越来越多的客户将从现场勘测到日常优化的所有工作外包出去,服务部门正以 19.45% 的更快复合核准成长。随着功率密度的增加,管理流体化学和调整 AI 工作负载等问题需要大多数 IT 团队内部不具备的利基技能。因此,服务提供者正在将设计、施工和长期营运结合到基于结果的合约中,将曾经的资本支出 (CapEx) 转变为持续的资本支出 (OpEx)。
在许多竞标中,功能模组如今整合了特定应用加速器、软体定义架构和基于人工智慧的遥测技术。最新一代的EPG整合了模组化开关设备、锂离子电池组和后门热交换器,无需地板穿透即可支援100kW机架。同时, Delta Power Solutions正在将咨询部门与附加元件微电网控制器相结合,以实现屋顶太阳能和燃料电池的利用。这些扩展的服务使Delta Power Solutions的服务线变得至关重要,随着复杂性的不断增加,其在Delta的模组化资料中心市场的份额可能会继续稳步上升。
模组化资料中心市场报告按解决方案和服务(功能模组化解决方案(独立功能模组和一体化功能模组)、服务)、应用程式(灾难备份、高效能/边缘运算、资料中心扩充、入门级资料中心)、建置类型(待开发区、棕地)和地区对产业进行分类。市场预测以货币单位(美元)提供。
区域分析
2024年,北美以43.44%的收益份额引领模组化资料中心市场,这得益于成熟的云端生态系和雄厚的资本基础。北维吉尼亚、达拉斯和凤凰城的大型计划占据了新增容量的大部分,由于人工智慧租户在专案竣工前就领先租下了整个阶段,空置率降至历史最低水平。该地区也受益于波特兰和哥伦布等强劲的次市场,这些地区的电力成本相对较低,且政府奖励有利于资本密集的待开发区计画。以硅谷和奥斯汀为中心的创新丛集更具吸引力,这意味着供应商可以在当地开发液态解决方案的原型,从而缩短迭代週期。
亚太地区是成长最快的地区,到2030年复合年增长率将达到21.23%。中国东海岸正在主要高速公路沿线部署模组化边缘节点,以支援自动驾驶卡车运输走廊;而印度的二线城市则正在采用预製货柜结构,以避免电网扩建延迟。目前,深圳、班加罗尔和雅加达均已运作预製货柜组装,从而降低了物流成本。对供应商而言,应对不同的管理体制仍然充满挑战,但其巨大的市场潜力足以弥补在地化带来的阻力。
欧洲处于中等水平,但发展势头强劲。 GDPR合规要求企业将资料锁定在其境内,这导致先前依赖跨境託管的较小国家出现了模组化资料中心。永续性也是一个重要议题:北欧业者正在强调使用海水或自由空气冷却的货柜式资料大厅,以获得绿色融资。大陆集团的需求也与汽车电气化息息相关,德国和法国的原始设备製造商在测试轨道附近的模组化单元中安装用于自动驾驶模型的人工智慧训练舱。如果安装阶段加速,欧洲模组化资料中心市场到2029年可能接近我们先前预测的645亿美元。
中东和非洲是新兴但利润丰厚的市场。海湾国家政府正在推行富有远见的数位经济计划,包括在沙漠边缘建造兆瓦级的待开发区混合园区。由于环境温度超过45°C,密封容器中的液体冷却可减少灰尘侵入,并减少冷冻水机组的占地面积。同时,非洲国家正利用模组化套件进行区域网路交换,一举解决延迟和资料主权问题。愿意提供建造-营运-转移模式的供应商将在这些地区超越传统实体设计的过程中获得先发优势。
其他福利:
- Excel 格式的市场预测 (ME) 表
- 3个月的分析师支持
目录
第一章 引言
- 研究假设和市场定义
- 调查范围
第二章调查方法
第三章执行摘要
第四章 市场状况
- 市场概况
- 市场驱动因素
- 快速部署边缘运算
- 超大规模和云端采用激增
- 行动性和可扩展性优势
- 5G推动快速建置需求
- AI驱动的高密度液冷模组
- 数据主权微区建设
- 市场限制
- 初始投资高且供应商锁定
- 电力效率与永续性之间的差距
- 大型设施的客製化有限
- 电网容量和许可瓶颈
- 价值/供应链分析
- 技术展望
- 监管格局
- 永续性和能源效率趋势
- 波特五力模型
- 供应商的议价能力
- 买方的议价能力
- 新进入者的威胁
- 替代品的威胁
- 竞争对手之间的竞争
- 评估宏观经济趋势对市场的影响
- 投资金筹措趋势
第五章市场规模及成长预测
- 按解决方案和服务
- 功能模组解决方案
- 独立模组
- 一体化模组
- 服务
- 咨询与设计
- 整合与部署
- 管理和维护
- 功能模组解决方案
- 按用途
- 灾害復原
- 边缘/高效能运算
- 资料中心扩展
- 新创/小型企业资料中心
- 人工智慧/图形处理单元训练舱
- 加密挖矿和 HPC 容器
- 依体质
- 待开发区
- 棕地
- 按地区
- 北美洲
- 美国
- 加拿大
- 墨西哥
- 欧洲
- 英国
- 德国
- 法国
- 义大利
- 西班牙
- 荷兰
- 其他欧洲地区
- 亚太地区
- 中国
- 日本
- 印度
- 韩国
- 新加坡
- 澳洲
- 马来西亚
- 其他亚太地区
- 南美洲
- 巴西
- 阿根廷
- 南美洲其他地区
- 中东
- 阿拉伯聯合大公国
- 沙乌地阿拉伯
- 土耳其
- 以色列
- 其他中东地区
- 非洲
- 南非
- 奈及利亚
- 埃及
- 其他非洲国家
- 北美洲
第六章 竞争态势
- 市场集中度
- 策略趋势
- 市占率分析
- 公司简介
- IBM Corp.
- Huawei Technologies
- Dell Technologies
- Hewlett Packard Enterprise
- Vertiv
- Schneider Electric
- Rittal
- Cannon Technologies
- Baselayer Tech
- Instant Data Centers
- Colt DCS
- Bladeroom Group
- Eaton Corp.
- Delta Electronics
- EdgeConneX
- PCX Holding
- Cisco Systems
- ABB Ltd.
- ZTE Corp.
- Aspen Systems
- DATAPOD Australia
- Synergy Associates
第七章 市场机会与未来展望
The modular data center market size reached USD 36.04 billion in 2025 and is on track to touch USD 85.21 billion by 2030, translating into an 18.78% CAGR over the forecast period.
The steep growth curve mirrors the shift toward prefabricated, factory-integrated facilities that can be deployed in weeks rather than quarters. Demand is fuelled by AI-driven density requirements, the spread of edge locations close to users, and hyperscale cloud operators standardizing global buildouts. Liquid-cool designs, once niche, now underpin many new modules as partial PUE values below 1.05 become commercially viable. At the same time, service-centric revenue is accelerating because enterprises want turnkey integration rather than in-house assembly, while greenfield projects are gathering speed as organisations design for tomorrow's workloads instead of adapting yesterday's shells.
Global Modular Data Center Market Trends and Insights
Rapid Edge-Computing Rollout
Edge deployments are growing much faster than centralised facilities as video analytics, autonomous systems, and industrial IoT call for sub-10 millisecond latency. The modular data center market benefits because micro facilities can be dropped into retail rooftops, factory floors, or base-station shelters without lengthy site work. With edge data centers forecast to expand at 37.9% CAGR, operators in telecom and transportation increasingly select all-in-one prefabricated enclosures that ship with power, cooling, and racks pre-tested. Delta's SmartNode line shows how integrated battery strings and in-row chillers maintain uptime in harsh edge environments. Service providers also value the ability to duplicate designs across hundreds of remote points, streamlining spares and training needs. For vendors, the distributed footprint expands addressable unit volumes even if individual footprints are smaller than core sites.
Hyperscale and Cloud Adoption Surge
Hyperscale operators add floor area equivalent to several football fields every month, and the modular data center market is becoming a preferred way to meet that pace. Modular blocks allow consistent quality control across continents and collapse deployment timelines from 18 months to less than 9 months. Cloud brands benefit from standardised power and network topologies that make capacity fungible across regions, easing disaster-recovery planning. ARANER projects the hyperscale data-center sector will balloon to USD 935.3 billion by 2032, sustaining demand for rapid-build capacity. Integrated automation-ranging from robotic cabling to AI-based airflow tuning-now ships with many modules, supporting remote "lights-out" operations. Collectively, these factors reinforce a flywheel effect: shorter build cycles free capital sooner, enabling more frequent expansions.
High Upfront CAPEX and Vendor Lock-In
Factory-integrated power modules can cost USD 750,000-1 million per MW, a sizeable cheque for smaller enterprises. Financing complexities are compounded by proprietary interconnects that make it costly to mix brands later, raising fears of being tied to a single supplier. In emerging markets, limited access to low-cost capital accentuates the hurdle. While operating savings eventually offset the premium, CFOs often prioritise near-term cash flow over lifetime economics. Vendors that offer leasing, revenue-share, or "capacity as a service" arrangements can mitigate the perception of lock-in and help broaden adoption.
Other drivers and restraints analyzed in the detailed report include:
- AI-Driven High-Density Liquid-Cool Modules
- 5G-Triggered Quick-Build Demand
- Power-Efficiency and Sustainability Gaps
For complete list of drivers and restraints, kindly check the Table Of Contents.
Segment Analysis
Functional modules dominated the modular data center market in 2024, underpinned by their 62.12% share of revenue. Standardised steel-frame blocks equipped with integrated UPS, chillers, and racks have become a de-risked path for expansion: operators know exactly what arrives at the dock and how it will perform. That predictability lowers project management overhead and speeds up grid-tie approvals. Yet, the services segment is on a steeper 19.45% CAGR because clients increasingly outsource everything from site surveys to day-two optimisation. As power densities rise, issues such as fluid chemistry management or AI workload tuning require niche skills that most IT teams do not maintain in-house. Consequently, service providers bundle design, build, and long-term operations into outcome-based contracts, turning what was once CapEx into ongoing OpEx.
In many bids, functional modules now integrate application-specific accelerators, software-defined fabrics, and AI-based telemetry out of the box. EPG's latest generation incorporates modular switchgear, lithium-ion battery strings, and rear-door heat exchangers to support 100 kW racks without floor penetrations. Meanwhile, Delta Power Solutions couples its consulting arm with add-on microgrid controllers so that sites can tap rooftop solar or fuel cells. These extended offerings make the service line indispensable, and its share of the broader modular data center market will likely keep inching upward as complexity snowballs.
Modular Data Center Market Report Segments the Industry Into Solution and Services (Function Module Solution (Individual Function Module and All-In-One Function Module), Services), Application (Disaster Backup, High Performance/ Edge Computing, Data Center Expansion, Starter Data Centers), Build Type (Greenfield, Brownfield), and Geography. The Market Forecasts are Provided in Terms of Value (USD).
Geography Analysis
North America led the modular data center market in 2024 with a 43.44% revenue share thanks to a mature cloud ecosystem and capital depth. Large-scale projects in Northern Virginia, Dallas, and Phoenix accounted for a significant chunk of new capacity, and vacancy rates fell to record lows as AI tenants pre-leased entire phases even before construction completed. The region also benefits from robust secondary markets such as Portland and Columbus, where electricity costs remain comparatively low and state incentives sweeten capital-intensive greenfield deals. Cooling innovation clusters around Silicon Valley and Austin mean suppliers can prototype liquid solutions locally, shortening iteration cycles.
Asia-Pacific ranks as the fastest-growing theatre with a 21.23% CAGR through 2030, reflecting the surge in 5G rollouts, e-commerce penetration, and sovereign-cloud frameworks. China's eastern seaboard is layering modular edge nodes along major highways to support autonomous trucking corridors, while India's tier-2 cities adopt prefabricated shells to bypass grid-expansion delays. Government policies encouraging indigenous manufacturing amplify the move-prefab container assembly lines now operate in Shenzhen, Bangalore, and Jakarta, cutting logistics costs. For suppliers, navigating diverse regulatory regimes remains challenging, but volume potential outweighs localisation friction.
Europe sits mid-pack yet exhibits distinct drivers. GDPR compliance prompts enterprises to ring-fence data within national borders, so modular blocks pop up in smaller countries that previously relied on cross-border hosting. Sustainability imperatives loom large: Nordic operators highlight containerised data halls cooled with seawater or free air to secure green financing. Continental demand also ties to automotive electrification, with OEMs in Germany and France setting up AI training pods for autonomous-driving models inside modular units adjacent to proving grounds. As the fit-out phase accelerates, the modular data center market size for Europe could approach previously forecast USD 64.5 billion by 2029.
The Middle East and Africa represent nascent yet high-margin opportunities. Governments in the Gulf push vision-funded digital-economy plans that include megawatt-class greenfield campuses built on desert outskirts with solar hybrids. Because ambient temperatures exceed 45 °C, liquid cooling inside sealed containers mitigates dust ingress and reduces chill-water plant footprints. African nations, meanwhile, leverage modular kits for regional internet exchanges, addressing latency and data sovereignty in one stroke. Suppliers willing to offer build-operate-transfer models stand to gain early-mover advantage as these regions leapfrog traditional brick-and-mortar designs.
- IBM Corp.
- Huawei Technologies
- Dell Technologies
- Hewlett Packard Enterprise
- Vertiv
- Schneider Electric
- Rittal
- Cannon Technologies
- Baselayer Tech
- Instant Data Centers
- Colt DCS
- Bladeroom Group
- Eaton Corp.
- Delta Electronics
- EdgeConneX
- PCX Holding
- Cisco Systems
- ABB Ltd.
- ZTE Corp.
- Aspen Systems
- DATAPOD Australia
- Synergy Associates
Additional Benefits:
- The market estimate (ME) sheet in Excel format
- 3 months of analyst support
TABLE OF CONTENTS
1 INTRODUCTION
- 1.1 Study Assumptions and Market Definition
- 1.2 Scope of the Study
2 RESEARCH METHODOLOGY
3 EXECUTIVE SUMMARY
4 MARKET LANDSCAPE
- 4.1 Market Overview
- 4.2 Market Drivers
- 4.2.1 Rapid edge-computing rollout
- 4.2.2 Hyperscale and cloud adoption surge
- 4.2.3 Mobility and scalability advantages
- 4.2.4 5G-triggered quick-build demand
- 4.2.5 AI-driven high-density liquid-cool modules
- 4.2.6 Data-sovereignty micro-regional builds
- 4.3 Market Restraints
- 4.3.1 High upfront CAPEX and vendor lock-in
- 4.3.2 Power-efficiency and sustainability gaps
- 4.3.3 Limited customisation for mega-facilities
- 4.3.4 Grid-capacity and permitting bottlenecks
- 4.4 Value / Supply-Chain Analysis
- 4.5 Technological Outlook
- 4.6 Regulatory Landscape
- 4.7 Sustainability and Energy-Efficiency Trends
- 4.8 Porter's Five Forces
- 4.8.1 Bargaining Power of Suppliers
- 4.8.2 Bargaining Power of Buyers
- 4.8.3 Threat of New Entrants
- 4.8.4 Threat of Substitutes
- 4.8.5 Intensity of Competitive Rivalry
- 4.9 Assessment of the impact of Macro Economic Trends on the Market
- 4.10 Investment and Financing Trends
5 MARKET SIZE and GROWTH FORECASTS (VALUE)
- 5.1 By Solution and Services
- 5.1.1 Functional-Module Solution
- 5.1.1.1 Individual Module
- 5.1.1.2 All-in-One Module
- 5.1.2 Services
- 5.1.2.1 Consulting and Design
- 5.1.2.2 Integration and Deployment
- 5.1.2.3 Managed and Maintenance
- 5.1.1 Functional-Module Solution
- 5.2 By Application
- 5.2.1 Disaster Recovery
- 5.2.2 Edge / High-Performance Computing
- 5.2.3 Data Center Expansion
- 5.2.4 Starter / SMB Data Centers
- 5.2.5 Artificial Intelligence / Graphical Processing Units Training Pods
- 5.2.6 Crypto-Mining and HPC Containers
- 5.3 By Build Type
- 5.3.1 Greenfield
- 5.3.2 Brownfield
- 5.4 By Geography
- 5.4.1 North America
- 5.4.1.1 United States
- 5.4.1.2 Canada
- 5.4.1.3 Mexico
- 5.4.2 Europe
- 5.4.2.1 United Kingdom
- 5.4.2.2 Germany
- 5.4.2.3 France
- 5.4.2.4 Italy
- 5.4.2.5 Spain
- 5.4.2.6 Netherlands
- 5.4.2.7 Rest of Europe
- 5.4.3 Asia-Pacific
- 5.4.3.1 China
- 5.4.3.2 Japan
- 5.4.3.3 India
- 5.4.3.4 South Korea
- 5.4.3.5 Singapore
- 5.4.3.6 Australia
- 5.4.3.7 Malaysia
- 5.4.3.8 Rest of Asia-Pacific
- 5.4.4 South America
- 5.4.4.1 Brazil
- 5.4.4.2 Argentina
- 5.4.4.3 Rest of South America
- 5.4.5 Middle East
- 5.4.5.1 UAE
- 5.4.5.2 Saudi Arabia
- 5.4.5.3 Turkey
- 5.4.5.4 Israel
- 5.4.5.5 Rest of Middle East
- 5.4.6 Africa
- 5.4.6.1 South Africa
- 5.4.6.2 Nigeria
- 5.4.6.3 Egypt
- 5.4.6.4 Rest of Africa
- 5.4.1 North America
6 COMPETITIVE LANDSCAPE
- 6.1 Market Concentration
- 6.2 Strategic Moves
- 6.3 Market Share Analysis
- 6.4 Company Profiles (includes Global level Overview, Market level overview, Core Segments, Financials as available, Strategic Information, Market Rank/Share for key companies, Products and Services, and Recent Developments)
- 6.4.1 IBM Corp.
- 6.4.2 Huawei Technologies
- 6.4.3 Dell Technologies
- 6.4.4 Hewlett Packard Enterprise
- 6.4.5 Vertiv
- 6.4.6 Schneider Electric
- 6.4.7 Rittal
- 6.4.8 Cannon Technologies
- 6.4.9 Baselayer Tech
- 6.4.10 Instant Data Centers
- 6.4.11 Colt DCS
- 6.4.12 Bladeroom Group
- 6.4.13 Eaton Corp.
- 6.4.14 Delta Electronics
- 6.4.15 EdgeConneX
- 6.4.16 PCX Holding
- 6.4.17 Cisco Systems
- 6.4.18 ABB Ltd.
- 6.4.19 ZTE Corp.
- 6.4.20 Aspen Systems
- 6.4.21 DATAPOD Australia
- 6.4.22 Synergy Associates
7 MARKET OPPORTUNITIES and FUTURE OUTLOOK
- 7.1 White-space and Unmet-Need Assessment
 模组化资料中心市场:按组件、冷却技术、资料中心等级、机架容量、应用、产业、部署类型和组织规模划分-2026-2032年全球市场预测
 2026年全球模组化资料中心市场报告
 全球模组化资料中心市场规模、份额、趋势和成长分析报告(2026-2034年)
 模组化资料中心市场-全球产业规模、份额、趋势、机会和预测:按组件、组织规模、产业垂直领域、市场区域和竞争格局划分,2021-2031年
 2026-2030年全球模组化资料中心市场
 日本模组化资料中心市场报告:按组件、资料中心规模、应用、产业和地区划分,2026-2034年
 模组化资料中心市场规模、份额和成长分析(按资料中心规模、产业垂直领域、UPS 类型和地区划分)-2026 年至 2033 年产业预测
 预製模组化资料中心:全球市场份额和排名、总收入和需求预测(2025-2031年)模组化资料中心市场规模、份额、趋势及预测(按组件、资料中心规模、应用、产业垂直和地区),2025 年至 2033 年全球模组化资料中心市场规模按组件、组织规模、最终用户、地区和预测划分: