


 |
市场调查报告书
商品编码
1850044
移动式製图系统:市场占有率分析、产业趋势、统计数据和成长预测(2025-2030 年)Mobile Mapping Systems - Market Share Analysis, Industry Trends & Statistics, Growth Forecasts (2025 - 2030) |
||||||
※ 本网页内容可能与最新版本有所差异。详细情况请与我们联繫。
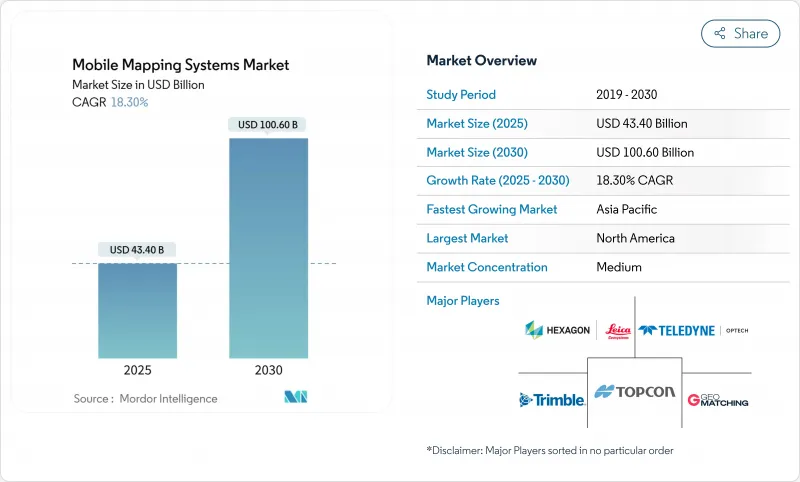
预计到 2025 年,移动式製图系统市场规模将达到 434 亿美元,到 2030 年将达到 1,006 亿美元,复合年增长率为 18.30%。
人工智慧驱动的企业级特征提取技术以及固体雷达价格的持续下降,不断提升服务供应商和终端用户的利润率,重塑了采购经济格局。政府数位双胞胎技术的强制要求、与车辆无关的感测器有效载荷的兴起以及新型订阅经营模式的出现,推动了基础设施、采矿和紧急管理等领域的应用。同时,供应商不断加强软体集成,缩短了数据到决策的周期,扩大了移动式製图系统市场的潜在用户群,并加剧了对增值分析的竞争。
全球移动式製图系统市场趋势与洞察
与任何车辆集成
将感测器应用于铁路车辆、卡车、自动驾驶班车甚至船舶的能力,拓宽了移动式製图系统的市场。德国铁路公司于2022年认证了Trimble的MX9平台,使其能够以100公里/小时的速度进行铁路测绘,检验了其在欧洲铁路走廊沿线不间断的资产采集能力。先前需要安排週末停运进行人工光达扫描的交通运输机构,现在可以在正常运作期间部署与车辆无关的有效载荷,从而加快检查週期并降低安全风险。在德国和加拿大城市数位双胞胎专案中,类似的整合应用也使自动街道清洁车能够进行夜间路缘级测绘,这表明跨平台相容性正在成为设备製造商的收入增长点。
政府强制推行数位双胞胎
英国国家数位孪生倡议等国家级计画制定了强制性资料标准,要求输入公分级三维资料。各市政当局积极响应,委託开展道路、桥樑和公共建筑的高密度移动激光雷达(LiDAR)测绘,以创建城市尺度的孪生模型,从而签订多年服务合同,并刺激了现代化传感器钻机的采购。乌普萨拉生物多样性走廊计画将光达与地理资讯系统(GIS)分析相结合,充分展现了监管推动如何转化为对动态、可更新空间资料集的即时需求。因此,移动式製图系统市场受益于与长期基础设施韧性目标相关的可预测的公共部门资金流。
购置和部署系统成本高昂
顶级行动测绘套装的价格仍然在25万美元到75万美元之间,对于规模较小的土木工程公司而言仍然难以负担。马来西亚2022年的一项道路设计研究指出,儘管雷射雷达(LiDAR)具有明显的技术优势,但由于资本支出问题,竞标被推迟。在拉丁美洲和非洲,资金筹措障碍更大,当地银行很少提供以资产为抵押的专用地理空间硬体租赁服务。供应商推出了「测绘即服务」订阅模式,但前期投资仍是限制移动式製图系统市场潜在需求的最大因素。
细分市场分析
到2024年,硬体部分将占据移动式製图系统市场份额的51%,这印证了该领域长期以来对资本密集型感测器套件的依赖。高阶车载钻机将3.6MHz雷射扫描器与7,200万像素全景相机结合,而像徕卡BLK2GO这样的手持设备则将雷射雷达和视觉SLAM技术整合到仅重一公斤的设备中。然而,感测器尺寸的缩小和固态技术的创新降低了单位成本,使得设备更新换代更加频繁,并促进了模组化升级。
预计到2030年,服务领域将以20.70%的复合年增长率实现最快成长,这主要得益于企业将复杂的资料处理外包。人工智慧云端平台能够将原始点云资料转换为可用于CAD的成品,从而降低企业内部营运成本。这种模式已将利润来源从硬体利润转向经常性分析收入,加速了移动式製图系统市场的结构转型。随着按需付费服务在新兴经济体的普及,移动式製图系统即服务(MaaS)的市场规模预计将进一步扩大。
到2024年,车载平台将占据移动式製图系统市场62%的份额,主要用于高速公路和铁路沿线。安装在SUV上的双头扫描仪一次即可采集路面磨损情况和路边设施信息,从而整合整个机构的交通预算。
无人机有效载荷以12.90%的复合年增长率快速成长,使得垂直矿井、悬崖峭壁和灾区等区域能够进行快速的雷射雷达覆盖。更轻的固态感测器提高了飞行续航能力,而机载人工智慧则能即时过滤植被,从而减少后续的作业量。轨道专用滑车和背包式设备满足了特定需求,丰富了设备配置,这将为未来移动式製图系统市场规模的成长提供支撑。
移动式製图市场按组件(硬体、软体、服务)、安装类型(车载、轨道交通、其他)、应用(影像服务、航空移动式製图、其他)、最终用户(政府、石油天然气、矿业、军事、其他)和地区进行细分。市场预测以美元计价。
区域分析
到2024年,北美将占据移动式製图系统市场38%的份额。联邦基础设施建设资金和充足的国防情报、监视与侦察(ISR)预算促进了感测器需求的稳定成长。试验计画表明,在全州范围内投资1美元用于移动雷射雷达(LiDAR)建设,可获得2美元的回报,从而加强了预算分配。日趋成熟的生态系统、充足的熟练劳动力以及国内供应商积极的研发活动,共同协助该地区保持领先地位。
亚太地区以19.30%的复合年增长率成为成长最快的地区,这主要得益于中国和印度的智慧城市建设投入、日本的韧性规划以及韩国的自动驾驶车辆测绘走廊计画。到2025年,亚太地区的用户将占到热门设备比价网站全球流量的近一半,显示该地区用户参与度高,并将促成无人机和车辆系统的订单。低成本感测器正在推动地方政府部门的入门级应用,从而扩大移动式製图系统市场的基础。
欧洲、中东和非洲以及南美洲的需求呈现出多样化的特征。在欧洲,永续性指令推动了环境监测计划的发展,例如德国城市中的卡车交通雷射雷达监测。在中东,管道和特大城市计画占据了主导地位,而巴西和智利的采矿业则促进了南美洲的销售。非洲市场仍处于起步阶段,但南非的基础设施勘测计画为其带来了成长动力。在所有地区,移动式製图与云端运算、物联网和人工智慧的整合都为垂直产业应用提供了支撑,从而推动了全球移动式製图系统市场的发展。
其他福利:
- Excel格式的市场预测(ME)表
- 3个月的分析师支持
目录
第一章 引言
- 研究假设和市场定义
- 调查范围
第二章调查方法
第三章执行摘要
第四章 市场情势
- 市场概览
- 市场驱动因素
- 可与任何类型的车辆集成
- 政府数位双胞胎授权
- 固态光达成本下降
- 利用人工智慧进行自动特征提取
- 介绍自主机器人和无人机
- 国防情报、监视与侦察现代化预算
- 市场限制
- 购置和实施系统成本高
- 熟练操作人员短缺
- 资料隐私和监控法规
- 建筑业资本投资的週期性
- 供应链分析
- 监管环境
- 技术展望
- 波特五力分析
- 供应商的议价能力
- 消费者议价能力
- 新进入者的威胁
- 替代品的威胁
- 竞争对手之间的竞争
第五章 市场规模与成长预测
- 按组件
- 硬体
- 软体
- 服务
- 按安装类型
- 车载类型
- 铁路车辆安装型
- 无人机搭载
- 其他的
- 透过使用
- 影像服务
- 空中移动式製图
- 紧急应变计划
- 网路应用
- 设施管理
- 卫星
- 按最终用户行业划分
- 政府
- 石油和天然气
- 矿业
- 军队
- 其他终端用户产业
- 按地区
- 北美洲
- 美国
- 加拿大
- 墨西哥
- 欧洲
- 英国
- 德国
- 法国
- 义大利
- 其他欧洲地区
- 亚太地区
- 中国
- 日本
- 印度
- 韩国
- 亚太其他地区
- 中东
- 以色列
- 沙乌地阿拉伯
- 阿拉伯聯合大公国
- 土耳其
- 其他中东地区
- 非洲
- 南非
- 埃及
- 其他非洲地区
- 南美洲
- 巴西
- 阿根廷
- 其他南美洲
- 北美洲
第六章 竞争情势
- 市场集中度
- 策略趋势
- 市占率分析
- 公司简介
- Leica Geosystems AG(Hexagon AB)
- Trimble Inc.
- Topcon Corporation
- Teledyne Optech Inc.
- RIEGL Laser Measurement Systems GmbH
- Zoller+Frohlich GmbH
- NavVis GmbH
- GeoSLAM Ltd.
- Kaarta Inc.
- Mandli Communications Inc.
- Applanix Corporation
- Siteco Informatica Srl
- YellowScan
- Fugro NV
- Cyclomedia Technology BV
- Imajing SAS
- Velodyne Lidar Inc.
- Ouster Inc.
- SureStar Technology Co., Ltd.
- Innoviz Technologies Ltd.
- Hesai Technology Co., Ltd.
- RoboSense(Suteng Innovation Technology Co., Ltd.)
- OxTS Ltd.
第七章 市场机会与未来展望
The mobile mapping systems market size is estimated at USD 43.4 billion in 2025 and is projected to reach USD 100.6 billion by 2030, reflecting an 18.30% CAGR.
Enterprise-grade feature extraction powered by artificial intelligence and steadily falling solid-state LiDAR prices continued to reshape acquisition economics, improving margins for service providers and end users. Government digital-twin mandates, the rise of vehicle-agnostic sensor payloads, and new subscription business models expanded adoption in infrastructure, mining, and emergency management. Meanwhile, vendors increased software integrations that shorten data-to-decision cycles, broadening the mobile mapping systems market addressable base and intensifying competition around value-added analytics.
Global Mobile Mapping Systems Market Trends and Insights
Integration with All Kinds of Vehicles
The ability to mount sensors on railcars, trucks, autonomous shuttles, and even boats widened the mobile mapping systems market scope. Deutsche Bahn certified Trimble's MX9 platform for 100 km/h rail surveys in 2022, validating non-stop asset capture for European rail corridors. Transportation agencies that previously scheduled weekend closures for manual LiDAR scans now deploy vehicle-independent payloads during regular service, accelerating inspection cycles and reducing safety risks. Similar integrations on autonomous road sweepers enabled night-time curb-level mapping for urban digital-twin programs in Germany and Canada, demonstrating how cross-platform compatibility has become a revenue driver for equipment makers.
Government Digital-Twin Mandates
National programs such as the United Kingdom's National Digital Twin initiative established compulsory data standards that require centimeter-grade 3D inputs. Municipalities responded by commissioning high-density mobile LiDAR of roadways, bridges, and public buildings to populate city-scale twins, spawning multi-year service contracts and stimulating procurement of modern sensor rigs. Uppsala's biodiversity corridor planning, which combined LiDAR with GIS analytics, showed how regulatory push translated into immediate demand for dynamic, update-ready spatial datasets. The mobile mapping systems market, therefore, benefited from predictable public-sector funding streams tied to long-range infrastructure resilience goals.
High Cost of System Acquisition and Deployment
Top-tier mobile mapping packages still commanded USD 250,000-750,000, a threshold that remained prohibitive for small civil-engineering firms. A Malaysian road-design study in 2022 highlighted cap-ex as the main reason LiDAR bidding was deferred despite clear technical gains. Financing hurdles were sharper in Latin America and Africa, where local banks rarely offered asset-backed leasing for specialized geospatial hardware. Vendors responded with "mapping-as-a-service" subscriptions, yet up-front investment persisted as the most significant drag on addressable demand within the mobile mapping systems market.
Other drivers and restraints analyzed in the detailed report include:
- Declining Solid-State LiDAR Costs
- AI-Powered Automatic Feature Extraction
- Skilled-Operator Shortage
For complete list of drivers and restraints, kindly check the Table Of Contents.
Segment Analysis
The hardware segment accounted for 51% of the mobile mapping systems market share in 2024, underscoring its past reliance on capital-intensive sensor suites. Premium vehicle rigs paired 3.6 MHz laser scanners with 72 MP panoramic cameras, while handheld units such as Leica's BLK2GO blended LiDAR with visual SLAM in one-kilogram packages. However, shrinking sensor footprints and solid-state innovations compressed unit costs, allowing more frequent refresh cycles and fostering modular upgrades.
The services segment achieved the fastest 20.70% CAGR through 2030 as organizations outsourced complex data processing. AI-enabled cloud platforms converted raw point clouds into CAD-ready deliverables, lowering internal overheads. This model shifted profit pools from hardware margins toward recurring analytics revenue, accelerating a structural transition in the mobile mapping systems market. The mobile mapping systems market size attached to services is projected to widen as pay-per-use offerings broaden access in emerging economies.
Vehicle-mounted platforms controlled 62% of the mobile mapping systems market in 2024, favored for highway and rail corridors where uninterrupted acquisition at posted speeds maximized productivity. Dual-head scanners on SUVs captured both pavement distress and roadside assets during a single pass, consolidating budgets across transportation agencies.
Drone-based payloads, expanding at 12.90% CAGR, opened vertical mines, cliff faces, and disaster zones to rapid LiDAR coverage. Lighter solid-state sensors extended flight endurance while onboard AI filtered vegetation in real time, reducing downstream workload. Railway-specific trolleys and backpack units addressed niche needs yet collectively contributed to a diversified equipment mix underpinning future mobile mapping systems market size momentum.
Mobile Mapping Market is Segmented by Component (Hardware, Software, Services), Mounting Type (Vehicle Mounted, Railway Mounted, and More), Application (Imaging Services, Aerial Mobile Mapping, and More), End-User Verticals (Government, Oil and Gas, Mining, Military, Others), and Geography. The Market Forecasts are Provided in Terms of Value (USD).
Geography Analysis
North America accounted for 38% of the mobile mapping systems market in 2024. Federal infrastructure funding and strong defense ISR budgets nurtured steady sensor demand. Pilot programs demonstrated a USD 2 return for every USD 1 invested in statewide mobile LiDAR, reinforcing budget allocations. Ecosystem maturity, abundant skilled labor, and aggressive R and D by domestic vendors sustained the region's leadership.
Asia-Pacific recorded the fastest 19.30% CAGR, driven by smart-city spending in China and India, Japan's resilience planning, and South Korea's autonomous-vehicle mapping corridors. Nearly half of global traffic on popular equipment-comparison portals originated from Asia-Pacific users in 2025, signaling high engagement that translated into orders for both drone and vehicle systems. Lower-cost sensors broadened entry-level uptake among provincial agencies, expanding the mobile mapping systems market footprint.
Europe, the Middle East, Africa, and South America presented mixed demand profiles. European mandates around sustainability spurred environmental monitoring projects such as truck-traffic lidar in German cities. The Middle East prioritized pipeline and megacity initiatives, while Brazilian and Chilean mines underpinned South American sales. Africa remained nascent but showed momentum in South African infrastructure surveys. Across all regions, integration of mobile mapping with cloud, IoT, and AI underpinned cross-vertical use cases, lifting the global mobile mapping systems market momentum.
- Leica Geosystems AG (Hexagon AB)
- Trimble Inc.
- Topcon Corporation
- Teledyne Optech Inc.
- RIEGL Laser Measurement Systems GmbH
- Zoller+Frohlich GmbH
- NavVis GmbH
- GeoSLAM Ltd.
- Kaarta Inc.
- Mandli Communications Inc.
- Applanix Corporation
- Siteco Informatica Srl
- YellowScan
- Fugro N.V.
- Cyclomedia Technology BV
- Imajing SAS
- Velodyne Lidar Inc.
- Ouster Inc.
- SureStar Technology Co., Ltd.
- Innoviz Technologies Ltd.
- Hesai Technology Co., Ltd.
- RoboSense (Suteng Innovation Technology Co., Ltd.)
- OxTS Ltd.
Additional Benefits:
- The market estimate (ME) sheet in Excel format
- 3 months of analyst support
TABLE OF CONTENTS
1 INTRODUCTION
- 1.1 Study Assumptions and Market Definition
- 1.2 Scope of the Study
2 RESEARCH METHODOLOGY
3 EXECUTIVE SUMMARY
4 MARKET LANDSCAPE
- 4.1 Market Overview
- 4.2 Market Drivers
- 4.2.1 Integration with All Kinds of Vehicles
- 4.2.2 Government Digital-Twin Mandates
- 4.2.3 Declining Solid-State LiDAR Costs
- 4.2.4 AI-Powered Automatic Feature Extraction
- 4.2.5 Autonomous Robots and Drone Adoption
- 4.2.6 Defense ISR Modernization Budgets
- 4.3 Market Restraints
- 4.3.1 High Cost of System Acquisition and Deployment
- 4.3.2 Skilled-Operator Shortage
- 4.3.3 Data-Privacy and Surveillance Regulations
- 4.3.4 Construction-Sector Cap-ex Cyclicality
- 4.4 Supply Chain Analysis
- 4.5 Regulatory Landscape
- 4.6 Technological Outlook
- 4.7 Porter's Five Forces Analysis
- 4.7.1 Bargaining Power of Suppliers
- 4.7.2 Bargaining Power of Consumers
- 4.7.3 Threat of New Entrants
- 4.7.4 Threat of Substitutes
- 4.7.5 Intensity of Competitive Rivalry
5 MARKET SIZE AND GROWTH FORECASTS (VALUE)
- 5.1 By Component
- 5.1.1 Hardware
- 5.1.2 Software
- 5.1.3 Services
- 5.2 By Mounting Type
- 5.2.1 Vehicle Mounted
- 5.2.2 Railway Mounted
- 5.2.3 Drone Mounted
- 5.2.4 Others
- 5.3 By Application
- 5.3.1 Imaging Services
- 5.3.2 Aerial Mobile Mapping
- 5.3.3 Emergency Response Planning
- 5.3.4 Internet Applications
- 5.3.5 Facility Management
- 5.3.6 Satellite
- 5.4 By End-user Verticals
- 5.4.1 Government
- 5.4.2 Oil and Gas
- 5.4.3 Mining
- 5.4.4 Military
- 5.4.5 Other End-user Verticals
- 5.5 By Region
- 5.5.1 North America
- 5.5.1.1 United States
- 5.5.1.2 Canada
- 5.5.1.3 Mexico
- 5.5.2 Europe
- 5.5.2.1 United Kingdom
- 5.5.2.2 Germany
- 5.5.2.3 France
- 5.5.2.4 Italy
- 5.5.2.5 Rest of Europe
- 5.5.3 Asia-Pacific
- 5.5.3.1 China
- 5.5.3.2 Japan
- 5.5.3.3 India
- 5.5.3.4 South Korea
- 5.5.3.5 Rest of Asia-Pacific
- 5.5.4 Middle East
- 5.5.4.1 Israel
- 5.5.4.2 Saudi Arabia
- 5.5.4.3 United Arab Emirates
- 5.5.4.4 Turkey
- 5.5.4.5 Rest of Middle East
- 5.5.5 Africa
- 5.5.5.1 South Africa
- 5.5.5.2 Egypt
- 5.5.5.3 Rest of Africa
- 5.5.6 South America
- 5.5.6.1 Brazil
- 5.5.6.2 Argentina
- 5.5.6.3 Rest of South America
- 5.5.1 North America
6 COMPETITIVE LANDSCAPE
- 6.1 Market Concentration
- 6.2 Strategic Moves
- 6.3 Market Share Analysis
- 6.4 Company Profiles (includes Global Level Overview, Market Level Overview, Core Segments, Financials as available, Strategic Information, Market Rank/Share for key companies, Products and Services, and Recent Developments)
- 6.4.1 Leica Geosystems AG (Hexagon AB)
- 6.4.2 Trimble Inc.
- 6.4.3 Topcon Corporation
- 6.4.4 Teledyne Optech Inc.
- 6.4.5 RIEGL Laser Measurement Systems GmbH
- 6.4.6 Zoller+Frohlich GmbH
- 6.4.7 NavVis GmbH
- 6.4.8 GeoSLAM Ltd.
- 6.4.9 Kaarta Inc.
- 6.4.10 Mandli Communications Inc.
- 6.4.11 Applanix Corporation
- 6.4.12 Siteco Informatica Srl
- 6.4.13 YellowScan
- 6.4.14 Fugro N.V.
- 6.4.15 Cyclomedia Technology BV
- 6.4.16 Imajing SAS
- 6.4.17 Velodyne Lidar Inc.
- 6.4.18 Ouster Inc.
- 6.4.19 SureStar Technology Co., Ltd.
- 6.4.20 Innoviz Technologies Ltd.
- 6.4.21 Hesai Technology Co., Ltd.
- 6.4.22 RoboSense (Suteng Innovation Technology Co., Ltd.)
- 6.4.23 OxTS Ltd.
7 MARKET OPPORTUNITIES AND FUTURE OUTLOOK
- 7.1 White-space and Unmet-need Assessment


