


 |
市场调查报告书
商品编码
1850069
自适应安全:市场份额分析、行业趋势、统计数据和成长预测(2025-2030 年)Adaptive Security - Market Share Analysis, Industry Trends & Statistics, Growth Forecasts (2025 - 2030) |
||||||
※ 本网页内容可能与最新版本有所差异。详细情况请与我们联繫。
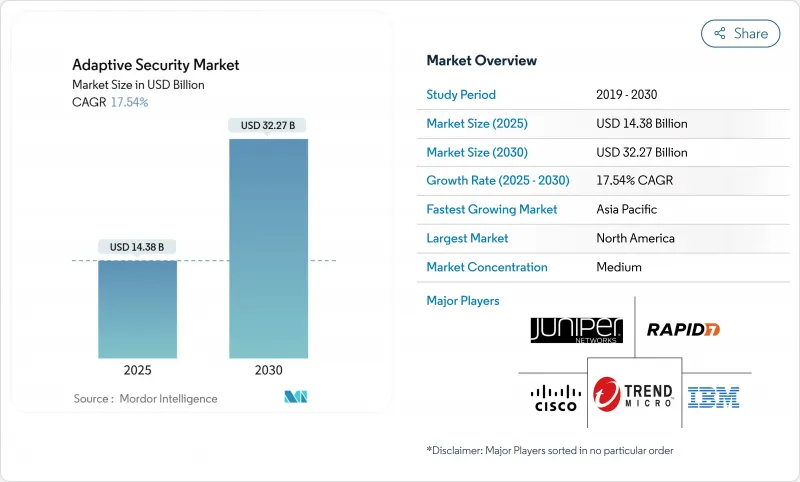
自适应安全市场预计在 2025 年达到 143.8 亿美元,到 2030 年将达到 322.7 亿美元,复合年增长率高达 17.54%。
这种扩展反映了从以边界为中心的防御体係向即时分析使用者行为、资产环境和威胁情报的自学习架构的快速转变。政府的零信任要求、日益加重的监管处罚以及人工智慧攻击流量的空前成长,迫使企业放弃静态控制,并采取持续调整的安全措施。供应商正在将大规模语言模型推理、自动化策略编配和行为分析整合到整合平台中,以加快平均检测和回应时间,同时降低管理开销。由于董事会层级对品牌损害和勒索软体支付的担忧通常超过主动控制的成本,组织对此类架构的需求正在增长。
全球自适应安全市场趋势与洞察
人工智慧产生的攻击流量优于基于规则的防御
借助人工智慧,攻击者可以自动化网路钓鱼、漏洞发现和横向移动,产生能够规避基于签名的工具的流量模式。 CrowdStrike 将于 2025 年推出基于代理的人工智慧模组,以在端点和云端工作负载中自主搜寻和遏制前所未见的恶意软体。 Darktrace 的自主回应引擎已在中途拦截可疑会话,例如在 2025 年缓解 ClickFix 网路钓鱼浪潮。 Darktrace 的自主回应引擎已在中途拦截可疑会话,例如在 2025 年缓解 ClickFix 网路钓鱼浪潮。
监管要求推动合规主导的安全投资
欧盟的NIS2和DORA法规于2025年生效,规定对网路控制不力的行为处以最高1000万欧元或相当于全球收入2%的罚款,并要求银行、公用事业和数位服务供应商实施持续监控和最低权限。美国联邦机构在第14028号行政命令下也面临类似的压力,CISA的零信任成熟度模型详细列出了截至2027财年的阶段性目标。美国国防部也对此进行了补充,要求所有网路在2027年前必须采用零信任框架。这些规定产生了乘数效应,推动了自适应安全市场的发展,因为企业正在寻求能够透过单一控制措施满足多项法规要求的整合平台。
网路安全人才短缺
根据Varonis的《2025年劳动力概况》,美国约有60万网路安全负责人失业,而经验丰富的负责人的失业率为零。亚洲的小型企业和中小企业面临的困境最为严峻,日本的《2024年小型企业调查》指出,人才短缺是网路回应的最大障碍。这一人才缺口正在推动託管侦测和回应服务的发展,预计自适应安全市场服务领域的复合年增长率将达到17.8%。 Fortinet透过将GenAI策略手册整合到FortiAnalyzer 2025中,解决了技能短缺的问题,使精干团队能够对先前需要高级分析师才能处理的警报进行分类。
細項分析
到 2024 年,应用程式安全的自适应安全市场预计将达到 52.3 亿美元,占总收益的 36.4%,这得益于 API 滥用的增加。根据 Akamai 的《2025 年应用程式和 API》报告,API 占所有观察到的流量的 57%,并且日益被武器化。因此,企业正在部署执行时间检查、模式检验和行为基准测试,以阻止绕过外围网关的注入攻击。同时,随着零信任策略引擎直接内建到容器编排器和无伺服器执行时间中,为 DevOps 团队提供原生保护,云端安全正以 18.1% 的复合年增长率发展。 Syncloop 等供应商透过在 Kubernetes 丛集上提供无监督异常检测来减少误报和 SOC 疲劳。网路和端点控制仍然至关重要,但正在整合到平台捆绑包中,使买家能够简化遥测管道并自动执行杀伤链中断。
到2024年,解决方案将占总收入的62.6%,而将检测、回应和合规报告外包给专家将进一步扩大自适应安全服务市场规模。技能短缺和全天候服务的需求,甚至促使财富500强企业也转向託管编配。 Ciena对一家光纤网路客户的案例研究展示了服务供应商如何将人工智慧主导的威胁分析打包到连接交易中,从而降低工业客户的资本支出和技能负担。服务供应商正在利用多租户SIEM和AIOps来降低单位客户成本并提高毛利率,从而强化了技术买家更重视结果而非工具所有权的循环。
自适应安全市场按应用(应用安全、网路安全等)、产品(解决方案和服务)、部署模式(本地和云端)、最终用户(金融服务、保险和保险业、政府、国防等)和地区细分。市场预测以美元计算。
区域分析
北美32.8%的份额由早期零信任试点计画、雄厚的创业投资资金以及联邦政府支出推动。 14028号行政命令和CISA指南要求联邦机构持续进行身分验证,这促使供应链中的私部门纷纷跟进。微软为迁移到Security Copilot的政府机构提供了规范的蓝图,加速了最佳实践在全部区域。当地人才库和发达的网路保险市场也支撑了高保额产品的高价。
亚太地区将实现最快的成长速度,到2030年复合年增长率将达到19.3%。日本网路安全战略委员会已累计1.2兆日圆用于公私合作研发项目,以培育整合后量子密码技术和威胁资讯共用的国内供应商。新加坡的「智慧国家」计画正在投资人工智慧系统控制中心(SOC)自动化,而跨国製造商正在将工厂迁往东南亚,并要求针对智慧工厂量身定制的安全措施。中国将在人工智慧安全专利领域占据主导地位,到2023年将占全球申请量的70%,促使周边国家加快区域创新和跨境威胁共用协议的达成。
在监管加强的推动下,欧洲实现了强劲成长。 《国家资讯安全法2》(NIS2)强制能源、水务和运输业者检验其供应链的稳健性,而《资料保护条例》(DORA)则将类似的规则扩展到金融机构。 ENISA 2025年的调查发现,政策采用率为86%,但预算分配仅为47%,这显示对承包託管服务的需求正在增加。即将出台的《网路弹性法案》将扩大其范围,涵盖所有数位产品,这将激发消费性电子产品製造商的新采购活动。
其他福利:
- Excel 格式的市场预测 (ME) 表
- 3个月的分析师支持
目录
第一章 引言
- 研究假设和市场定义
- 调查范围
第二章调查方法
第三章执行摘要
第四章 市场状况
- 市场概况
- 市场驱动因素
- 网路攻击的数量和复杂程度正在增加
- 监理义务(GDPR、CCPA、DORA、NIS2 等)
- 企业云端和 SaaS 扩充功能需要零信任控制
- 人工智慧产生的攻击流量优于基于规则的防御
- 机器对机器身份的扩散需要持续的风险评分
- 5G网路切片推动微分段的采用
- 市场限制
- 网路安全人才短缺
- 棕地IT 资产的高 TCO 和复杂的集成
- 具有专有通讯协定的传统 OT/ICS 环境
- 多重云端部署中的资料主权衝突
- 供应链分析
- 监管格局
- 技术展望(AI、UEBA、SSE、微分段、PQC)
- 波特五力分析
- 供应商的议价能力
- 买方的议价能力
- 新进入者的威胁
- 替代品的威胁
- 竞争对手之间的竞争
- 宏观经济趋势的市场评估
第五章市场规模及成长预测
- 按用途
- 应用程式安全
- 网路安全
- 端点安全
- 云端安全
- 其他的
- 按报价
- 解决方案
- 服务
- 按部署模型
- 本地部署
- 云端基础
- 按最终用户
- BFSI
- 政府和国防
- 製造业(工业4.0)
- 医疗保健和生命科学
- 能源和公共产业
- 其他的
- 按地区
- 北美洲
- 美国
- 加拿大
- 墨西哥
- 南美洲
- 巴西
- 阿根廷
- 南美洲其他地区
- 欧洲
- 英国
- 德国
- 法国
- 瑞典
- 其他欧洲地区
- 亚太地区
- 中国
- 日本
- 印度
- 澳洲
- 韩国
- 其他亚太地区
- 中东和非洲
- 沙乌地阿拉伯
- 阿拉伯聯合大公国
- 土耳其
- 南非
- 其他中东和非洲地区
- 北美洲
第六章 竞争态势
- 市场集中度
- 策略性倡议(MandA、资金筹措、产品发布)
- 市占率分析
- 公司简介
- Cisco Systems
- IBM Corp.
- Fortinet
- Palo Alto Networks
- Trend Micro
- Rapid7
- Check Point Software
- Juniper Networks
- Trellix
- CrowdStrike
- Zscaler
- Illumio
- Lumen Technologies
- Aruba(HPE)
- Microsoft Security
- Okta
- Netskope
- Darktrace
- Akamai/Guardicore
- WatchGuard(Panda)
第七章 市场机会与未来展望
The adaptive security market is valued at USD 14.38 billion in 2025 and is forecast to reach USD 32.27 billion by 2030, advancing at a robust 17.54% CAGR.
This expansion mirrors the rapid shift from perimeter-centric defenses to self-learning architectures that analyze user behavior, asset context, and threat intelligence in real time. Government zero-trust mandates, sharper regulatory penalties, and an unprecedented rise in AI-driven attack traffic are forcing enterprises to retire static controls and adopt continuously tuned safeguards. Vendors are embedding large-language-model reasoning, automated policy orchestration, and behavior analytics into unified platforms, reducing mean time to detect and respond while lowering administrative overhead. Organic demand is amplified by mounting board-level concern over brand damage and ransomware payouts that routinely exceed the cost of proactive controls.
Global Adaptive Security Market Trends and Insights
AI-Generated Attack Traffic Outpacing Rule-Based Defenses
AI-enabled adversaries now automate phishing, vulnerability discovery, and lateral movement, generating traffic patterns that evade signature-based tools. CrowdStrike launched agentic AI modules in 2025 that autonomously hunt and contain never-seen malware across endpoints and cloud workloads.Darktrace's autonomous response engine already blocks suspicious sessions mid-stream, such as its 2025 mitigation of ClickFix phishing waves. These proof points illustrate how real-time behavior models supersede static rule sets, cementing demand for adaptive security market solutions that refine policies without human tuning.
Regulatory Mandates Driving Compliance-Driven Security Investments
The EU NIS2 and DORA regulations that took effect in 2025 impose fines up to EUR 10 million or 2% of global turnover for inadequate cyber controls, forcing banks, utilities, and digital service providers to implement continuous monitoring and least-privilege access. U.S. federal agencies face identical pressure under Executive Order 14028, with CISA's Zero-Trust Maturity Model detailing phased milestones through fiscal 2027.The U.S. Department of Defense complements this with a mandatory zero-trust framework for all networks by 2027. Together, these mandates create a multiplier effect that boosts the adaptive security market as firms seek unified platforms capable of mapping a single control to multiple regulations.
Shortage of Skilled Cybersecurity Talent
There are nearly 600,000 unfilled U.S. cybersecurity roles, and experienced practitioners enjoy zero percent unemployment, according to Varonis' 2025 labor snapshot. Small firms and Asian SMEs struggle most, with Japan's 2024 SME survey showing staff shortages as the top cyber-readiness barrier. This gap encourages managed detection and response services and fuels the 17.8% CAGR forecast for the Services segment within the adaptive security market. Fortinet answered the skills crunch by embedding GenAI playbooks into FortiAnalyzer 2025, enabling lean teams to triage alerts that formerly required senior analysts.
Other drivers and restraints analyzed in the detailed report include:
- Enterprise Cloud and SaaS Sprawl Necessitating Zero-Trust Controls
- Surge in Machine-to-Machine Identities Requiring Continuous Risk Scoring
- High TCO and Integration Complexity for Brownfield IT Estates
For complete list of drivers and restraints, kindly check the Table Of Contents.
Segment Analysis
Adaptive security market size for Application Security stood at USD 5.23 billion in 2024 and preserved a 36.4% slice of revenue owing to heightened API exploitation. Akamai's 2025 Apps and API report revealed that APIs account for 57% of all observed traffic and are increasingly weaponized. Enterprises therefore deploy runtime inspection, schema validation, and behavior baselining to block injection attacks that bypass perimeter gateways. Cloud Security, meanwhile, advances at an 18.1% CAGR as zero-trust policy engines embed directly into container orchestrators and serverless runtimes, giving DevOps teams native safeguards. Vendors such as Syncloop layer unsupervised anomaly detection over Kubernetes clusters, reducing false positives and easing SOC fatigue. Network and endpoint controls remain essential but converge into platform bundles so buyers can streamline telemetry pipelines and automate kill-chain disruption.
Despite Solutions retaining 62.6% of 2024 sales, the adaptive security market size for Services will grow faster as boards outsource detection, response, and compliance reporting to experts. Skills shortages and 24X7 coverage needs push even Fortune 500 firms toward managed orchestration. Ciena's case study on optical network customers shows service providers packaging AI-driven threat analytics into connectivity deals, offloading capex and skill burdens for industrial clients. Service providers leverage multitenant SIEMs and AIOps to reduce per-customer cost and expand gross margin, reinforcing a cycle where technology buyers prefer outcomes over tool ownership.
Adaptive Security Market is Segmented by Application (Application Security, Network Security, and More), Offering (Solutions and Services), Deployment Model (On-Premises and Cloud-Based), End User (BFSI, Government and Defense, and More), and by Geography. The Market Forecasts are Provided in Terms of Value (USD).
Geography Analysis
North America's 32.8% share stems from early zero-trust pilots, venture funding depth, and federal spending. Executive Order 14028 and CISA guidance obligate federal agencies to deploy continuous authentication, spurring private-sector imitation in supply chains. Microsoft provides prescriptive blueprints for agencies migrating to Security Copilot, accelerating best-practice diffusion across the region. Local talent pools and a well-developed cyber-insurance market also sustain premium pricing for high-assurance products.
Asia-Pacific is set for the fastest climb at a 19.3% CAGR through 2030. Japan's Cybersecurity Strategy Council earmarked JPY 1.2 trillion for public-private R&D programs, fostering domestic vendors that integrate post-quantum cryptography and threat-intel sharing. Singapore's Smart Nation blueprint injects funding for AI SOC automation, while multinational manufacturers relocate facilities to Southeast Asia and demand adaptive safeguards for smart factories. China's dominance in AI security patents, accounting for 70% of 2023 global filings, puts pressure on neighbors to accelerate local innovation and cross-border threat-sharing pacts.
Europe records solid growth on the back of regulatory heft. NIS2 forces energy, water, and transport operators to verify supply-chain hardening, while DORA extends similar rules to financial entities. ENISA's 2025 survey showed 86% policy adoption but only 47% budget allocation, implying pent-up demand for turnkey managed services. The upcoming Cyber Resilience Act broadens coverage to all digital products, fueling fresh procurements among consumer-electronics manufacturers.
- Cisco Systems
- IBM Corp.
- Fortinet
- Palo Alto Networks
- Trend Micro
- Rapid7
- Check Point Software
- Juniper Networks
- Trellix
- CrowdStrike
- Zscaler
- Illumio
- Lumen Technologies
- Aruba (HPE)
- Microsoft Security
- Okta
- Netskope
- Darktrace
- Akamai / Guardicore
- WatchGuard (Panda)
Additional Benefits:
- The market estimate (ME) sheet in Excel format
- 3 months of analyst support
TABLE OF CONTENTS
1 INTRODUCTION
- 1.1 Study Assumptions and Market Definition
- 1.2 Scope of the Study
2 RESEARCH METHODOLOGY
3 EXECUTIVE SUMMARY
4 MARKET LANDSCAPE
- 4.1 Market Overview
- 4.2 Market Drivers
- 4.2.1 Escalating volume and sophistication of cyber-attacks
- 4.2.2 Regulatory mandates (GDPR, CCPA, DORA, NIS2, etc.)
- 4.2.3 Enterprise cloud and SaaS sprawl needing zero-trust controls
- 4.2.4 AI-generated attack traffic outpacing rule-based defenses
- 4.2.5 Surge in machine-to-machine identities requiring continuous risk scoring
- 4.2.6 5G network-slicing driving micro-segmentation adoption
- 4.3 Market Restraints
- 4.3.1 Shortage of skilled cyber-security talent
- 4.3.2 High TCO and integration complexity for brown-field IT estates
- 4.3.3 Legacy OT/ICS environments with proprietary protocols
- 4.3.4 Data-sovereignty conflicts in multi-cloud deployments
- 4.4 Supply-Chain Analysis
- 4.5 Regulatory Landscape
- 4.6 Technological Outlook (AI, UEBA, SSE, micro-segmentation, PQC)
- 4.7 Porter's Five Force Analysis
- 4.7.1 Bargaining Power of Suppliers
- 4.7.2 Bargaining Power of Buyers
- 4.7.3 Threat of New Entrants
- 4.7.4 Threat of Substitutes
- 4.7.5 Competitive Rivalry
- 4.8 Assesment of Macroeconomic Trends on the Market
5 MARKET SIZE AND GROWTH FORECASTS (VALUE)
- 5.1 By Application
- 5.1.1 Application Security
- 5.1.2 Network Security
- 5.1.3 Endpoint Security
- 5.1.4 Cloud Security
- 5.1.5 Others
- 5.2 By Offering
- 5.2.1 Solutions
- 5.2.2 Services
- 5.3 By Deployment Model
- 5.3.1 On-premise
- 5.3.2 Cloud-based
- 5.4 By End User
- 5.4.1 BFSI
- 5.4.2 Government and Defense
- 5.4.3 Manufacturing (Industry 4.0)
- 5.4.4 Healthcare and Life Sciences
- 5.4.5 Energy and Utilities
- 5.4.6 Others
- 5.5 By Geography
- 5.5.1 North America
- 5.5.1.1 United States
- 5.5.1.2 Canada
- 5.5.1.3 Mexico
- 5.5.2 South America
- 5.5.2.1 Brazil
- 5.5.2.2 Argentina
- 5.5.2.3 Rest of South America
- 5.5.3 Europe
- 5.5.3.1 United Kingdom
- 5.5.3.2 Germany
- 5.5.3.3 France
- 5.5.3.4 Sweden
- 5.5.3.5 Rest of Europe
- 5.5.4 Asia-Pacific
- 5.5.4.1 China
- 5.5.4.2 Japan
- 5.5.4.3 India
- 5.5.4.4 Australia
- 5.5.4.5 South Korea
- 5.5.4.6 Rest of Asia-Pacific
- 5.5.5 Middle East and Africa
- 5.5.5.1 Saudi Arabia
- 5.5.5.2 United Arab Emirates
- 5.5.5.3 Turkey
- 5.5.5.4 South Africa
- 5.5.5.5 Rest of Middle East and Africa
- 5.5.1 North America
6 COMPETITIVE LANDSCAPE
- 6.1 Market Concentration
- 6.2 Strategic Moves (MandA, funding, product launches)
- 6.3 Market Share Analysis
- 6.4 Company Profiles (includes Global level Overview, Market level overview, Core Segments, Financials as available, Strategic Information, Market Rank/Share, Products and Services, Recent Developments)
- 6.4.1 Cisco Systems
- 6.4.2 IBM Corp.
- 6.4.3 Fortinet
- 6.4.4 Palo Alto Networks
- 6.4.5 Trend Micro
- 6.4.6 Rapid7
- 6.4.7 Check Point Software
- 6.4.8 Juniper Networks
- 6.4.9 Trellix
- 6.4.10 CrowdStrike
- 6.4.11 Zscaler
- 6.4.12 Illumio
- 6.4.13 Lumen Technologies
- 6.4.14 Aruba (HPE)
- 6.4.15 Microsoft Security
- 6.4.16 Okta
- 6.4.17 Netskope
- 6.4.18 Darktrace
- 6.4.19 Akamai / Guardicore
- 6.4.20 WatchGuard (Panda)
7 MARKET OPPORTUNITIES AND FUTURE OUTLOOK
- 7.1 White-space and Unmet-need Assessment


