


 |
市场调查报告书
商品编码
1850084
公用事业和能源分析:市场份额分析、行业趋势、统计数据和成长预测(2025-2030 年)Utility And Energy Analytics - Market Share Analysis, Industry Trends & Statistics, Growth Forecasts (2025 - 2030) |
||||||
※ 本网页内容可能与最新版本有所差异。详细情况请与我们联繫。
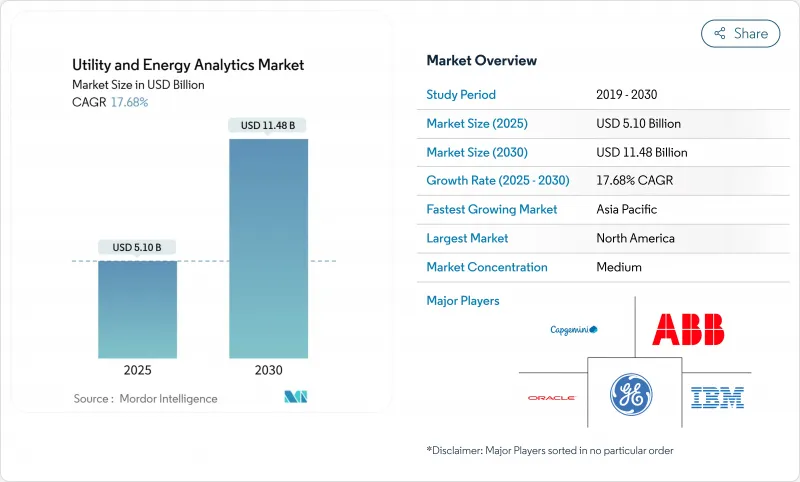
预计到 2025 年,公用事业和能源分析市场规模将达到 51 亿美元,到 2030 年将达到 114.8 亿美元,复合年增长率为 17.68%。
成长的驱动力来自不断提高的电气化率、更严格的脱碳目标以及优化日益复杂的电网的需求。同时,电力负载预计将成长五倍,从2025年的23吉瓦增加到2030年的128吉瓦,迫使电力公司对其数据基础设施和决策流程进行现代化改造。批发价格波动加剧、智慧电錶普及速度加快以及云端运算应用日益广泛,进一步扩大了先进解决方案的应用范围。随着传统操作技术供应商透过收购和合作扩展其分析产品组合,以及超大规模云端公司向电力公司提供产业专用的人工智慧服务,竞争日益激烈。
全球公用事业和能源分析市场趋势与洞察
可再生能源强制规定和脱碳支出
全球为减少碳排放所做的努力正在加速对先进预测和优化工具的投资。预计到2025年初,可再生能源将占全球电力供应的三分之一,这将为电网带来前所未有的波动性。美国能源局估计,到2030年,如果电力公司能够即时协调分散式资源,密集型虚拟电厂可以满足10%至20%的尖峰需求。这些发展趋势迫使营运商采用能够处理高频遥测数据、模拟天气驱动的发电量波动并优化日前和日内市场竞标策略的分析平台。
部署 AMI 2.0 并采用边缘分析
新一代智慧电錶计划能够产生连续的资料流,其效能远超传统处理工具。预计全球智慧电錶收入将从2024年的266.5亿美元成长到2025年的292.9亿美元,产生精细的时间间隔数据,供公用事业公司在边缘进行分析。透过将分析功能嵌入电錶,泰晤士水务公司的管网每天已检测到超过8万处漏水,避免了5,700万公升水的损失。本地运行演算法可最大限度地减少延迟,降低回程传输频宽,并使配电运营商能够快速触发电压和压力调节,从而在降低成本的同时提高电网弹性。
传统OT-IT整合成本与资料孤岛
许多公用事业公司仍在运作几十年前的SCADA、停电和收费系统,这些系统当初设计时并未考虑连网互通。将这些系统与云端网关和现代资料湖集成,通常会使初始分析预算翻倍甚至三倍,并延误计划进度。透过标准化资料模型、部署API闸道和滚动升级,具有前瞻性的公用事业公司在控製成本的同时,也为未来分析层的开放式架构奠定了基础。
细分市场分析
预计2025年,云端平台将贡献41%的支出成长,而由于严格的合规要求,本地部署模式仍维持59%的市场占有率。然而,弹性运算、託管人工智慧服务和计量收费模式正在改变成本效益格局。受待开发区AMI、需量反应和DERMS部署(这些部署需要水平可扩展架构)的推动,预计到2030年,云端部署的公用事业和能源分析市场规模将以24.10%的复合年增长率成长。 IBM的软体即服务(SaaS)套件表明,供应商越来越重视采用电网特定模板的强化型、可审核环境。混合策略十分普遍,敏感的营运资料集保留在资料中心,而预测管道和麵向客户的仪表板则在云端运作。
除了韧性之外,公用事业公司也十分欣赏云端运算快速的创新週期。诸如地理空间视觉化、情境调度模拟器和客户自助服务入口网站等新功能无需耗时的硬体更新即可部署。服务提供者正在发布针对公共产业的合规蓝图,以帮助风险管理人员获得董事会核准。随着信心的增强,输电业者正在试行云端原生历史资料替换方案,目标是在五年内将整体拥有成本降低 50%。
2024年,软体授权收入仍将占总收入的69%,这反映出企业对供应商提供的计量资料管理、停电分析和预测工具的高度依赖。然而,服务收入正以20.80%的复合年增长率加速成长,显示公用事业公司需要整合支援、数据品质改进和持续的模型调优。现场经验表明,在多年部署专案中,专业服务支出可能与软体支出相当,尤其是在需要为传统监控和资料撷取平台配备中间件适配器的情况下。 Cognizant 2024年第四季营收年增6.8%,部分原因是公用事业分析需求的成长,凸显了企业向增值合约模式的转变。
随着电力公司部署变电站相位测量单元和馈线级感测器,边缘硬体的部署也不断增加。这些设备预处理大量波形,并将基于事件的摘要传输到中央储存库。边缘运算能够实现近乎瞬时的故障定位和电压调节器,从而延长设备寿命并提高电能品质。
公用事业和能源分析市场配置(本地部署、云端部署、混合部署)、组件(软体、服务、其他)、应用(计量操作和资料管理、负载和发电预测、其他)、最终用户(发电企业、输配电运营商、其他)、公用事业类型(电力、天然气、其他)以及地区进行细分。市场预测以美元计价。
区域分析
北美地区在2024年将维持38%的收入份额,这得益于成熟的数位基础设施、超过70%的AMI普及率以及鼓励基于绩效定价的法律规范。各州的电力系统韧性计画正将资金投入停电分析、植被侵蚀建模和野火风险评分等领域。德克萨斯州的需求成长就是一个例证,其灵活负载消费量在2025年将达到540亿度,迫使电力公司提高负载预测的准确性并增强电网自动化。随着公用事业公司利用弹性运算来处理高频电錶读数和变电站波形,云端采用率的成长速度超过了本地部署的成长速度。
亚太地区是成长最快的地区,2025年至2030年的复合年增长率将达到21.30%。中国太阳能光电和储能技术的快速普及以及印度农村电气化计划的推进,带来了大规模的数据挑战,而分析技术可以有效应对这些挑战。日本和澳洲的现有企业专注于客户参与和编配能源(DER)协调,而新兴市场则直接跨越传统调度系统,从一开始就采用智慧电网技术。政府支持的智慧城市计划透过添加交通、环境感测器和微电网等数据流,并将其与公用事业数据集融合,正在扩大分析平台的覆盖范围。
在欧洲,雄心勃勃的脱碳目标持续推动公用事业公司投入巨资,以优化可变可再生能源和电气化需求(包括热泵和电动车)的整合。严格的网路安全法规和GDPR合规性正在推动资料主权要求,并促使架构选择转向区域云区和本地化资料湖。欧盟委员会推动跨境市场耦合,刺激了对分析技术的需求,以协调成员国之间的调度、拥塞管理和能源不平衡结算。北欧营运商正在展示先进的灵活性市场,其中配电级容量近乎即时地进行交易,这需要高解析度远端检测和基于人工智慧的调度引擎。
其他福利:
- Excel格式的市场预测(ME)表
- 3个月的分析师支持
目录
第一章 引言
- 研究假设和市场定义
- 调查范围
第二章调查方法
第三章执行摘要
第四章 市场情势
- 市场概览
- 市场驱动因素
- 可再生能源强制规定和脱碳支出
- 部署 AMI 2.0 并采用边缘分析
- 批发价格波动会影响负载预测的准确性。
- 云端原生实用分析框架
- 欧盟/美国网路安全弹性合规要求
- 市场限制
- 传统OT-IT整合成本与资料孤岛
- 电力产业资料科学人才短缺
- 网路安全和资料主权问题
- 仔细审查限制数位预算的定价案例
- 价值/供应链分析
- 监管环境
- 技术展望
- 波特五力分析
- 供应商的议价能力
- 买方的议价能力
- 新进入者的威胁
- 替代品的威胁
- 竞争对手之间的竞争
第五章 市场规模与成长预测
- 透过部署
- 本地部署
- 云
- 杂交种
- 按组件
- 软体
- 服务
- 硬体/边缘设备
- 透过使用
- 计量运作和资料管理
- 负载和发电预测
- 需量反应和灵活性
- 配送规划与优化
- 资产绩效管理
- 故障管理和可靠性
- 按公用事业类型
- 电
- 气体
- 水
- 多功能的
- 最终用户
- 发电设施
- 输配电公司
- 零售能源供应商
- 独立电力生产商
- 按地区
- 北美洲
- 美国
- 加拿大
- 墨西哥
- 南美洲
- 巴西
- 阿根廷
- 其他南美洲
- 欧洲
- 英国
- 德国
- 法国
- 义大利
- 西班牙
- 北欧国家
- 俄罗斯
- 其他欧洲地区
- 亚太地区
- 中国
- 日本
- 印度
- 韩国
- 澳洲和纽西兰
- ASEAN
- 亚太其他地区
- 中东和非洲
- 中东
- 沙乌地阿拉伯
- 阿拉伯聯合大公国
- 以色列
- 土耳其
- 其他中东地区
- 非洲
- 南非
- 埃及
- 奈及利亚
- 其他非洲地区
- 北美洲
第六章 竞争情势
- 市场集中度
- 策略性措施与资金筹措
- 市占率分析
- 公司简介
- Oracle Corporation
- IBM Corporation
- Siemens AG
- Schneider Electric SE
- ABB Ltd
- General Electric Company
- SAS Institute Inc.
- SAP SE
- Capgemini SE
- Teradata Corporation
- Hitachi Energy Ltd.
- Landis+Gyr AG
- Itron Inc.
- AutoGrid Systems Inc.
- Wipro Ltd.
- Accenture plc
- Amazon Web Services(AWS)Utilities
- Microsoft Azure Energy
- Enel X
- Nexant Inc.
- OSIsoft(AVEVA)
- Uptake Technologies
- Bidgely Inc.
- Smarter Grid Solutions
第七章 市场机会与未来展望
The utility and energy analytics market size stands at USD 5.1 billion in 2025 and is forecast to reach USD 11.48 billion by 2030, registering a 17.68% CAGR.
Growth is fuelled by rising electrification, sharper decarbonisation targets and the need to optimise increasingly complex grids. More than 55% of utilities now apply near-real-time analytics to monitor grid assets and customer usage, while a projected five-fold jump in electricity load-from 23 GW in 2025 to 128 GW in 2030-keeps pressure on operators to modernise data infrastructure and decision-making processes. Intensifying wholesale-price volatility accelerated smart-meter rollouts and widening cloud adoption further widen the addressable space for advanced solutions. Competitive intensity is rising as hyperscale cloud firms court utilities with industry-specific AI services, even as traditional operational-technology vendors deepen their analytics portfolios through acquisitions and partnerships.
Global Utility And Energy Analytics Market Trends and Insights
Mandatory Renewable Mandates & Decarbonisation Spend
Global commitments to cut carbon emissions are accelerating investment in sophisticated forecasting and optimisation tools. Renewables are projected to generate one-third of global electricity by early 2025, placing unprecedented variability on grids. Government incentives amplify the trend; the U.S. Department of Energy estimates that aggregated virtual power plants could supply 10-20% of peak demand by 2030, provided utilities can orchestrate distributed resources in real time. These developments compel operators to deploy analytics platforms capable of processing high-frequency telemetry, modelling weather-driven output swings and optimising bid strategies across day-ahead and intra-day markets.
AMI 2.0 Roll-out & Edge Analytics Adoption
Next-generation smart-meter projects create continuous data streams that outstrip legacy processing tools. Global smart-meter revenues are projected to climb from USD 26.65 billion in 2024 to USD 29.29 billion in 2025, producing granular interval data that utilities can analyse at the edge. Thames Water's network already detects more than 80,000 leaks daily and avoids 57 million litres of water losses by embedding analytics inside meters. Running algorithms locally minimises latency, reduces back-haul bandwidth and enables distribution operators to trigger rapid voltage or pressure adjustments, reinforcing grid resilience while containing costs.
Legacy OT-IT Integration Costs & Data Silos
Many utilities still run decades-old SCADA, outage and billing systems that were never designed to interconnect. Integrating these assets with cloud gateways and modern data-lakes often doubles or triples the original analytics budget, delaying project timelines. Forward-thinking operators are standardising data models, deploying API gateways and sequencing upgrades to contain spend while laying an open architecture foundation for future analytics layers.
Other drivers and restraints analyzed in the detailed report include:
- Wholesale-Price Volatility Driving Load-Forecast Accuracy
- Cloud-Native Utility-Analytics Frameworks
- Data-Science Talent Shortage in Power Domain
For complete list of drivers and restraints, kindly check the Table Of Contents.
Segment Analysis
Cloud platforms captured 41% of incremental spend in 2025, yet the on-premises model retained 59% utility and energy analytics market share due to strict compliance requirements. Operators historically kept mission-critical apps within firewalls; however, elastic compute, managed AI services and pay-as-you-go economics are shifting cost-benefit equations. The utility and energy analytics market size for cloud deployments is expected to grow at 24.10% CAGR to 2030, driven by greenfield AMI, demand-response and DERMS rollouts that need horizontally scalable architectures. IBM's sector-focused Software-as-a-Service suite illustrates rising vendor emphasis on hardened, audit-ready environments with grid-specific templates. Hybrid strategies are common: sensitive operational datasets remain in data centres while prediction pipelines and customer-facing dashboards run in the cloud, allowing utilities to stage migration while mitigating sovereignty concerns.
Alongside resilience, utilities value the cloud's rapid innovation cycle. New features-geospatial visualisation, what-if dispatch simulators or customer self-service portals-can be deployed without lengthy hardware refreshes. Providers publish utilities-specific compliance roadmaps, helping risk officers secure board approvals. As confidence rises, transmission operators are piloting cloud-native historian replacements, targeting 50% lower total cost of ownership over a five-year horizon.
Software licences still accounted for 69% of 2024 revenues, reflecting entrenched reliance on vendor-supplied meter-data management, outage analytics and forecasting tools. Yet services revenue is accelerating at 20.80% CAGR, signalling utilities' need for integration support, data-quality remediation and continuous model tuning. Field evidence shows professional-services outlays can equal software spend during multiyear deployments, especially where legacy supervisory control and data acquisition platforms require middleware adaptors. Cognizant's 6.8% year-over-year revenue uptick in Q4 2024, partly propelled by utility analytics mandates, underlines the shift toward value-added engagements.
Edge-hardware uptake is also climbing as utilities deploy substation phasor-measurement units and feeder-level sensors. These devices preprocess high-volume waveforms, forwarding only event-based summaries to central repositories. Edge enables near-instant fault localisation and voltage-control actions, extending equipment life and improving power quality.
Utility and Energy Analytics Market Segmented by Deployment (On-Premises, Cloud and Hybrid), Component (Software, Services and More), Application (Meter Operations and Data Management, Load and Generation Forecasting and More), End-User (Generation Utilities, Transmission and Distribution Operators and More) Utility Type (Electric, Gas and More), and Geography. The Market Forecasts are Provided in Terms of Value (USD).
Geography Analysis
North America retained a 38% revenue share in 2024, backed by mature digital infrastructure, AMI penetration above 70% and supportive regulatory constructs that reward performance-based ratemaking. State-level resilience programmes channel funds toward outage analytics, vegetation-encroachment modelling and wildfire-risk scoring. Texas exemplifies demand growth, with flexible-load consumption set to reach 54 billion kWh in 2025, forcing utilities to refine load-forecast accuracy and bolster grid automation. Cloud deployments outpace on-premises adds as utilities capitalise on elastic compute to process high-frequency meter reads and substation waveforms.
Asia-Pacific represents the fastest expanding pocket with a 21.30% CAGR for 2025-2030. China's rapid solar and storage build-out and India's rural electrification projects create large-scale data challenges that analytics can unlock. Established players in Japan and Australia emphasise customer engagement and DER orchestration, whereas emerging economies leapfrog legacy dispatch systems, installing smart-grid technologies from the outset. Government-backed smart-city initiatives pile on additional data streams-traffic, environmental sensors and microgrids-that converge with utility datasets, increasing analytics platform scope.
Europe sustains significant spend as ambitious decarbonisation obligations drive utilities to optimise variable renewable integration and electrified demand such as heat pumps and EVs. Tight cyber-security rules and GDPR compliance elevate data-sovereignty requirements, shaping architecture choices toward regional cloud zones and localised data-lakes. The European Commission's push for cross-border market coupling stimulates demand for analytics that align scheduling, congestion management and energy imbalance settlements across member states. Nordic operators showcase advanced flexibility markets where distribution-level capacity trades in near-real time, necessitating high-resolution telemetry and AI-based dispatch engines.
- Oracle Corporation
- IBM Corporation
- Siemens AG
- Schneider Electric SE
- ABB Ltd
- General Electric Company
- SAS Institute Inc.
- SAP SE
- Capgemini SE
- Teradata Corporation
- Hitachi Energy Ltd.
- Landis+Gyr AG
- Itron Inc.
- AutoGrid Systems Inc.
- Wipro Ltd.
- Accenture plc
- Amazon Web Services (AWS) Utilities
- Microsoft Azure Energy
- Enel X
- Nexant Inc.
- OSIsoft (AVEVA)
- Uptake Technologies
- Bidgely Inc.
- Smarter Grid Solutions
Additional Benefits:
- The market estimate (ME) sheet in Excel format
- 3 months of analyst support
TABLE OF CONTENTS
1 INTRODUCTION
- 1.1 Study Assumptions and Market Definition
- 1.2 Scope of the Study
2 RESEARCH METHODOLOGY
3 EXECUTIVE SUMMARY
4 MARKET LANDSCAPE
- 4.1 Market Overview
- 4.2 Market Drivers
- 4.2.1 Mandatory renewable mandates and decarbonisation spend
- 4.2.2 AMI 2.0 roll-out and edge analytics adoption
- 4.2.3 Wholesale-price volatility driving load-forecast accuracy
- 4.2.4 Cloud-native utility-analytics frameworks
- 4.2.5 EU/US cyber-resilience compliance requirements
- 4.3 Market Restraints
- 4.3.1 Legacy OT-IT integration costs and data silos
- 4.3.2 Data-science talent shortage in power domain
- 4.3.3 Cyber-security and data-sovereignty concerns
- 4.3.4 Rate-case scrutiny limiting digital budgets
- 4.4 Value / Supply-Chain Analysis
- 4.5 Regulatory Landscape
- 4.6 Technological Outlook
- 4.7 Porter's Five Forces Analysis
- 4.7.1 Bargaining Power of Suppliers
- 4.7.2 Bargaining Power of Buyers
- 4.7.3 Threat of New Entrants
- 4.7.4 Threat of Substitute Products
- 4.7.5 Intensity of Competitive Rivalry
5 MARKET SIZE AND GROWTH FORECASTS (VALUE)
- 5.1 By Deployment
- 5.1.1 On-premise
- 5.1.2 Cloud
- 5.1.3 Hybrid
- 5.2 By Component
- 5.2.1 Software
- 5.2.2 Services
- 5.2.3 Hardware / Edge Devices
- 5.3 By Application
- 5.3.1 Meter Operations and Data Management
- 5.3.2 Load and Generation Forecasting
- 5.3.3 Demand Response and Flexibility
- 5.3.4 Distribution Planning and Optimisation
- 5.3.5 Asset Performance Management
- 5.3.6 Outage Management and Reliability
- 5.4 By Utility Type
- 5.4.1 Electric
- 5.4.2 Gas
- 5.4.3 Water
- 5.4.4 Multi-utility
- 5.5 By End-user
- 5.5.1 Generation Utilities
- 5.5.2 Transmission and Distribution Operators
- 5.5.3 Retail Energy Suppliers
- 5.5.4 Independent Power Producers
- 5.6 By Geography
- 5.6.1 North America
- 5.6.1.1 United States
- 5.6.1.2 Canada
- 5.6.1.3 Mexico
- 5.6.2 South America
- 5.6.2.1 Brazil
- 5.6.2.2 Argentina
- 5.6.2.3 Rest of South America
- 5.6.3 Europe
- 5.6.3.1 United Kingdom
- 5.6.3.2 Germany
- 5.6.3.3 France
- 5.6.3.4 Italy
- 5.6.3.5 Spain
- 5.6.3.6 Nordics
- 5.6.3.7 Russia
- 5.6.3.8 Rest of Europe
- 5.6.4 Asia-Pacific
- 5.6.4.1 China
- 5.6.4.2 Japan
- 5.6.4.3 India
- 5.6.4.4 South Korea
- 5.6.4.5 Australia and New Zealand
- 5.6.4.6 ASEAN
- 5.6.4.7 Rest of Asia-Pacific
- 5.6.5 Middle East and Africa
- 5.6.5.1 Middle East
- 5.6.5.1.1 Saudi Arabia
- 5.6.5.1.2 United Arab Emirates
- 5.6.5.1.3 Israel
- 5.6.5.1.4 Turkey
- 5.6.5.1.5 Rest of Middle East
- 5.6.5.2 Africa
- 5.6.5.2.1 South Africa
- 5.6.5.2.2 Egypt
- 5.6.5.2.3 Nigeria
- 5.6.5.2.4 Rest of Africa
- 5.6.1 North America
6 COMPETITIVE LANDSCAPE
- 6.1 Market Concentration
- 6.2 Strategic Moves and Funding
- 6.3 Market Share Analysis
- 6.4 Company Profiles (includes Global level Overview, Market level overview, Core Segments, Financials as available, Strategic Information, Market Rank/Share for key companies, Products and Services, and Recent Developments)
- 6.4.1 Oracle Corporation
- 6.4.2 IBM Corporation
- 6.4.3 Siemens AG
- 6.4.4 Schneider Electric SE
- 6.4.5 ABB Ltd
- 6.4.6 General Electric Company
- 6.4.7 SAS Institute Inc.
- 6.4.8 SAP SE
- 6.4.9 Capgemini SE
- 6.4.10 Teradata Corporation
- 6.4.11 Hitachi Energy Ltd.
- 6.4.12 Landis+Gyr AG
- 6.4.13 Itron Inc.
- 6.4.14 AutoGrid Systems Inc.
- 6.4.15 Wipro Ltd.
- 6.4.16 Accenture plc
- 6.4.17 Amazon Web Services (AWS) Utilities
- 6.4.18 Microsoft Azure Energy
- 6.4.19 Enel X
- 6.4.20 Nexant Inc.
- 6.4.21 OSIsoft (AVEVA)
- 6.4.22 Uptake Technologies
- 6.4.23 Bidgely Inc.
- 6.4.24 Smarter Grid Solutions
7 MARKET OPPORTUNITIES AND FUTURE OUTLOOK
- 7.1 White-space and Unmet-need Assessment
- 7.2 AI-driven predictive maintenance for DER-rich grids
- 7.3 Grid-edge analytics marketplaces
- 7.4 Green hydrogen and storage optimisation analytics


