


 |
市场调查报告书
商品编码
1850136
肥料添加剂:市场份额分析、行业趋势、统计数据和成长预测(2025-2030 年)Fertilizer Additives - Market Share Analysis, Industry Trends & Statistics, Growth Forecasts (2025 - 2030) |
||||||
※ 本网页内容可能与最新版本有所差异。详细情况请与我们联繫。
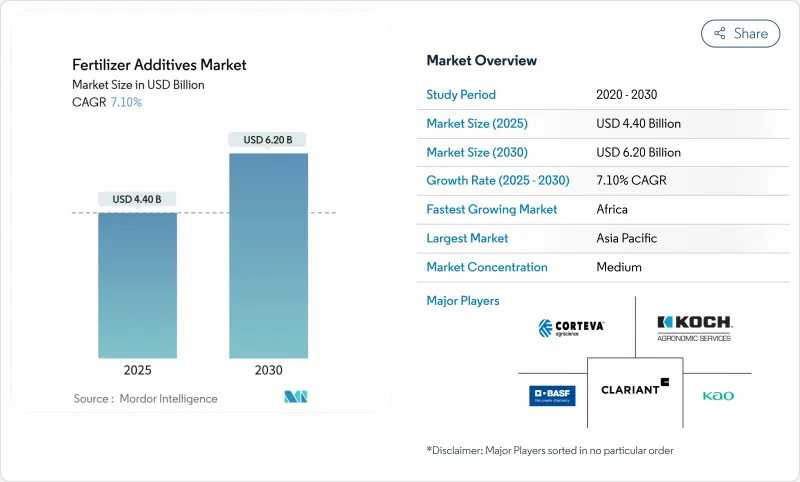
预计肥料添加剂市场将从 2025 年的 44 亿美元成长到 2030 年的 62 亿美元,在整个预测期内以 7.10% 的复合年增长率成长。
更严格的养分使用法规、精密农业的普及以及投入成本的上涨推动了成长,促使种植者寻求能够保护氮磷施用装置的添加剂。如今,提高效率的产品与变数施肥技术结合,该技术已覆盖美国37%的玉米种植面积,为田间和中心支轴式喷灌系统带来精准的微量施肥。这两个地区都依赖防结块剂和被覆剂来保持从播种机到播种箱的流动性。随着绿色氨项目的增加,对低温氨物流的需求也在增长,因为绿色氨计划需要能够在低至-33°C的储存温度下保持活性的添加剂。供应商集中度较低,这为创新供应商提供了空间,他们可以将生物稳定剂、生物聚合物涂层和数位化施肥支援整合到一个高性能产品包中。
全球肥料添加剂市场趋势与洞察
密集型农业区化肥用量增加
粮食需求的激增正推动着在已达到最大密集耕作水准的地区增加肥料添加剂的使用。经合组织-粮农组织《展望》预测,到2032年,全球粮食需求将达到31亿吨,其中大部分来自亚洲和非洲。肥料添加剂可以抵消高湿度灌溉系统中养分流失的增加,目前已有超过500万英亩的土地使用强化配方,以减少灌溉过程中的蒸发(worldfertilizer.com)。使用滴灌和中心支轴式喷灌系统的种植者实现了接近90%的养分利用率,运作人们更多地使用防结块添加剂和被覆剂,以保持灌溉液即使在高湿度条件下也能保持流动性。旨在保障粮食安全的资金流入为肥料添加剂供应商创造了可预测的长期需求曲线。
对高效肥料(EEF)的需求。
一种价值198亿美元的增值肥料将生物刺激剂、抑制剂和控制释放被覆剂结合在单一颗粒中,可根据施肥时间和作物生长阶段进行客製化。尿素酶抑制剂如NBPT与杜罗米德稳定剂结合使用,可减少54%的氨损失,帮助种植者无需额外施肥即可获得高蛋白谷物。随着生物製药被纳入传统营养方案,到2026年,美国生物刺激剂的销售额将成长两倍,达到12亿美元。聚合物包衣控制释放剂进一步拓宽了施肥窗口,推动肥料添加剂市场朝更智慧的多层薄膜方向发展,以实现供需同步。
农作物投入成本不断上涨
2025年初,化肥价格上涨11%,在粮食价格疲软的情况下,进一步挤压了农场的净利率。 UAN28的出厂价达到每吨354美元,磷酸二铵(DAP)达到每吨765美元,磷酸一铵(MAP)达到每吨810美元,这使得融资紧张的农民难以出售这些优质添加剂。荷兰合作银行的「可负担性指数」显示,化肥需求面临中断的风险,尤其是在氮肥和磷肥领域,因为这两类肥料在农业支出中已占很大比例。非洲和南亚的小农户面临着最艰难的抉择,儘管事实证明提高效率的肥料能带来效益,但他们往往还是会延后购买。
细分市场分析
至2024年,抗结块剂将主导肥料添加剂市场,占销售额的37%。其主导地位源自于该物质在潮湿的运输季节和长时间的仓储等待期间,对维持颗粒流动性的关键作用。脂肪胺混合物和低界面活性剂系统目前优于早期的生物蜡,因为它们能形成更薄、更柔韧的薄膜,从而承受铁路车辆内部的压缩。然而,被覆剂将以9.8%的复合年增长率成为成长之王,这主要得益于释放时间长达45至90天的聚合物和生物聚合物薄膜。这两大领先产品充分展现了可靠性和养分释放时机如何影响购买决策。
第二类添加剂也在不断发展。抑制剂正在响应监管机构对抑制氧化亚氮排放的要求,而造粒助剂则赢得了对颗粒公差要求严格的精密施用器的青睐。新兴的混合产品将抗结块剂、抑制剂和被覆剂的功能整合到单一添加剂中,从而降低了污染率并简化了供应链。腐蚀抑制剂正逐渐应用于液体肥料中,而除锈剂在对工人接触标准更为严格的地区也越来越受欢迎。肥料添加剂市场持续朝向多用途化学品发展,这类化学品只需一次用量即可应对多种挑战。
颗粒状营养剂占滑石粉基调理剂、蜡和脂肪胺粉末销售额的68%,带来稳定的现金流。散装码头和驳船运营商依靠固态抗结块剂来保持堆体流动性。液体配方虽然规模较小,但年复合成长率达到8.4%,反映了灌溉面积的成长和无人机喷洒技术的普及。液体分散剂在储槽中快速溶解,可以以可变速率进行线上註入,以匹配产量图。
微胶囊技术介于这两种极端情况之间。它既能保护活性成分,又能延缓其释放,而且由于其外壳由聚乳酸或淀粉製成,可生物降解,因此符合即将出台的微塑胶法规。米利肯公司对微胶囊技术的投入标誌着资本正转向下一代输送方式。在肥料添加剂市场,外形规格正在趋于一致。一些供应商现在提供包含液体种子包衣剂和配套干粉包衣剂的套件,用于追肥,从而确保整个生长季节养分控制的稳定性。
区域分析
亚太地区在销售额方面持续保持领先地位,预计到2024年将占39%的市场份额。这主要得益于中国和印度小农户的高度集中,总合人口总数近30亿人。中国暂时限制磷酸盐出口的政策将有利于国内添加剂生产商,有助于将供应转向本地通路,并降低进口依赖。印度的化学工业预计在2025年实现500亿美元的特种产品销售额,这得益于一项旨在资助土壤实验室和农场感测器建设的数位化农业计画。儘管货运市场波动较大,但国内生产商正利用一体化供应链来降低肥料添加剂市场的交付成本。
随着各国政府和私人资本涌入新的生产基地,非洲将呈现10.5%的最快复合年增长率。在尼日利亚150万吨工厂和印度因多拉马280万吨扩建计画的带动下,到本十年末,营养液消费量将从760万吨激增至1,360万吨。光是西非一地,到2030年就可能超过460万吨。然而,添加剂供应商看到了将流量调节剂与农民培训相结合以提高其应用率的潜力。
北美和欧洲的化肥市场呈现成熟而又不失创新性的成长态势,年复合成长率分别为5.2%和4.5%。英国28%的农场采用豆科作物轮作来调整施肥计画、固氮并减少合成农药的使用。欧盟将于2026年实施的碳边境调节机制将要求化肥进口商揭露碳含量。生物肥料在两大洲的市场份额都在不断增长,但由于化学被覆剂性能稳定,即使在寒冷气候和作物生长窗口期较短的情况下,其仍然广受欢迎。
其他福利:
- Excel格式的市场预测(ME)表
- 3个月的分析师支持
目录
第一章 引言
- 研究假设和市场定义
- 调查范围
第二章调查方法
第三章执行摘要
第四章 市场情势
- 市场概览
- 市场驱动因素
- 高度密集型农业区化肥消费量增加
- 对高效肥料(EEF)的需求
- 促进提高养分利用效率的法规
- 引进精密农业以实现微剂量施用
- 低温低碳氨物流对防止结块提出了新的要求
- 对土壤微生物友善的生物聚合物涂层
- 市场限制
- 农作物投入成本不断上涨
- 加强对食品添加物的环境法规
- 特殊界面活性剂用石油化学原料的挥发性
- 生物替代品的迅速出现
- 监管环境
- 技术展望
- 波特五力分析
- 供应商的议价能力
- 买方的议价能力
- 新进入者的威胁
- 替代品的威胁
- 竞争对手之间的竞争
第五章 市场规模与成长预测
- 按功能
- 抑制剂
- 被覆剂
- 造粒助剂
- 抗结块剂
- 除尘剂
- 腐蚀抑制剂
- 消泡剂
- 其他特色功能
- 按形式
- 固体的
- 液体
- 微胶囊化
- 透过使用
- 尿素
- 硝酸铵
- 磷酸二铵(DAP)
- 磷酸一铵(MAP)
- 硫酸铵
- 三重过磷酸钙(TSP)
- 加州混合
- 其他特殊肥料
- 按作物
- 粮食
- 油籽
- 水果和蔬菜
- 草坪和观赏植物
- 其他的
- 按地区
- 北美洲
- 美国
- 加拿大
- 墨西哥
- 北美其他地区
- 欧洲
- 德国
- 法国
- 英国
- 西班牙
- 义大利
- 俄罗斯
- 其他欧洲地区
- 亚太地区
- 中国
- 印度
- 日本
- 澳洲
- 韩国
- 亚太其他地区
- 中东
- 沙乌地阿拉伯
- 阿拉伯聯合大公国
- 其他中东地区
- 非洲
- 南非
- 埃及
- 其他非洲地区
- 北美洲
第六章 竞争情势
- 市场集中度
- 策略趋势
- 市占率分析
- 公司简介
- BASF SE
- Corteva Agriscience
- Clariant International Ltd
- KAO Corporation
- Koch Agronomic Services
- Arkema(ArrMaz)
- Dorf Ketal Company LLC
- Michelman Inc.
- Novochem Group
- Lanxess AG
- Croda International Public Limited Company(Cargill, Incorporated)
- Hubei Forbon Technology Co., Ltd.
- Jiangsu Kolod Food Ingredients Co., Ltd.
- TIMAC AGRO INDIA PRIVATE LIMITED
- Nutrien Ltd.
- CF Industries
- The Mosaic Company
- Yara International
- ADM
- ICL Group
第七章 市场机会与未来展望
The fertilizer additives market stood at USD 4.40 billion in 2025 and will advance to USD 6.20 billion by 2030, reflecting a steady 7.10% CAGR through the outlook period.
Growth rests on stricter nutrient-use rules, the surge of precision agriculture, and rising input costs that push growers toward additives that guard every unit of applied nitrogen or phosphate. Enhanced-efficiency products now pair with variable-rate technology, which already covers 37% of U.S. corn acres, bringing micro-dosing accuracy to fields and irrigation pivots alike. Asia-Pacific supplies the volume base, Africa supplies the pace, and both regions rely on anti-caking and coating chemistries to preserve flowability from the plant gate to the planter box. Demand is also forming around cryogenic ammonia logistics as green ammonia projects multiply, requiring agents that remain active at -33 °C storage temperatures. Moderate concentration among suppliers leaves room for innovators that combine biological stabilizers, biopolymer coatings, and digital dosing support into a single performance package.
Global Fertilizer Additives Market Trends and Insights
Rising Fertilizer Consumption in High-Intensity Farming Regions
Surging cereal demand lifts additive volumes in zones that already farm at maximum intensity. The OECD-FAO Outlook sees global cereals hitting 3.1 billion tons by 2032, most of it from Asia and Africa. Additives arrest nutrient losses that climb in humid, irrigated systems, and more than 5 million acres now run on enhanced formulations that cut volatilization during fertigation worldfertilizer.com. Growers using drip and pivot systems achieve nutrient-use efficiency near 90%, propelling further uptake of anti-caking and coating chemistries that keep blends free-flowing under high humidity. Capital inflows toward food security create predictable long-term demand curves for additive suppliers.
Demand for Enhanced-Efficiency Fertilizers (EEF)
Value-added fertilizers worth USD 19.8 billion merge biostimulants, inhibitors, and controlled-release coatings into single granules tailored for timing and crop phase. Urease inhibitors such as NBPT lower ammonia losses by 54% when matched with Duromide stabilizer, helping growers derive higher protein grain without extra passes. U.S. biostimulant sales will triple to USD 1.2 billion by 2026, embedding biologicals into conventional nutrient programs. Polymer-coated controlled-release variants further tighten delivery windows, nudging the fertilizer additives market toward smarter, multi-layer films that synchronize supply and root demand.
Rising Cost of Crop Inputs
Fertilizer prices rose 11% in early 2025, squeezing farm margins as grain prices lag. Delivered UAN28 reached USD 354 per ton, DAP USD 765, and MAP USD 810, making premium additives a harder sell for cash-strapped growers. Rabobank's affordability index signals demand destruction risk, especially in nitrogen and phosphate categories that already command the bulk of farm spend. Smallholders in Africa and South Asia face the harshest trade-offs, often deferring enhanced-efficiency purchases despite proven payback.
Other drivers and restraints analyzed in the detailed report include:
- Regulatory Push for Nutrient-Use Efficiency
- Cryogenic Low-Carbon Ammonia Logistics Creating New Anti-Caking Needs
- Tightening Environmental Regulations on Additives
For complete list of drivers and restraints, kindly check the Table Of Contents.
Segment Analysis
Anti-caking products generated the largest slice of the fertilizer additives market in 2024, at 37% of revenue. This dominance stems from the material's vital role in preserving particle flow during humid shipping seasons and long warehouse layovers. Fatty amine blends and reduced-surfactant systems now outperform early bio-waxes by creating thinner, more flexible films that withstand compression in rail cars. Coating agents, however, wear the growth crown with a 9.8% CAGR, propelled by polymer and biopolymer films that meter release over 45- to 90-day spans. These twin leaders show how reliability and nutrient timing together move purchasing decisions.
Second-tier categories also evolve. Inhibitors answer regulatory calls to curb nitrous oxide, and granulation aids win converts in precision applicators that demand tight particle tolerances. Emerging hybrid products fuse anti-caking, inhibitor, and coating functions into single additives that cut inclusion rates and simplify supply chains. Corrosion prevention solutions enter liquid fertilizer service while dedusting agents gain momentum where worker exposure standards tighten. The fertilizer additives market continues to gravitate toward multi-purpose chemistries able to solve several pain points with one dose.
Granular nutrient blends keep solids on top, translating to 68% of revenues and steady cash flows for talc-based conditioners, waxes, and fatty amine powders. Bulk terminals and barge operators rely on solid anti-caking to keep piles free-flowing. Liquids, though smaller, are the climbers, logging an 8.4% CAGR that mirrors rising fertigation acres and drone spray adoption. Liquid dispersions dissolve quickly in nurse tanks, enabling inline injection at variable rates that match yield maps.
Micro-encapsulated formats sit between the two poles. They protect active ingredients, delay the release, and satisfy looming microplastic rules with compostable shells made from polylactic acid or starch. Milliken's push into microcapsules illustrates capital migration toward next-generation delivery routes. In the fertilizer additives market, form factors are converging; some suppliers now offer kits that include both liquid seed dressing and companion dry coating for top-dress passes, ensuring consistent nutrient control across the season.
The Fertilizer Additives Market Report is Segmented by Function (Inhibitors, Coating Agents, Granulation Aids, and More), Form (Solid, Liquid, and Micro-Encapsulated), Application (Urea, Ammonium Nitrate, Diammonium Phosphate (DAP), and More), Crop (Cereals and Grains, Oilseeds, and More) and Geography (North America, Europe, Asia-Pacific, and More). The Report Offers Market Forecasts in Terms of Value (USD).
Geography Analysis
Asia-Pacific retained the sales crown at 39% in 2024 thanks to dense small-plot farms in China and India that collectively serve nearly 3 billion people. Domestic additive lines benefit from China's temporary phosphate export limits, which reshuffle supply into local channels and dampen import reliance. India's chemicals sector is on track to touch USD 50 billion in specialty revenues by 2025, aided by the Digital Agriculture Mission that funds soil labs and on-farm sensors. Within the fertilizer additives market size, domestic producers leverage integrated supply chains to keep delivered costs low despite volatile freight markets.
Africa showcases the fastest 10.5% CAGR as governments and private capital pour funds into new production hubs. Consumption will jump from 7.6 million to 13.6 million tons of nutrients by decade's end, led by Nigeria's 1.5 million ton plant and Indorama's 2.8 million ton expansion. West Africa alone could exceed 4.6 million tons by 2030. Adoption still faces last-mile hurdles such as bagged product costs and rural financing gaps, but additive suppliers see room to package flow conditioners with farmer training to lift acceptance.
North America and Europe register mature yet innovative growth at 5.2% and 4.5% CAGR. Precision agriculture underpins most incremental demand; 28% of U.K. farms adjust fertilizer plans using legume rotations to fix nitrogen and curb synthetic application. The EU Carbon Border Adjustment Mechanism, coming in 2026, will require fertilizer importers to disclose embedded carbon, advantaging local low-emission formulations. Across both continents, biological alternatives gain a share, yet chemical coatings persist because their performance data remain robust under colder climates and tight planting windows.
- BASF SE
- Corteva Agriscience
- Clariant International Ltd
- KAO Corporation
- Koch Agronomic Services
- Arkema (ArrMaz)
- Dorf Ketal Company LLC
- Michelman Inc.
- Novochem Group
- Lanxess AG
- Croda International Public Limited Company (Cargill, Incorporated)
- Hubei Forbon Technology Co., Ltd.
- Jiangsu Kolod Food Ingredients Co., Ltd.
- TIMAC AGRO INDIA PRIVATE LIMITED
- Nutrien Ltd.
- CF Industries
- The Mosaic Company
- Yara International
- ADM
- ICL Group
Additional Benefits:
- The market estimate (ME) sheet in Excel format
- 3 months of analyst support
TABLE OF CONTENTS
1 Introduction
- 1.1 Study Assumptions and Market Definition
- 1.2 Scope of the Study
2 Research Methodology
3 Executive Summary
4 Market Landscape
- 4.1 Market Overview
- 4.2 Market Drivers
- 4.2.1 Rising fertilizer consumption in high-intensity farming regions
- 4.2.2 Demand for enhanced-efficiency fertilizers (EEF)
- 4.2.3 Regulatory push for nutrient-use efficiency
- 4.2.4 Precision-agriculture adoption enabling micro-dosing
- 4.2.5 Cryogenic low-carbon ammonia logistics creating new anti-caking needs
- 4.2.6 Soil-microbiome friendly biopolymer coatings
- 4.3 Market Restraints
- 4.3.1 Rising cost of crop inputs
- 4.3.2 Tightening environmental regulations on additives
- 4.3.3 Petrochemical feedstock volatility for specialty surfactants
- 4.3.4 Rapid emergence of biological substitutes
- 4.4 Regulatory Landscape
- 4.5 Technological Outlook
- 4.6 Porter's Five Forces Analysis
- 4.6.1 Bargaining Power of Suppliers
- 4.6.2 Bargaining Power of Buyers
- 4.6.3 Threat of New Entrants
- 4.6.4 Threat of Substitute Products
- 4.6.5 Intensity of Competitive Rivalry
5 Market Size and Growth Forecasts (Value, USD)
- 5.1 By Function
- 5.1.1 Inhibitors
- 5.1.2 Coating Agents
- 5.1.3 Granulation Aids
- 5.1.4 Anti-Caking Agents
- 5.1.5 Dedusting Agents
- 5.1.6 Corrosion Inhibitors
- 5.1.7 Anti-Foaming Agents
- 5.1.8 Other Niche Functions
- 5.2 By Form
- 5.2.1 Solid
- 5.2.2 Liquid
- 5.2.3 Micro-encapsulated
- 5.3 By Application
- 5.3.1 Urea
- 5.3.2 Ammonium Nitrate
- 5.3.3 Diammonium Phosphate (DAP)
- 5.3.4 Mono-Ammonium Phosphate (MAP)
- 5.3.5 Ammonium Sulfate
- 5.3.6 Triple Superphosphate (TSP)
- 5.3.7 Potash Blends
- 5.3.8 Other Specialty Fertilizers
- 5.4 By Crop
- 5.4.1 Cereals and Grains
- 5.4.2 Oilseeds
- 5.4.3 Fruits and Vegetables
- 5.4.4 Turf and Ornamentals
- 5.4.5 Others
- 5.5 By Geography
- 5.5.1 North America
- 5.5.1.1 United States
- 5.5.1.2 Canada
- 5.5.1.3 Mexico
- 5.5.1.4 Rest of North America
- 5.5.2 Europe
- 5.5.2.1 Germany
- 5.5.2.2 France
- 5.5.2.3 United Kingdom
- 5.5.2.4 Spain
- 5.5.2.5 Italy
- 5.5.2.6 Russia
- 5.5.2.7 Rest of Europe
- 5.5.3 Asia-Pacific
- 5.5.3.1 China
- 5.5.3.2 India
- 5.5.3.3 Japan
- 5.5.3.4 Australia
- 5.5.3.5 South Korea
- 5.5.3.6 Rest of Asia-Pacific
- 5.5.4 Middle East
- 5.5.4.1 Saudi Arabia
- 5.5.4.2 United Arab Emirates
- 5.5.4.3 Rest of Middle East
- 5.5.5 Africa
- 5.5.5.1 South Africa
- 5.5.5.2 Egypt
- 5.5.5.3 Rest of Africa
- 5.5.1 North America
6 Competitive Landscape
- 6.1 Market Concentration
- 6.2 Strategic Moves
- 6.3 Market Share Analysis
- 6.4 Company Profiles (includes Global level Overview, Market level overview, Core Segments, Financials as available, Strategic Information, Market Rank/Share for key companies, Products and Services, and Recent Developments)
- 6.4.1 BASF SE
- 6.4.2 Corteva Agriscience
- 6.4.3 Clariant International Ltd
- 6.4.4 KAO Corporation
- 6.4.5 Koch Agronomic Services
- 6.4.6 Arkema (ArrMaz)
- 6.4.7 Dorf Ketal Company LLC
- 6.4.8 Michelman Inc.
- 6.4.9 Novochem Group
- 6.4.10 Lanxess AG
- 6.4.11 Croda International Public Limited Company (Cargill, Incorporated)
- 6.4.12 Hubei Forbon Technology Co., Ltd.
- 6.4.13 Jiangsu Kolod Food Ingredients Co., Ltd.
- 6.4.14 TIMAC AGRO INDIA PRIVATE LIMITED
- 6.4.15 Nutrien Ltd.
- 6.4.16 CF Industries
- 6.4.17 The Mosaic Company
- 6.4.18 Yara International
- 6.4.19 ADM
- 6.4.20 ICL Group
7 Market Opportunities and Future Outlook
 肥料添加剂市场:全球市场按产品类型、形态、作物类型、技术和应用进行预测 - 2026-2032年
 全球肥料添加剂市场规模、份额、趋势和成长分析报告(2026-2034年)
 2026年全球水耕肥料添加剂市场报告2026年全球肥料添加剂市场报告
 肥料添加剂市场-全球产业规模、份额、趋势、机会及预测(按功能、形式、应用、地区和竞争格局划分,2021-2031年)
 肥料添加剂市场规模、份额和成长分析(按形态、功能、最终产品和地区划分)-2026-2033年产业预测
 化肥抗结块剂-全球市占率及排名、总收入及需求预测(2025-2031年)
 全球技术级硝酸铵及炸药市场:依产品类型、应用、终端用户产业及地区划分(2035-2035)
 2025-2033年肥料添加剂市场规模、份额、趋势及预测(按功能、形式、应用和地区)液体尿素硝酸铵市场-全球产业规模、份额、趋势、机会和预测,按销售管道、应用、应用模式、地区和竞争细分,2020-2030 年