


 |
市场调查报告书
商品编码
1850215
製造业中的桌面虚拟化:市场占有率分析、产业趋势、统计数据和成长预测(2025-2030 年)Desktop Virtualization In Manufacturing - Market Share Analysis, Industry Trends & Statistics, Growth Forecasts (2025 - 2030) |
||||||
※ 本网页内容可能与最新版本有所差异。详细情况请与我们联繫。
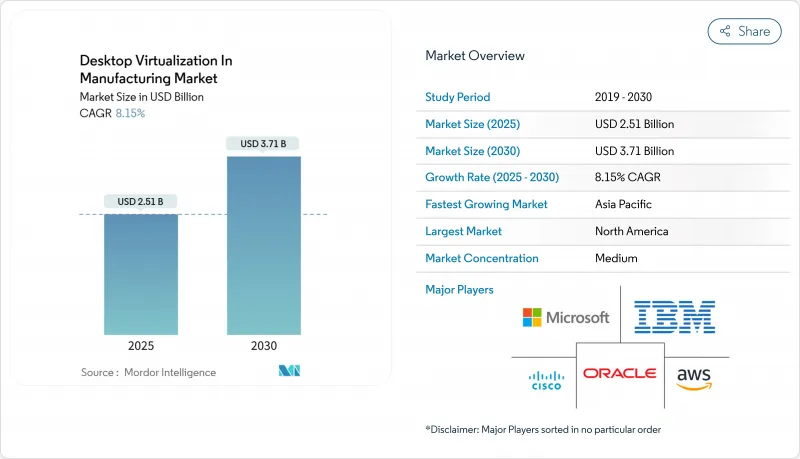
预计到 2025 年製造业桌面虚拟化市场规模将达到 25.1 亿美元,到 2030 年将达到 37.1 亿美元,复合年增长率为 8.2%。
这一扩张反映了工厂正转向集中式、安全、可远端存取的工作站,以整合操作技术和资讯技术工作负载。对混合工作模式的旺盛需求、更严格的网路安全要求以及透过虚拟管道日益增长的运算密集型 CAD/CAE 工作负载,正在推动这些工作负载的采用。供应商也在实现配置自动化,并在其平台上配备人工智慧功能,以预测效能瓶颈,从而为买家带来新的价值。同时,製造商正在寻求在本地控制和选择性云端卸载之间取得平衡,以降低基础设施成本,同时确保智慧财产权安全。
全球製造业桌面虚拟化市场趋势与洞察
快速转向混合和远端製造业劳动力
数位双胞胎平台使生产经理能够从任何地方监督生产线,例如宝马的智慧工厂和联合利华的巴西工厂。虚拟桌面使工程师能够从任何地方安全、高效地存取 CAD、MES 和 SCADA 工具,即使在差旅和现场访问受限的情况下也能确保计划按计划进行。新一代「天蓝色」员工,例如精通资料视觉化和机器学习仪表板的操作员,需要灵活的桌面,并随着技能组合的变化而不断发展。此外,製造商正在利用虚拟化在供应链衝击期间保持业务永续营运,快速将工作负载切换到备用站点。这些因素共同推动了製造业对桌面虚拟化的需求。
安全 OT-IT 融合端点的需求
霍尼韦尔指出,工厂车间设备与企业网路之间日益增强的连接性扩大了威胁面,统一的端点控制至关重要。虚拟桌面基础架构 (VDI) 透过集中身份验证、修补程式和日誌记录以及隔离生产资料来支援零信任框架。符合 IEC 62443 及类似标准将进一步加速其采用。随着製造商将工业IoT资料整合到企业资源系统中,VDI 可建立即时视觉所需的安全桥樑,而无需将控制器暴露于公共互联网。因此,安全需求是製造业桌面虚拟化市场发展的关键驱动力。
棕地工厂的 LAN 延迟较高
Citrix 效能指南警告称,如果延迟超过 300 毫秒,则会话品质将迅速下降。维修生产网络既复杂又昂贵,导致许多计划延期。在连线升级完成之前,企业会将 VDI 部署限制在非关键区域,这限制了製造业桌面虚拟化市场的短期成长。
細項分析
到2024年,软体层级将占据65.7%的收入,这主要得益于CAD、MES和端点安全附加元件所需的永久授权和订阅授权。同时,随着工厂寻求集成专家将虚拟桌面与PLC网路和工业控制通讯协定集成,服务类别预计将以9.8%的复合年增长率增长。实施、託管和合规性审核占支出的大部分。现在,相当一部分合约捆绑了人工智慧主导的监控,这推动了对託管服务的需求。向以专业知识为中心的合约的转变,凸显了製造业桌面虚拟化市场从工具采购到生命週期伙伴关係关係的演变。
受 IEC 62443 和 NIST 800-82 标准约束的製造商越来越多地将配置检验和持续修补程式外包。同时,平台供应商正在引入参考架构,由于运动控制延迟等即时限制,这些架构需要现场调校。因此,服务供应商的净利率正在提升,并在供应商选择方面影响力也在增强。预计到 2030 年,製造业桌面虚拟化服务的市场规模将在整体支出中占据重要地位,儘管授权仍是最大的支出项目。
至2024年,託管虚拟桌面将维持59.2%的市场份额,充分利用大型汽车和电子集团现有的资料中心。然而,桌面即服务的复合年增长率将达到8.8%,顶级业务部门将采用营运支出模式和快速引进週期。云端原生编配在设计衝刺尖峰时段自动扩充GPU资源,进而消除过度配置。因此,製造业的桌面虚拟化市场正显着转向类似SaaS的消费方式,同时又不失工程师所需的确定性效能控制。
在医疗设备製造等受监管产业,混合架构已成为常态。蓝图将仲介和身份验证堆迭置于云端,而将镜像储存库置于本机。这种架构在满足资料驻留规则的同时,也能实现远端协作。随着超大规模企业在工业丛集附近扩展区域可用区,网路抖动将会减少,从而进一步推动DaaS的采用。分析师预计,HVD的主导地位将稳定下降,但对于无法承受公共云端中断风险的超低延迟组装主机而言,它们仍然可行。
区域分析
受向零信任框架快速转型以及在汽车、航太和半导体领域强劲表现的推动,北美地区将占2024年销售额的39.8%。该地区高度重视与MES和品质侦测摄影机的深度整合。通用汽车正与NVIDIA 奖励合作,优化其白色车身机器人生产线,突显了即时模拟与虚拟桌面之间强大的协同效应。随着企业回流激励措施推动其供应链重组,虚拟化技术能够在实体设备到达之前远端试运行新生产线,从而支援北美製造业桌面虚拟化市场的发展轨迹。
亚太地区正以8.6%的复合年增长率扩张,推动中国和印度的数位製造业发展。主权云授权要求资料必须留在国内,这刺激了在本地超大规模地区建构的本地DaaS的兴起。政府支持的电子和半导体园区正在采用虚拟化技术,以整合稀缺的CAD/EDA授权并缩短设计週期。 NVIDIA计划与富士康和纬创资通建立的联合工厂将进一步提升区域运算能力,为将先前难以承受的工作负载转移到规模较小的供应商铺平道路。同时,东南亚国协正在将工业4.0补贴重新用于网路升级,以缓解曾经阻碍其应用的延迟限制。
随着《一般资料保护规范》、《网路弹性法案》和《NIS 2 指令》加强关键领域的网路安全义务,欧洲也稳步成长。奥迪的 Edge Cloud 4 Production 计画在 VMware Cloud Foundation 上虚拟化了 PLC 和工作站,将实体控制器的数量减少了 30%。同时,能源效率正在推动精简型用户端的采用,这可以降低端点功耗并有助于提高 ESG 记分卡。欧洲各地的製造公司也青睐跨境工程中心,在这些中心,虚拟桌面可以促进人才共用,而无需重新安置员工。中东和非洲市场虽然仍处于起步阶段,但受惠于优先发展先进製造业的国家多元化政策。新工厂从第一天起就实施 VDI,从而避免了传统网路的缺陷。区域电信业者正在与平台供应商合作推出低延迟边缘区域,为製造业的桌面虚拟化市场奠定基础设施基础。
其他福利:
- Excel 格式的市场预测 (ME) 表
- 3个月的分析师支持
目录
第一章 引言
- 研究假设和市场定义
第二章调查方法
第三章执行摘要
第四章 市场状况
- 市场驱动因素
- 快速过渡到混合和远端製造劳动力
- OT-IT融合端点的安全需求
- 针对 3D CAD/CAE 的成本最佳化云端 GPU 实例
- 利用虚拟桌面日誌记录实现预测性维护
- 用于 ESG 记分卡的节能精简型用户端
- 政府在技术出口地区实施「主权云」政策
- 市场限制
- 棕地工厂的 LAN 延迟增加
- 永久软体许可证的累计成本
- OT网路安全标准实施延迟
- VDI影像工程技术人才短缺
- 价值链分析
- 监管格局
- 技术展望
- 波特五力分析
- 供应商的议价能力
- 消费者议价能力
- 新进入者的威胁
- 替代品的威胁
- 竞争对手之间的竞争
- 评估宏观经济趋势对市场的影响
第五章市场规模及成长预测
- 按组件
- 软体
- 服务
- 桌面串流平台
- 託管虚拟桌面 (HVD)
- 託管共用桌面(HSD)
- 桌面即服务 (DaaS)
- 远端桌面服务 (RDS)
- 依部署方式
- 本地部署
- 云
- 按公司规模
- 大公司
- 小型企业
- 按地区
- 北美洲
- 美国
- 加拿大
- 墨西哥
- 欧洲
- 德国
- 英国
- 法国
- 义大利
- 西班牙
- 其他欧洲地区
- 亚太地区
- 中国
- 日本
- 印度
- 韩国
- 澳洲
- 其他亚太地区
- 南美洲
- 巴西
- 阿根廷
- 南美洲其他地区
- 中东和非洲
- 中东
- 沙乌地阿拉伯
- 阿拉伯聯合大公国
- 土耳其
- 其他中东地区
- 非洲
- 南非
- 埃及
- 奈及利亚
- 其他非洲国家
- 北美洲
第六章 竞争态势
- 市场集中度
- 策略趋势
- 市占率分析
- 公司简介
- Citrix Systems Inc.
- VMware Inc.
- Microsoft Corp.(Azure Virtual Desktop and Windows 365)
- Amazon Web Services Inc.(Amazon WorkSpaces)
- Dell Technologies Inc.
- IBM Corp.
- Huawei Technologies Co. Ltd.
- Nutanix Inc.
- Parallels International GmbH
- Ericom Software
- NComputing Co. Ltd.
- Red Hat Inc.
- Cisco Systems Inc.
- Fujitsu Ltd.
- Hewlett Packard Enterprise
- Oracle Corp.
- Leostream Corp.
- Scale Computing
- 10ZiG Technology
- IGEL Technology GmbH
第七章 市场机会与未来展望
The desktop virtualization in manufacturing market size was valued at USD 2.51 billion in 2025 and is on track to reach USD 3.71 billion by 2030, advancing at an 8.2% CAGR.
This expansion reflects factories' shift toward centralized, secure, and remotely accessible workstations that unify operational-technology and information-technology workloads. High demand for hybrid work models, stricter cybersecurity mandates, and the growing use of compute-heavy CAD/CAE workloads over virtual channels fuel adoption. Vendors are also layering artificial-intelligence features onto platforms to automate provisioning and predict performance bottlenecks, creating new value levers for buyers. Simultaneously, manufacturers are balancing on-premise control with selective cloud offloading to keep intellectual property safe while still cutting infrastructure costs.
Global Desktop Virtualization In Manufacturing Market Trends and Insights
Rapid Shift to Hybrid and Remote Manufacturing Workforces
Digital-twin platforms allow production managers to oversee lines from anywhere, as shown in BMW's smart factory and Unilever's Brazil plant deployments. Virtual desktops supply engineers with secure, high-performance access to CAD, MES, and SCADA tools regardless of location, keeping projects on schedule when travel or site access is limited. A new cadre of "sky-blue-collared" employees-operators proficient in data visualization and machine-learning dashboards-needs flexible desktops that evolve with shifting skill sets. Manufacturers also rely on virtualization to maintain business continuity during supply-chain shocks, quickly rerouting workloads to alternate sites. Collectively, these factors amplify demand for the desktop virtualization in manufacturing market.
Need to Secure OT-IT Convergence Endpoints
Honeywell notes that tighter connectivity between plant-floor devices and corporate networks expands the threat surface, making unified endpoint control vital. Virtual-desktop infrastructure (VDI) underpins zero-trust frameworks by centralizing authentication, patching, and logging while isolating production data. Compliance with IEC 62443 and similar standards further accelerates uptake. As manufacturers integrate Industrial-IoT feeds with enterprise resource systems, VDI creates the secure bridge required for real-time visibility without exposing controllers to the public internet. Consequently, security mandates remain a primary catalyst for the desktop virtualization in manufacturing market.
High LAN Latency in Brown-Field Plants
Citrix performance guidelines warn that session quality declines sharply past 300 ms latency, a threshold often exceeded in older factories relying on daisy-chained switches. Retrofitting networks during active production is complex and expensive, delaying many projects. Until connectivity upgrades complete, organizations cap VDI roll-outs to non-critical zones, tempering near-term growth of the desktop virtualization in manufacturing market.
Other drivers and restraints analyzed in the detailed report include:
- Cloud Cost-Optimised GPU Instances for 3-D CAD/CAE
- Predictive Maintenance Enabled by Virtual Desktop Logging
- Persistent Software-Licence Stacking Costs
For complete list of drivers and restraints, kindly check the Table Of Contents.
Segment Analysis
The software layer secured 65.7% revenue in 2024, thanks to perpetual and subscription licenses required for CAD, MES, and endpoint-security add-ons. Concurrently, the services category is projected to rise at 9.8% CAGR as plants seek integration experts to merge virtual desktops with PLC networks and industrial-control protocols. Implementation, managed hosting, and compliance audits make up the bulk of the spend. A sizeable share of contracts now bundle AI-driven monitoring, pushing managed-services demand higher. This shift toward expertise-heavy engagements reveals how desktop virtualization in manufacturing market is evolving from tool purchase to lifecycle partnership.
Manufacturers obligated to adhere to IEC 62443 and NIST 800-82 increasingly outsource configuration validation and continuous patching. In parallel, platform vendors introduce reference architectures that still need on-site tuning for real-time constraints such as motion-control latency. As a result, service providers capture incremental margins, and their influence over vendor choice grows. The desktop virtualization in the manufacturing market size for services is forecast to account for a larger slice of overall spend by 2030, even as licensing remains the single biggest line item.
Hosted Virtual Desktop retained a 59.2% share in 2024, capitalizing on existing data-center footprints within large automotive and electronics conglomerates. However, Desktop-as-a-Service is scaling at 8.8% CAGR as line-of-business heads embrace opex models and faster deployment cycles. Cloud-native orchestration now auto-scales GPU resources during peak design sprints, eliminating over-provisioning. The desktop virtualization in manufacturing market thus sees a pronounced pivot toward SaaS-like consumption without losing the deterministic performance controls that engineers demand.
In regulated segments such as medical-device fabrication, hybrid architectures prevail: blueprints place the broker and authentication stack in the cloud while image repositories stay on-premise. This architecture satisfies data-residency rules yet still grants remote collaboration benefits. As hyperscalers expand regional availability zones near industrial clusters, network jitter falls, further encouraging DaaS uptake. Analysts expect HVD dominance to erode steadily, though it will remain relevant for ultra-low-latency assembly-line consoles that cannot risk public-cloud outages.
The Desktop Virtualization in Manufacturing Market Report is Segmented by Component (Software and Services), Desktop Delivery Platform (Hosted Virtual Desktop (HVD), Hosted Shared Desktop (HSD), and More), Deployment Mode (On-Premise and Cloud), Organization Size (Large Enterprises and Small and Medium Enterprises (SMEs)), and Geography. The Market Forecasts are Provided in Terms of Value (USD).
Geography Analysis
North America controlled 39.8% of 2024 revenue due to early migration toward zero-trust frameworks and substantial automotive, aerospace, and semiconductor verticals. The region's installations emphasize deep integration with MES and quality-inspection cameras. General Motors' collaboration with NVIDIA Omniverse to optimize body-in-white robotics lines underscores the powerful synergy between real-time simulation and virtual desktops. As reshoring incentives prompt companies to reconstruct supply chains, virtualization enables remote commissioning of new lines before physical equipment arrives, anchoring the desktop virtualization in manufacturing market trajectory in North America.
Asia-Pacific is expanding at an 8.6% CAGR, spearheaded by China's and India's digital-manufacturing drives. Sovereign-cloud mandates require data to remain in-country, giving rise to domestic DaaS offerings built on local hyperscale regions. Government-backed electronics and semiconductor parks adopt virtualization to pool scarce CAD/EDA licenses, shortening design cycles. NVIDIA's planned joint facilities with Foxconn and Wistron further lift regional compute capacity, opening pathways for small suppliers to migrate workloads previously out of reach. In parallel, ASEAN nations channel Industry 4.0 grants into network upgrades, mitigating latency constraints that once hindered adoption.
Europe follows with steady gains as GDPR, the Cyber-Resilience Act, and the NIS 2 Directive tighten cybersecurity obligations for critical sectors. Audi's Edge Cloud 4 Production program virtualizes PLCs and worker stations on VMware Cloud Foundation to cut physical-controller counts by 30%. Meanwhile, energy-efficiency imperatives drive uptake of thin clients that slash endpoint power draw, aiding ESG scorecards. Pan-European manufacturers also favor cross-border engineering hubs, where virtual desktops ease talent sharing without relocating staff. The Middle East and Africa market, while nascent, benefits from national diversification agendas that prioritize advanced manufacturing. New green-field plants incorporate VDI from day one, skirting legacy networking pitfalls. Regional telcos partner with platform providers to launch low-latency edge zones, creating an infrastructural springboard for the desktop virtualization in manufacturing market.
- Citrix Systems Inc.
- VMware Inc.
- Microsoft Corp. (Azure Virtual Desktop and Windows 365)
- Amazon Web Services Inc. (Amazon WorkSpaces)
- Dell Technologies Inc.
- IBM Corp.
- Huawei Technologies Co. Ltd.
- Nutanix Inc.
- Parallels International GmbH
- Ericom Software
- NComputing Co. Ltd.
- Red Hat Inc.
- Cisco Systems Inc.
- Fujitsu Ltd.
- Hewlett Packard Enterprise
- Oracle Corp.
- Leostream Corp.
- Scale Computing
- 10ZiG Technology
- IGEL Technology GmbH
Additional Benefits:
- The market estimate (ME) sheet in Excel format
- 3 months of analyst support
TABLE OF CONTENTS
1 INTRODUCTION
- 1.1 Study Assumptions and Market Definition
2 RESEARCH METHODOLOGY
3 EXECUTIVE SUMMARY
4 MARKET LANDSCAPE
- 4.1 Market Drivers
- 4.1.1 Rapid shift to hybrid and remote manufacturing workforces
- 4.1.2 Need to secure OT-IT convergence endpoints
- 4.1.3 Cloud cost-optimised GPU instances for 3-D CAD/CAE
- 4.1.4 Predictive maintenance enabled by virtual desktop logging
- 4.1.5 Energy-efficient thin clients for ESG scorecards
- 4.1.6 Government "sovereign cloud" mandates in high-tech export zones
- 4.2 Market Restraints
- 4.2.1 High LAN latency in brown-field plants
- 4.2.2 Persistent software-licence stacking costs
- 4.2.3 OT cyber-safety standards slow roll-outs
- 4.2.4 Skilled-labour gap for VDI image engineering
- 4.3 Value Chain Analysis
- 4.4 Regulatory Landscape
- 4.5 Technological Outlook
- 4.6 Porter's Five Forces Analysis
- 4.6.1 Bargaining Power of Suppliers
- 4.6.2 Bargaining Power of Consumers
- 4.6.3 Threat of New Entrants
- 4.6.4 Threat of Substitute Products
- 4.6.5 Intensity of Competitive Rivalry
- 4.7 Assessment of the Impact of Macroeconomic Trends on the Market
5 MARKET SIZE AND GROWTH FORECASTS (VALUE)
- 5.1 By Component
- 5.1.1 Software
- 5.1.2 Services
- 5.2 By Desktop Delivery Platform
- 5.2.1 Hosted Virtual Desktop (HVD)
- 5.2.2 Hosted Shared Desktop (HSD)
- 5.2.3 Desktop-as-a-Service (DaaS)
- 5.2.4 Remote Desktop Services (RDS)
- 5.3 By Deployment Mode
- 5.3.1 On-premise
- 5.3.2 Cloud
- 5.4 By Organisation Size
- 5.4.1 Large Enterprises
- 5.4.2 Small and Medium Enterprises (SMEs)
- 5.5 By Geography
- 5.5.1 North America
- 5.5.1.1 United States
- 5.5.1.2 Canada
- 5.5.1.3 Mexico
- 5.5.2 Europe
- 5.5.2.1 Germany
- 5.5.2.2 United Kingdom
- 5.5.2.3 France
- 5.5.2.4 Italy
- 5.5.2.5 Spain
- 5.5.2.6 Rest of Europe
- 5.5.3 Asia-Pacific
- 5.5.3.1 China
- 5.5.3.2 Japan
- 5.5.3.3 India
- 5.5.3.4 South Korea
- 5.5.3.5 Australia
- 5.5.3.6 Rest of Asia-Pacific
- 5.5.4 South America
- 5.5.4.1 Brazil
- 5.5.4.2 Argentina
- 5.5.4.3 Rest of South America
- 5.5.5 Middle East and Africa
- 5.5.5.1 Middle East
- 5.5.5.1.1 Saudi Arabia
- 5.5.5.1.2 United Arab Emirates
- 5.5.5.1.3 Turkey
- 5.5.5.1.4 Rest of Middle East
- 5.5.5.2 Africa
- 5.5.5.2.1 South Africa
- 5.5.5.2.2 Egypt
- 5.5.5.2.3 Nigeria
- 5.5.5.2.4 Rest of Africa
- 5.5.1 North America
6 COMPETITIVE LANDSCAPE
- 6.1 Market Concentration
- 6.2 Strategic Moves
- 6.3 Market Share Analysis
- 6.4 Company Profiles (includes Global level Overview, Market level overview, Core Segments, Financials as available, Strategic Information, Market Rank/Share for key companies, Products and Services, and Recent Developments)
- 6.4.1 Citrix Systems Inc.
- 6.4.2 VMware Inc.
- 6.4.3 Microsoft Corp. (Azure Virtual Desktop and Windows 365)
- 6.4.4 Amazon Web Services Inc. (Amazon WorkSpaces)
- 6.4.5 Dell Technologies Inc.
- 6.4.6 IBM Corp.
- 6.4.7 Huawei Technologies Co. Ltd.
- 6.4.8 Nutanix Inc.
- 6.4.9 Parallels International GmbH
- 6.4.10 Ericom Software
- 6.4.11 NComputing Co. Ltd.
- 6.4.12 Red Hat Inc.
- 6.4.13 Cisco Systems Inc.
- 6.4.14 Fujitsu Ltd.
- 6.4.15 Hewlett Packard Enterprise
- 6.4.16 Oracle Corp.
- 6.4.17 Leostream Corp.
- 6.4.18 Scale Computing
- 6.4.19 10ZiG Technology
- 6.4.20 IGEL Technology GmbH
7 MARKET OPPORTUNITIES AND FUTURE OUTLOOK
- 7.1 White-space and Unmet-Need Assessment
 2025-2029 年全球虚拟桌面虚拟化市场
 2025 年至 2033 年桌面虚拟化市场报告(按类型(虚拟桌面基础设施、桌面即服务、远端桌面服务)、组件、组织规模、垂直行业和地区划分)日本桌面虚拟化市场报告(按组件、类型(虚拟桌面基础设施、桌面即服务、远端桌面服务)、组织规模、行业垂直领域和地区)2025 年至 2033 年
 远端桌面软体的全球市场
 2025年远端桌面软体全球市场报告
 远端桌面软体市场规模、份额和成长分析(按部署类型、企业规模、最终用户和地区)- 产业预测 2025-20322025 年虚拟桌面虚拟化全球市场报告全球虚拟桌面市场
 印度虚拟桌面:市场占有率分析、行业趋势和成长预测(2025-2030 年)能源领域的虚拟桌面:市场占有率分析、产业趋势与成长预测(2025-2030)