


 |
市场调查报告书
商品编码
1850225
商业卫星影像:市场份额分析、行业趋势、统计数据和成长预测(2025-2030 年)Commercial Satellite Imaging - Market Share Analysis, Industry Trends & Statistics, Growth Forecasts (2025 - 2030) |
||||||
※ 本网页内容可能与最新版本有所差异。详细情况请与我们联繫。
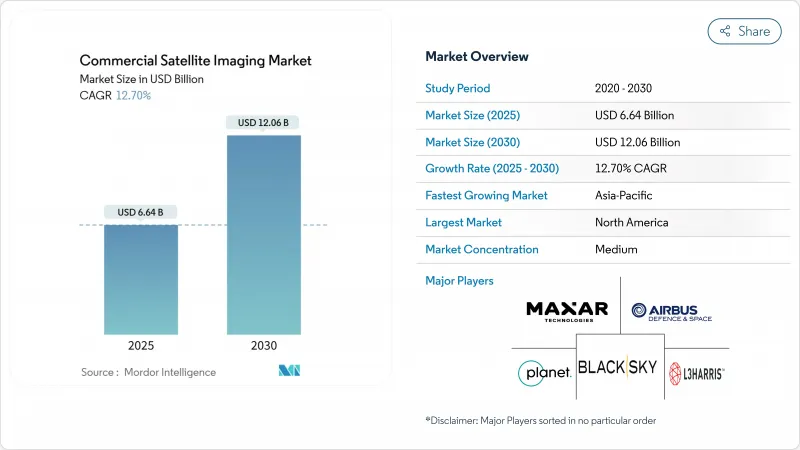
预计到 2025 年,商业卫星影像市场规模将达到 66.4 亿美元,到 2030 年将达到 120.6 亿美元,在此期间的复合年增长率将达到 12.70%。
随着2025年后甲烷检验规则、人工智慧赋能任务以及合成孔径雷达(SAR)卫星群的融合,商业卫星影像市场正从资料分发转向情报即服务(Intelligence as a Service),近即时洞察的价值日益凸显。推动这一市场成长的因素包括亚太地区的智慧城市计画、巨量资料分析的快速普及以及因地缘政治风险加剧而增加的国防地理情报机构支出。同时,儘管光学系统仍保持着数量优势,但SAR技术的创新正在削弱这一优势,因为它能够提供全天候覆盖和亚小时的重访成本。轨道拥塞加剧、部署成本高以及来自先进无人机成像技术的竞争正在限制市场成长,但商业卫星影像市场仍保持上升趋势。
全球商业卫星成像市场趋势与洞察
大面积高效监测的需求日益增长
全球基础设施扩张和资源开采使得利用地面方法进行大规模监测变得不经济。 Planet Labs 的 200 多颗 Dove 卫星每天提供 3-5 公尺分辨率的影像,实现了自动变化检测,使新探勘项目的矿产发现率翻了一番。政府机构也在结合商业数据和开放原始码数据来追踪土地利用变化,这在本地网路稀疏的地区尤其重要。如今,自动化演算法能够在数小时内检测出非法采矿和森林砍伐行为,为商业卫星影像市场的成长铺平了道路。
增加智慧城市计划
亚太地区的市政当局正在将卫星影像与物联网感测器和边缘运算相结合,以管理交通、能源和气候适应性专案。德国航空航天中心(DLR)正在出口一款基于人工智慧的城市足迹产品,亚洲开发银行则在资助卫星连接,以支持数位包容性目标的实现。这些计划正在推动商业卫星图像市场持续成长的需求。
高解析度航拍影像
厘米级无人机影像在建筑追踪和精密农业等局部任务中超越了卫星影像。无人机机载即时处理将缩小速度差距,卫星营运商将优先考虑广域、跨境覆盖和标准化产品。
细分市场分析
到2024年,地理空间测绘将占总收入的31.7%,巩固其作为商业卫星影像市场基石的地位。长期测绘合约能够带来可预测的现金流,并促进业务的重复性,尤其对国家测绘机构更是如此。灾害管理正以13.5%的复合年增长率快速成长,主要得益于气候相关紧急情况对近乎即时影像的需求,以增强态势感知能力。随着自动化变化检测演算法革新灾后分析方式,商业卫星影像市场也将从中受益。自然资源管理和安全监控将采用人工智慧增强型监控技术,以满足环境、社会和治理(ESG)法规以及地缘政治情报需求。建筑应用将把影像与建筑资讯模型(BIM)系统集成,用于计划管治;测绘机构将利用民主化的资料存取来调查环境变化。
该领域的成长前景与日益严格的合规要求以及分析平台日趋成熟相一致,这些平台能够将衍生情报而非原始像素货币化。随着灾害频传,保险公司和政府纷纷采购基于订阅的预警服务,提升了商业卫星影像产业的经常性收入基础。跨产业的协同效应,例如将甲烷监测载荷和光学成像仪整合在同一平台上,正在推动平台多元化,并提高商业卫星影像市场的利用率。
2024年,政府机构支出占总支出的39.8%,反映出土地管理、气候监测和基础建设监测方面根深蒂固的需求。美国地理空间情报局价值2亿美元的「月球B」卫星计画就是一个持续采购的例子。然而,受战术性情报需求的推动,军费和国防预算预计将以12.8%的复合年增长率成长,成为成长最快的领域。国防部正在整合商业图像以补充机密资产,并加速在安全网路中应用这些影像。
交通运输和物流产业越来越依赖天基资料进行路线优化,而能源产业则需要持续监控以履行排放报告义务。林业和农业正在引入高精度农业平台,将频谱数据与气象分析相结合,扩大了商业卫星影像市场在农业领域的应用范围。学术机构和金融机构正在采用卫星衍生数据进行风险分析,不仅丰富了终端用户群体,也增强了市场韧性。
区域分析
北美地区将占2024年收入的38.6%,这主要得益于国防费用和成熟的商业营运商。 Maxar公司价值3.59亿美元的入口网站合约显示政府需求持续强劲。该地区深厚的创投生态系统正在为人工智慧分析公司提供资金,并推动商业卫星图像市场的持续创新。加拿大的Canadarm3和Globalstar合约凸显了国内航太製造业的发展势头,并增强了北美业者的供应链自主性。
亚太地区是成长最快的地区,预计到2030年复合年增长率将达到12.9%。印度计画在2032年实现473亿美元的航太收入,但2024年的资金筹措下降了55%,凸显了其在资金获取方面面临的挑战。儘管市场数据仍不明朗,但中国正在加快商业发射和感测器创新步伐。日本正利用卫星资源进行灾害管理,并参与四方安全对话(Quad)在空间情境察觉的合作。这些战略倡议正在推动商业卫星图像市场的采购。
欧洲凭藉其哥白尼式的数据政策以及空中巴士等行业巨头的支持,保持着强劲的地位。 EUSPA市场报告指出,可再生能源和渔业监测领域的地球观测收入正在成长。 SES以31亿美元收购Intelsat将提升该地区的卫星容量,但仍不及星链的低地球轨道规模。中东和非洲正在利用商业合成孔径雷达(SAR)技术开展水安全和基础设施计划,而南美洲则正藉助巴西的国家计画来推动当地应用。总而言之,这些动态正在推动全球更多参与商业卫星图像市场。
其他福利:
- Excel格式的市场预测(ME)表
- 3个月的分析师支持
目录
第一章 引言
- 研究假设和市场定义
- 调查范围
第二章调查方法
第三章执行摘要
第四章 市场情势
- 市场概览
- 市场驱动因素
- 大面积高效率监控的需求日益增长
- 智慧城市倡议的兴起
- 巨量资料和影像分析简介
- 强制对甲烷排放进行卫星检验(2025年起实施ESG规则)
- 广泛采用 SAR卫星群实现全天候重访
- 人工智慧驱动的提示和任务队列可在1小时内促进回访经济效益。
- 市场限制
- 可从其他空中平台取得高解析度影像
- 资本密集型星座部署与发射成本
- 轨道拥塞和频谱管理瓶颈
- 资料隐私法规减缓了商业许可的速度
- 价值/供应链分析
- 监管环境
- 技术展望
- 波特五力分析
- 买方的议价能力
- 供应商的议价能力
- 新进入者的威胁
- 替代品的威胁
- 竞争对手之间的竞争
第五章 市场规模与成长预测
- 透过使用
- 地理空间资料收集与製图
- 自然资源管理
- 监控与安防
- 保护与研究
- 建设与开发
- 灾害管理
- 国防与情报
- 最终用户
- 政府
- 建造
- 运输/物流
- 军事/国防
- 活力
- 林业和农业
- 其他最终用户
- 按影像类型
- 光学(频谱/全色)
- 雷达/合成孔径雷达
- 高光谱遥测
- 热感的
- 按空间分辨率
- 0.3米或更低(非常高)
- 0.3米~1米(高)
- 1米-5米(中)
- 超过5米(低)
- 按轨道等级
- 低地球轨道(LEO)
- 中轨道(MEO)
- 地球静止轨道(GEO)
- 按地区
- 北美洲
- 美国
- 加拿大
- 南美洲
- 巴西
- 其他南美洲
- 欧洲
- 德国
- 法国
- 英国
- 俄罗斯
- 其他欧洲地区
- 亚洲
- 中国
- 印度
- 日本
- 韩国
- 其他亚洲地区
- 中东和非洲
- 中东
- 沙乌地阿拉伯
- 阿拉伯聯合大公国
- 土耳其
- 非洲
- 南非
- 其他非洲地区
- 北美洲
第六章 竞争情势
- 市场集中度
- 策略趋势
- 市占率分析
- 公司简介
- Maxar Technologies
- Airbus Defence & Space
- Planet Labs PBC
- BlackSky Technology Inc.
- L3Harris Technologies
- ICEYE
- Capella Space
- Satellogic
- Ursa Space Systems
- European Space Imaging(EUSI)
- ImageSat International
- Galileo Group
- SpaceKnow
- SI Imaging Services
- Deimos Imaging
- GHGSat
- Spire Global
- Umbra Lab
- Earth-i
- Capella Federal
- Satellogic USA
- Orbital Insight
第七章 市场机会与未来展望
The commercial satellite imaging market stands at USD 6.64 billion in 2025 and is forecast to reach USD 12.06 billion by 2030, reflecting a 12.70% CAGR over the period.
The commercial satellite imaging market is pivoting from data delivery to intelligence-as-a-service as post-2025 methane-verification rules, AI-enabled tasking, and SAR micro-constellations converge to raise the value of near-real-time insights . Demand accelerators include smart-city programs across Asia-Pacific, the rapid adoption of big-data analytics, and institutional spending on defense geoint as geopolitical risk intensifies . At the same time, optical systems retain volume leadership, yet SAR innovation is eroding that advantage by supplying all-weather coverage and sub-hour revisit economics. Rising orbital congestion, high deployment costs, and competition from advanced drone imaging temper growth but have not altered the upward trajectory of the commercial satellite imaging market.
Global Commercial Satellite Imaging Market Trends and Insights
Increasing Requirement for Efficient Monitoring of Vast Land Areas
Global infrastructure expansion and resource extraction make wide-area surveillance economically unviable with ground methods. Planet Labs' fleet of 200-plus Doves delivers daily 3-5 m imagery, enabling automated change-detection that has doubled mineral discovery rates in new-entrant exploration portfolios. Agencies blend commercial data with open sources to track land-use shifts, which is particularly valuable in regions that lack dense in-situ networks. Automated algorithms now flag illegal mining and deforestation within hours, opening growth avenues for the commercial satellite imaging market.
Rising Smart-City Initiatives
Asia-Pacific municipal authorities integrate satellite imagery with IoT sensors and edge computing to manage traffic, energy, and climate resilience programs. documents 27 city-level case studies where geospatial tools underpinned urban sustainability outcomes. Germany's DLR exports AI-driven urban-footprint products, while the Asian Development Bank finances satellite connectivity to safeguard digital-inclusion goals. These projects funnel recurrent demand into the commercial satellite imaging market.
High-Resolution Airborne Alternatives
Centimeter-grade drone imagery undercuts satellites for localized tasks such as construction tracking and precision farming. Real-time processing onboard UAVs narrows the speed gap, prompting satellite operators to emphasize wide-area, cross-border coverage and standardized products.
Other drivers and restraints analyzed in the detailed report include:
- Big-Data & Imagery Analytics Adoption
- Mandatory Methane-Emissions Verification via Satellite
- Capital-Intensive Constellation Deployment & Launch Costs
For complete list of drivers and restraints, kindly check the Table Of Contents.
Segment Analysis
Geospatial mapping generated 31.7% of 2024 revenues, underscoring its foundational place in the commercial satellite imaging market size. Long-duration mapping contracts create predictable cash flow and drive repeat business, particularly for national mapping agencies. Disaster Management, growing at 13.5% CAGR, gains momentum from climate-linked emergencies that need near-instant imagery for situational awareness. The commercial satellite imaging market benefits as automated change-detection algorithms transform post-event analysis. Natural resource management and security surveillance adopt AI-enhanced monitoring to comply with ESG rules and geopolitical intelligence needs. Construction applications integrate imagery with BIM systems for project governance, while research organizations leverage democratized data access to study environmental change.
The segment outlook aligns with widening compliance obligations and the maturation of analytics platforms that monetize derivative intelligence rather than raw pixels. As disaster frequency rises, insurers and governments procure subscription-based alert services, lifting the commercial satellite imaging industry's recurring revenue base. Cross-sector synergies, such as combining methane-monitoring payloads with optical imagers on single buses, encourage platform diversification and amplify utilization rates across the commercial satellite imaging market.
Government agencies captured 39.8% of spending in 2024, reflecting entrenched needs for land management, climate monitoring, and infrastructure oversight. The US National Geospatial-Intelligence Agency's USD 200 million Luno B award exemplifies sustained procurement. Military and defense budgets, however, are projected to rise fastest at 12.8% CAGR, driven by the quest for real-time tactical geoint. notes the Pentagon's integration of commercial imagery to complement classified assets, accelerating adoption inside secure networks .
Transportation & logistics entities increasingly rely on space-based data for route optimization, while energy firms need continuous monitoring to satisfy emissions-reporting mandates. Forestry & agriculture deploy precision-ag platforms that fuse multispectral data with weather analytics, broadening the commercial satellite imaging market's agricultural footprint. Academic and financial institutions adopt satellite derivatives for risk analytics, diversifying the end-user mix and reinforcing market resilience.
The Commercial Satellite Imaging Market is Segmented by Application (Geospatial Data Acquisition and Mapping, and More), by End-User Vertical (Government, Construction, and More), by Imaging Type (Optical (Multispectral/Panchromatic and More), by Spatial Resolution (<=0. 3 M (Very-High), and More), by Orbit Class (Low-Earth Orbit (LEO) and More), and by Geography. The Market Forecasts are Provided in Terms of Value (USD).
Geography Analysis
North America generated 38.6% of 2024 revenue, anchored by defense outlays and established commercial operators. Maxar's USD 359 million portal contract illustrates enduring government demand . The region's deep venture ecosystem funds AI-first analytics firms, sustaining innovation in the commercial satellite imaging market. Canada's Canadarm3 and Globalstar contracts highlight domestic space manufacturing momentum, reinforcing supply-chain sovereignty for North America's operators.
Asia-Pacific is the fastest-growing region at 12.9% CAGR through 2030 as governments pursue smart-city and climate-resilience agendas. India aims for USD 47.3 billion in space revenue by 2032, yet funding dipped 55% in 2024, underscoring capital-access challenges. China accelerates commercial launch cadence and sensor innovation, though market data remain opaque. Japan leverages satellite assets for disaster management and participates in Quad collaboration on space situational awareness . These strategic initiatives funnel procurement into the commercial satellite imaging market.
Europe combines Copernicus data policy with industrial primes such as Airbus to maintain a strong position. The EUSPA market report cites growing EO revenue in renewable-energy and fisheries monitoring verticals. SES's USD 3.1 billion Intelsat merger boosts in-region capacity but still trails Starlink's LEO scale. Middle East-Africa turn to commercial SAR for water-security and infrastructure projects, while South America leverages Brazil's national program to spur local uptake. Collectively these dynamics expand global participation in the commercial satellite imaging market.
- Maxar Technologies
- Airbus Defence & Space
- Planet Labs PBC
- BlackSky Technology Inc.
- L3Harris Technologies
- ICEYE
- Capella Space
- Satellogic
- Ursa Space Systems
- European Space Imaging (EUSI)
- ImageSat International
- Galileo Group
- SpaceKnow
- SI Imaging Services
- Deimos Imaging
- GHGSat
- Spire Global
- Umbra Lab
- Earth-i
- Capella Federal
- Satellogic USA
- Orbital Insight
Additional Benefits:
- The market estimate (ME) sheet in Excel format
- 3 months of analyst support
TABLE OF CONTENTS
1 INTRODUCTION
- 1.1 Study Assumptions & Market Definition
- 1.2 Scope of the Study
2 RESEARCH METHODOLOGY
3 EXECUTIVE SUMMARY
4 MARKET LANDSCAPE
- 4.1 Market Overview
- 4.2 Market Drivers
- 4.2.1 Increasing requirement for efficient monitoring of vast land areas
- 4.2.2 Rising smart-city initiatives
- 4.2.3 Big-data & imagery analytics adoption
- 4.2.4 Mandatory methane-emissions verification via satellite (post-2025 ESG rules)
- 4.2.5 Proliferation of SAR micro-constellations enabling all-weather revisit
- 4.2.6 AI tip-and-cue tasking driving sub-hour revisit economics
- 4.3 Market Restraints
- 4.3.1 High-resolution imagery available from alternative airborne platforms
- 4.3.2 Capital-intensive constellation deployment & launch costs
- 4.3.3 Orbital-congestion & spectrum-management bottlenecks
- 4.3.4 Data-privacy regulations slowing commercial licensing
- 4.4 Value / Supply-Chain Analysis
- 4.5 Regulatory Landscape
- 4.6 Technological Outlook
- 4.7 Porters Five Forces Analysis
- 4.7.1 Bargaining Power of Buyers
- 4.7.2 Bargaining Power of Suppliers
- 4.7.3 Threat of New Entrants
- 4.7.4 Threat of Substitute Products
- 4.7.5 Intensity of Competitive Rivalry
5 MARKET SIZE & GROWTH FORECASTS (VALUE)
- 5.1 By Application
- 5.1.1 Geospatial Data Acquisition & Mapping
- 5.1.2 Natural Resource Management
- 5.1.3 Surveillance & Security
- 5.1.4 Conservation & Research
- 5.1.5 Construction & Development
- 5.1.6 Disaster Management
- 5.1.7 Defense & Intelligence
- 5.2 By End-User
- 5.2.1 Government
- 5.2.2 Construction
- 5.2.3 Transportation & Logistics
- 5.2.4 Military & Defense
- 5.2.5 Energy
- 5.2.6 Forestry & Agriculture
- 5.2.7 Other End-Users
- 5.3 By Imaging Type
- 5.3.1 Optical (Multispectral/Panchromatic)
- 5.3.2 Radar / SAR
- 5.3.3 Hyperspectral
- 5.3.4 Thermal
- 5.4 By Spatial Resolution
- 5.4.1 ?0.3 m (Very-High)
- 5.4.2 0.3 m1 m (High)
- 5.4.3 1 m5 m (Medium)
- 5.4.4 >5 m (Low)
- 5.5 By Orbit Class
- 5.5.1 Low-Earth Orbit (LEO)
- 5.5.2 Medium-Earth Orbit (MEO)
- 5.5.3 Geostationary Orbit (GEO)
- 5.6 By Geography
- 5.6.1 North America
- 5.6.1.1 United States
- 5.6.1.2 Canada
- 5.6.2 South America
- 5.6.2.1 Brazil
- 5.6.2.2 Rest of South America
- 5.6.3 Europe
- 5.6.3.1 Germany
- 5.6.3.2 France
- 5.6.3.3 United Kingdom
- 5.6.3.4 Russia
- 5.6.3.5 Rest of Europe
- 5.6.4 Asia
- 5.6.4.1 China
- 5.6.4.2 India
- 5.6.4.3 Japan
- 5.6.4.4 South Korea
- 5.6.4.5 Rest of Asia
- 5.6.5 Middle East & Africa
- 5.6.5.1 Middle East
- 5.6.5.1.1 Saudi Arabia
- 5.6.5.1.2 United Arab Emirates
- 5.6.5.1.3 Turkey
- 5.6.5.2 Africa
- 5.6.5.2.1 South Africa
- 5.6.5.2.2 Rest of Africa
- 5.6.1 North America
6 COMPETITIVE LANDSCAPE
- 6.1 Market Concentration
- 6.2 Strategic Moves
- 6.3 Market Share Analysis
- 6.4 Company Profiles (includes Global level Overview, Market level overview, Core Segments, Financials as available, Strategic Information, Market Rank/Share for key companies, Products & Services, and Recent Developments)
- 6.4.1 Maxar Technologies
- 6.4.2 Airbus Defence & Space
- 6.4.3 Planet Labs PBC
- 6.4.4 BlackSky Technology Inc.
- 6.4.5 L3Harris Technologies
- 6.4.6 ICEYE
- 6.4.7 Capella Space
- 6.4.8 Satellogic
- 6.4.9 Ursa Space Systems
- 6.4.10 European Space Imaging (EUSI)
- 6.4.11 ImageSat International
- 6.4.12 Galileo Group
- 6.4.13 SpaceKnow
- 6.4.14 SI Imaging Services
- 6.4.15 Deimos Imaging
- 6.4.16 GHGSat
- 6.4.17 Spire Global
- 6.4.18 Umbra Lab
- 6.4.19 Earth-i
- 6.4.20 Capella Federal
- 6.4.21 Satellogic USA
- 6.4.22 Orbital Insight
7 MARKET OPPORTUNITIES & FUTURE OUTLOOK
- 7.1 White-space & Unmet-Need Assessment
 2025年全球卫星云端成像服务市场报告
 商业卫星成像市场(按成像模式、解析度等级、轨道等级和应用)—2025-2032 年全球预测
 商业卫星成像市场规模、份额、趋势及预测(按技术、应用、最终用户和地区),2025 年至 2033 年2025年全球商业卫星成像市场报告日本卫星影像服务市场规模、份额、趋势及预测(按应用程式、最终用户和地区),2025 年至 2033 年
 全球卫星图像资讯服务市场
 商业卫星影像市场规模(按应用、最终用户、区域范围和预测)
 2032年农业卫星影像市场预测:按农场类型、产品、部署模式、技术、应用、最终用户和地区进行的全球分析
 商业卫星图像市场规模、份额、成长分析、按产品类型、按应用、按最终用户、按地区 - 行业预测,2024-2031 年
 卫星影像的到市场规模,占有率,预测,趋势分析:各提供,各用途,各领域,各地区-2031年前的世界预测