


 |
市场调查报告书
商品编码
1850238
软体定义安全:市场占有率分析、产业趋势、统计数据和成长预测(2025-2030 年)Software Defined Security - Market Share Analysis, Industry Trends & Statistics, Growth Forecasts (2025 - 2030) |
||||||
※ 本网页内容可能与最新版本有所差异。详细情况请与我们联繫。
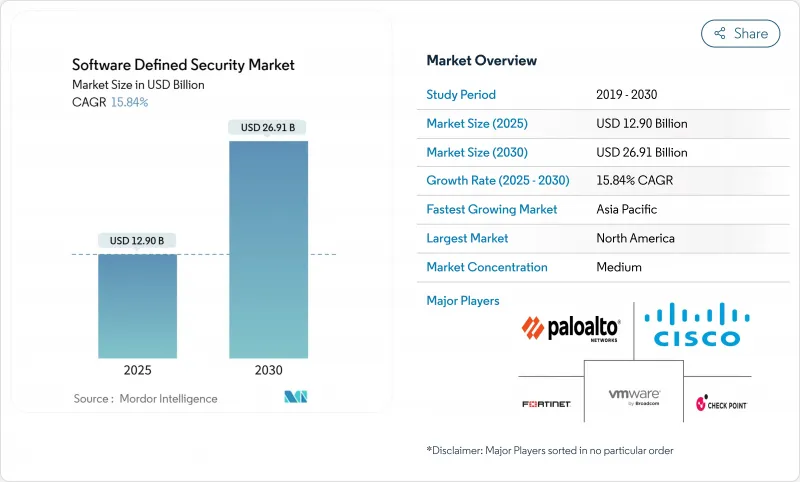
软体定义安全市场预计到 2025 年价值 129 亿美元,预计到 2030 年将成长一倍以上,达到 269.1 亿美元,复合年增长率为 15.84%。
大多数企业正从以边界为中心的控制转向可程式架构,以因应跨资料中心、多个公共云端和边缘位置的工作负载迁移。自动化策略执行缩短了事件回应週期,而零信任原则则将持续检验融入日常网路营运中。欧盟《网路弹性法案》和NIS2指令等监管期限的到来,正将可自由支配的支出转变为强制投资。同时,容器化应用的快速成长迫使安全团队采用只有软体定义方法才能提供的细粒度微隔离和执行时间保护。这些因素的共同作用,有望使软体定义安全市场在本十年末保持两位数的成长势头。
全球软体定义安全市场趋势与洞察
对快速事件回应和策略自动化的需求
平均检测时间应以分钟而非天为单位。根据联盟发布的《2025 年网路威胁指数》,58% 的勒索软体入侵始于受感染的 VPN 设备,这暴露了手动回应的限制。正因如此,企业正在采用可程式安全控制措施,当威胁情报超过设定的风险阈值时,自动隔离端点。到 2025 年,加拿大资料外洩的平均成本达到 466 万美元,受影响客户的解约率上升至 38%。自动化的软体定义策略使安全团队能够在不增加员工数量的情况下扩展规模,并使防御措施与对手保持同步。
多重云端和混合云端架构的采用率不断提高
Nutanix 报告称,目前全球 90% 的企业经营着由私有云端云和多个公共云端组成的「云智慧」组合 [nutanix.com]。这种多样性导致可见性分散,71% 的团队至少在一个环境中遇到策略盲点。软体定义安全平台透过将策略从底层基础架构中抽像出来,消除了这种分散性。统一的仪表板应用相同的控制措施,无论工作负载是在本地、AWS、Azure 还是 OCI 中运行,都能确保持续合规,同时让开发人员能够自由地在合适的位置部署应用程式。
DevSecOps人才短缺
在 O'Reilly 2024 年的调查中,38.9% 的组织认为云端安全技能是其最大的缺口。美国DevSecOps 工程师的平均年薪已高达 14 万美元,这给预算和计划进度带来了压力。许多公司正在透过託管服务提供者来填补这一缺口,扩大服务领域,但在内部采用高级功能方面却落后。
細項分析
公共云端将持续引领整体应用,到2024年将占总营收的39%。其中,纯SaaS细分市场成长最快,复合年增长率达18.20%。 IT团队,尤其是中小企业的IT团队,非常欣赏云端原生供应商提供的即时扩展和滚动更新,这些功能无需修补本地设备。随着零信任框架的成熟,大型企业也将工作负载转移到SaaS节点,以减少资本支出并加速功能采用。
虽然在需要主权和延迟的情况下,本地部署仍然必不可少,但混合设计越来越多地透过 SaaS 安全 Web 闸道路由出站流量。总而言之,这些趋势将策略控制转移到网路边缘,有利于建构多租户、弹性背板的供应商。这种转变凸显了软体定义安全市场从设备销售到订阅收益的更广泛重新定位。
网路安全将占2024年收入的40%,这反映了传统防火墙的更新週期和软体定义广域网路的部署。云端/容器安全将实现最快的成长,到2030年将以24%的复合年增长率扩张。随着开发团队将单体应用容器化化为数百个微服务,运行时控制必须随着pod的重生而立即适应,因此持续镜像扫描、存取控制钩子和服务网格加密成为采购清单上的重点。
早期采用者越来越多地将容器安全与态势管理模组捆绑在一起,这些模组可以清点 AWS、Azure 和 Google Cloud 上的错误配置。这种融合进一步模糊了工作负载和配置安全之间的界限,促使供应商将其云端原生应用程式保护平台直接整合到更广泛的软体定义安全市场套件中。
区域分析
受联邦政府积极措施的推动,北美地区占2024年网路安全总收入的38%。美国国防部在2025财年向国防资讯系统局(DISA)网路营运部门拨款5.049亿美元,用于建构零信任参考架构,该架构将扩展到承包商生态系统。总体而言,该地区的网路安全支出年增15%,这得益于白宫行政命令,该命令要求材料清单进行审核,并对整个联邦供应链进行持续监控。
欧洲则位居第二,但随着软体定义安全市场与全面立法的接轨,其发展呈现出健康的加速态势。 《网路弹性法案》将于2027年12月生效,要求製造商从产品设计之初就将安全性融入其中。诸如《数位营运弹性法案》(金融)和NIS2(关键服务)等补充措施,将类似的义务扩展到整个经济体。因此,企业正在转向可编程策略引擎,这些引擎可以即时向多个监管机构证明合规性。
亚太地区是成长的领跑者,预计到2030年复合年增长率将达到14.90%。中国、日本和韩国的製造业巨头正在推行工业4.0计划,这将使其营运技术网路面临网路威胁。各国政府正在製定产业框架,推荐微分段和零信任,并推动新的计划。印度的《数位个人资料保护法》也同样收紧了对医疗保健和电子商务参与者的监管。总体而言,这些发展将推动全球软体定义安全市场中区域份额的成长。
中东、非洲和南美洲是新的采用者,能源出口商正在启用安全设计的炼油厂控制系统,巴西金融监管机构也发布了严格的开放银行安全指南。虽然绝对商机仍然有限,但这些地区提供了高成长率,对寻求待开发区机会的云端原生供应商具有吸引力。
其他福利:
- Excel格式的市场预测(ME)表
- 3个月的分析师支持
目录
第一章 引言
- 研究假设和市场定义
- 调查范围
第二章调查方法
第三章执行摘要
第四章 市场情势
- 市场概况
- 市场驱动因素
- 对更快的事件回应和策略自动化的需求
- 多重云端和混合云端架构的采用率不断提高
- 容器/Kubernetes 安全支出激增
- 迈向零信任和 SASE 整合(报告不足)
- 人工智慧驱动的威胁狩猎减少了潜伏时间(漏报)
- 关键基础设施遭受攻击后的国家网路韧性义务(未通报)
- 市场限制
- DevSecOps人才短缺
- 旧有系统互通性问题
- 东西向微分割的隐藏(未被充分报道的)效能开销
- 单一供应商政策控制者造成的集中风险(漏报)
- 价值/供应链分析
- 监管格局
- 技术展望
- 五力分析
- 新进入者的威胁
- 买方的议价能力
- 供应商的议价能力
- 替代品的威胁
- 竞争对手之间的竞争
第五章 市场规模与成长预测
- 按组件
- 软体
- 服务
- 按部署模式
- 本地部署
- 公共云端
- 私有云端
- 混合云端
- 按安全类型
- 网路安全
- 端点安全
- 应用程式安全
- 云端/容器安全
- 其他的
- 按组织规模
- 小型企业
- 大公司
- 按最终用户
- BFSI
- 通讯/IT
- 卫生保健
- 政府和国防
- 零售与电子商务
- 能源和公共产业
- 其他的
- 按地区
- 北美洲
- 美国
- 加拿大
- 墨西哥
- 欧洲
- 英国
- 德国
- 法国
- 义大利
- 其他欧洲地区
- 亚太地区
- 中国
- 日本
- 印度
- 韩国
- 其他亚太地区
- 中东
- 以色列
- 沙乌地阿拉伯
- 阿拉伯聯合大公国
- 土耳其
- 其他中东地区
- 非洲
- 南非
- 埃及
- 其他非洲国家
- 南美洲
- 巴西
- 阿根廷
- 其他南美
- 北美洲
第六章 竞争情势
- 市场集中度
- 策略趋势
- 市占率分析
- 公司简介
- Palo Alto Networks
- Cisco Systems
- Fortinet
- Juniper Networks
- VMware(Broadcom)
- Check Point Software
- IBM
- Oracle
- Microsoft
- Trend Micro
- Huawei
- Sophos
- McAfee
- Splunk
- Illumio
- Akamai Technologies
- Netskope
- Zscaler
- Forcepoint
- Darktrace
- Proofpoint
第七章 市场机会与未来展望
The software-defined security market size is estimated at USD 12.9 billion in 2025 and is forecast to more than double to USD 26.91 billion by 2030, advancing at a 15.84% CAGR.
Most enterprises are moving away from perimeter-centric controls toward programmable architectures that follow workloads as they shift across data centers, multiple public clouds, and edge locations. Automated policy enforcement shortens incident-response cycles, while zero-trust principles embed continuous verification into everyday network operations. Regulatory deadlines such as the EU Cyber Resilience Act and the NIS2 Directive are converting discretionary spending into mandatory investments. At the same time, the rapid growth of containerized applications forces security teams to embrace granular micro-segmentation and runtime protection that only software-defined approaches can deliver. Together, these forces give the software-defined security market durable, double-digit momentum through the end of the decade.
Global Software Defined Security Market Trends and Insights
Requirement for quicker incident response and policy automation
Mean time to detection must now be measured in minutes, not days. Coalition's 2025 Cyber Threat Index found that 58% of ransomware intrusions began with compromised VPN devices, exposing the limits of manual responses. Enterprises therefore employ programmable security controls that auto-isolate endpoints once threat intelligence crosses defined risk thresholds. The financial stakes remain high: average breach costs in Canada reached USD 4.66 million and churn rates climbed to 38% among affected customers in 2025. Automated, software-defined playbooks let security teams scale without proportional head-count increases, aligning protection speed with adversary tempo.
Rising adoption of multi-cloud and hybrid cloud architectures
Nutanix reports that 90% of global organizations now run a "cloud-smart" mix of private and multiple public clouds [nutanix.com]. Such diversity fragments visibility; 71% of teams acknowledge policy blind spots in at least one environment. Software-defined security platforms resolve that fragmentation by abstracting policy from the underlying infrastructure. Unified dashboards apply identical controls regardless of whether workloads run on-premises, AWS, Azure, or OCI, ensuring continuous compliance while giving developers freedom to place applications where they perform best.
Shortage of DevSecOps talent
O'Reilly's 2024 survey shows 38.9% of organizations citing cloud security skills as their biggest gap. DevSecOps engineer salaries in the United States already average USD 140,000, pressuring budgets and project timelines. Many firms backfill the gap with managed service providers, which boosts the services segment but slows in-house adoption of advanced features.
Other drivers and restraints analyzed in the detailed report include:
- Surge in container/Kubernetes security spend
- National cyber-resilience mandates after critical-infrastructure attacks
- Legacy-system interoperability issues
For complete list of drivers and restraints, kindly check the Table Of Contents.
Segment Analysis
Public cloud continues to lead overall penetration, delivering 39% of 2024 revenue. Within that category, the SaaS-only slice is climbing fastest at an 18.20% CAGR. Smaller IT teams in particular prize the instant scaling and rolling updates that cloud-native vendors provide, since no on-premises appliances require patching. Larger enterprises also shift workloads into SaaS nodes to reduce capex and accelerate feature adoption as zero-trust frameworks mature.
On-premises deployments remain indispensable where sovereignty or latency mandates apply; however, hybrid designs increasingly route outbound traffic through SaaS secure web gateways. Combined, these trends move policy control toward the network edge and favour vendors that architect multi-tenant, elastic backplanes. The transition underscores the broader repositioning of the software defined security market from appliance sales to subscription revenue.
Network security still represents 40% of 2024 revenue, reflecting legacy firewall refresh cycles and software-defined wide-area network rollouts. The higher-growth story lies in cloud/container security, which will expand at a 24% CAGR through 2030. Development teams containerize monoliths into hundreds of microservices, so runtime controls must adapt in seconds as pods respawn. Continuous image scanning, admission-control hooks, and service-mesh encryption therefore top procurement lists.
Early adopters increasingly bundle container security with posture-management modules that inventory misconfigurations across AWS, Azure, and Google Cloud. This convergence further blurs lines between workload and configuration security, pushing vendors to integrate cloud-native application protection platforms directly into their broader software defined security market suites.
Software Defined Security Market Report is Segmented by Component (Software, Services), Deployment Model (On-Premises, Public Cloud and More), Security Type (Network Security, Endpoint Security and More), Organization Size (Small & Medium Enterprises and Large Enterprises), End User (BFSI, Telecommunications & IT and More) and Geography. The Market Forecasts are Provided in Terms of Value (USD).
Geography Analysis
North America captured 38% of 2024 revenue, underpinned by decisive federal action. The U.S. Department of Defense allocated USD 504.9 million to DISA cyber operations for fiscal 2025, with a mandate to build zero-trust reference architectures that ripple into contractor ecosystems. Corporate boards mirror that urgency: overall cybersecurity spending in the region grew 15% year over year, buoyed by the White House's executive orders that require software bills of materials and continuous monitoring across the federal supply chain.
Europe sits in second place but posts healthy acceleration as the software defined security market aligns with sweeping legislation. The Cyber Resilience Act coming into force in December 2027 obliges manufacturers to design products with security baked in from day one. Complementary measures such as the Digital Operational Resilience Act (for finance) and NIS2 (for essential services) extend similar obligations across the economy. Enterprises are therefore converging on programmable policy engines capable of proving compliance in real time to multiple supervisory bodies.
Asia-Pacific is the growth frontrunner, set to log a 14.90% CAGR through 2030. Manufacturing heavyweights in China, Japan, and South Korea pursue Industry 4.0 programs that expose operational-technology networks to internet threats. Governments respond with sector-specific frameworks that recommend micro-segmentation and zero-trust, propelling new projects. India's Digital Personal Data Protection Act similarly raises bars for healthcare and e-commerce operators. Collectively, these moves expand the regional share of the global software defined security market.
The Middle East, Africa, and South America are emerging adopters. Energy exporters commission secure-by-design refinery control systems, while Brazilian financial regulators publish stringent open-banking security guidelines. Although absolute spend remains lower, high growth rates make these geographies attractive for cloud-native vendors seeking greenfield opportunities.
- Palo Alto Networks
- Cisco Systems
- Fortinet
- Juniper Networks
- VMware (Broadcom)
- Check Point Software
- IBM
- Oracle
- Microsoft
- Trend Micro
- Huawei
- Sophos
- McAfee
- Splunk
- Illumio
- Akamai Technologies
- Netskope
- Zscaler
- Forcepoint
- Darktrace
- Proofpoint
Additional Benefits:
- The market estimate (ME) sheet in Excel format
- 3 months of analyst support
TABLE OF CONTENTS
1 INTRODUCTION
- 1.1 Study Assumptions and Market Definition
- 1.2 Scope of the Study
2 RESEARCH METHODOLOGY
3 EXECUTIVE SUMMARY
4 MARKET LANDSCAPE
- 4.1 Market Overview
- 4.2 Market Drivers
- 4.2.1 Requirement for quicker incident response and policy automation
- 4.2.2 Rising adoption of multi-cloud and hybrid cloud architectures
- 4.2.3 Surge in container/Kubernetes security spend
- 4.2.4 Shift toward zero-trust and SASE convergence (under-reported)
- 4.2.5 AI-driven threat-hunting reducing dwell time (under-reported)
- 4.2.6 National cyber-resilience mandates after critical-infrastructure attacks (under-reported)
- 4.3 Market Restraints
- 4.3.1 Shortage of DevSecOps talent
- 4.3.2 Legacy-system interoperability issues
- 4.3.3 Hidden performance overhead in east-west micro-segmentation (under-reported)
- 4.3.4 Concentration risk from single-vendor policy controllers (under-reported)
- 4.4 Value / Supply-Chain Analysis
- 4.5 Regulatory Landscape
- 4.6 Technological Outlook
- 4.7 Porters Five Forces
- 4.7.1 Threat of New Entrants
- 4.7.2 Bargaining Power of Buyers
- 4.7.3 Bargaining Power of Suppliers
- 4.7.4 Threat of Substitute Products
- 4.7.5 Intensity of Competitive Rivalry
5 MARKET SIZE & GROWTH FORECASTS (VALUE)
- 5.1 By Component
- 5.1.1 Software
- 5.1.2 Services
- 5.2 By Deployment Model
- 5.2.1 On-premises
- 5.2.2 Public Cloud
- 5.2.3 Private Cloud
- 5.2.4 Hybrid Cloud
- 5.3 By Security Type
- 5.3.1 Network Security
- 5.3.2 Endpoint Security
- 5.3.3 Application Security
- 5.3.4 Cloud / Container Security
- 5.3.5 Others
- 5.4 By Organization Size
- 5.4.1 Small and Medium Enterprises
- 5.4.2 Large Enterprises
- 5.5 By End User
- 5.5.1 BFSI
- 5.5.2 Telecommunications and IT
- 5.5.3 Healthcare
- 5.5.4 Government and Defense
- 5.5.5 Retail and eCommerce
- 5.5.6 Energy and Utilities
- 5.5.7 Others
- 5.6 By Geography
- 5.6.1 North America
- 5.6.1.1 United States
- 5.6.1.2 Canada
- 5.6.1.3 Mexico
- 5.6.2 Europe
- 5.6.2.1 United Kingdom
- 5.6.2.2 Germany
- 5.6.2.3 France
- 5.6.2.4 Italy
- 5.6.2.5 Rest of Europe
- 5.6.3 APAC
- 5.6.3.1 China
- 5.6.3.2 Japan
- 5.6.3.3 India
- 5.6.3.4 South Korea
- 5.6.3.5 Rest of APAC
- 5.6.4 Middle East
- 5.6.4.1 Israel
- 5.6.4.2 Saudi Arabia
- 5.6.4.3 United Arab Emirates
- 5.6.4.4 Turkey
- 5.6.4.5 Rest of Middle East
- 5.6.5 Africa
- 5.6.5.1 South Africa
- 5.6.5.2 Egypt
- 5.6.5.3 Rest of Africa
- 5.6.6 South America
- 5.6.6.1 Brazil
- 5.6.6.2 Argentina
- 5.6.6.3 Rest of South America
- 5.6.1 North America
6 COMPETITIVE LANDSCAPE
- 6.1 Market Concentration
- 6.2 Strategic Moves
- 6.3 Market Share Analysis
- 6.4 Company Profiles (includes Global level Overview, Market level overview, Core Segments, Financials as available, Strategic Information, Market Rank/Share for key companies, Products and Services, and Recent Developments)
- 6.4.1 Palo Alto Networks
- 6.4.2 Cisco Systems
- 6.4.3 Fortinet
- 6.4.4 Juniper Networks
- 6.4.5 VMware (Broadcom)
- 6.4.6 Check Point Software
- 6.4.7 IBM
- 6.4.8 Oracle
- 6.4.9 Microsoft
- 6.4.10 Trend Micro
- 6.4.11 Huawei
- 6.4.12 Sophos
- 6.4.13 McAfee
- 6.4.14 Splunk
- 6.4.15 Illumio
- 6.4.16 Akamai Technologies
- 6.4.17 Netskope
- 6.4.18 Zscaler
- 6.4.19 Forcepoint
- 6.4.20 Darktrace
- 6.4.21 Proofpoint
7 MARKET OPPORTUNITIES & FUTURE OUTLOOK
- 7.1 White-space and Unmet-Need Assessment
 软体定义安全市场:依安全类型、部署模式、最终使用者和组织规模划分-2026年至2032年全球市场预测
 软体定义保全 (SDSec) 的全球市场:产业分析·规模·占有率·成长·趋势·预测 (2024-2031年)