


 |
市场调查报告书
商品编码
1850243
过氧化氢:市场占有率分析、产业趋势、统计数据和成长预测(2025-2030 年)Hydrogen Peroxide - Market Share Analysis, Industry Trends & Statistics, Growth Forecasts (2025 - 2030) |
||||||
※ 本网页内容可能与最新版本有所差异。详细情况请与我们联繫。
预计到 2025 年,过氧化氢市场规模将达到 611 万吨,到 2030 年将达到 740 万吨,年复合成长率为 3.9%。
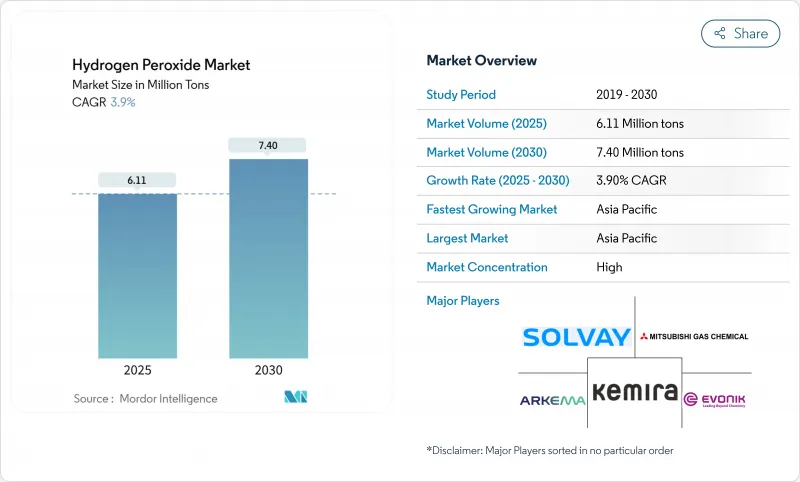
纸浆和造纸漂白业务持续推动市场成长,而半导体製造、先进污水处理和绿色航太推进剂等领域的新需求也推高了平均售价。亚太地区的产能扩张、欧洲低碳产品的推出以及全球范围内日益严格的卫生标准,都巩固了过氧化氢市场稳定的成长势头,儘管原材料价格波动和危险品分类的加强挤压了利润空间。领先的供应商正在扩大超高纯度生产线,投资现场生产技术,并与电子产品客户签订承购协议,以确保过氧化氢市场的长期供应。
全球过氧化氢市场趋势与洞察
半导体湿式製程清洗对高纯度清洁剂的需求不断增长
超高纯度度过氧化氢已成为5奈米以下半导体製造的必备原料。杂质阈值已收紧至万亿分之一级别,索尔维的INTEROX PicoPlus产品符合此规格,其阳离子污染物含量低于0.01 ppb。台湾、韩国、美国和德国的新工厂已签署多年固定供应协议,为过氧化氢市场提供了支撑。设备製造商也正在采用富含过氧化物的先进清洗方法来减少金属残留,进一步推高了单片晶圆的过氧化氢消费量。赢创和四川富华通达宣布的产能扩张计画也印证了中期市场的乐观前景。
日益严格的食品接触包装法规推动欧洲食品级过氧化氢的发展
欧盟食品安全指令现要求对无菌纸盒和宝特瓶进行更严格的灭菌处理。由于过氧化氢能迅速分解成水和氧气,因此仍是首选的灭菌剂。欧洲食品安全局已于2024年重申其安全性。美国食品药物管理局(FDA)核准在禽肉加工中使用抗菌剂,促使全球加工商统一通讯协定。短期内,过氧化氢市场将受益于这些法规。
欧盟CLP和REACH健康危害标籤会增加合规成本。
为了满足欧洲统一的危险标籤要求,过氧化物生产商必须维护详尽的安全资料表,并投资建造封闭式装卸系统。欧洲化学品管理局将过氧化氢分为若干物理和健康危害类别。合规要求包括定期更新毒理学数据、员工培训和包装升级,这增加了欧盟出口商的成本。小型供应商面临着不成比例的成本负担,限制了新进入者,并略微减缓了整体成长。
细分市场分析
到2024年,漂白应用将占过氧化氢市场的61%,这主要得益于纸浆和造纸厂对无氯增白技术的重视。用过氧化氢取代二氧化氯可以改善废水排放,即使西方印刷用纸的产量下降,也能维持基准需求。由于亮度目标已纳入产品规格,因此需求弹性不大。
消毒业务的复合年增长率 (CAGR) 最快,达到 4.37%,预计随着医院、食品加工厂和公共交通枢纽提高卫生标准,这一增长势头还将继续。 Tomi Environmental Solutions 公司报告称,2025 年第一季过氧化氢离子化设备的销量激增 42%。连续雾化系统的使用场景不断扩大,平均价格也随之上涨,使得过氧化氢市场不再局限于传统的销售模式。
工业级产品仍将是纺织、采矿和基础化学工业的主力军,预计到 2024 年将占据 41% 的市场份额。成本竞争力和供应链密度有利于工业级产品在大多数大宗应用中的发展。
高纯度材料市场成长最快,年复合成长率达 5.23%,主要得益于晶片製造商对亚 ppb 级金属含量的要求。太阳日本酸素公司推出了过氧化物 BRUTE,旨在满足这一市场需求。凭藉一座年产能达数千吨的 300 毫米晶圆厂,随着每座新厂的投产,高纯度度过氧化氢的市场规模都将进一步扩大。
区域分析
2024年,亚太地区将占据全球过氧化氢市场53%的份额,年复合成长率达4.27%。中国和印度产能的扩张正为国内造纸和电子产业提供原料。 Engro Polymer and Chemicals已在巴基斯坦投资120亿披索比索新建一家工厂,预计将于2026年运作。区域供应商享有运费优势,这有助于确保净利率。
北美在过氧化氢市场占据了很大份额。污水处理法规和绿色推进技术的研究正在推动高浓度(90%以上)过氧化氢的新应用领域。 Benchmark Space Systems公司已成功研发出一款使用高纯度度过氧化氢的22N双组元推进器,其比衝达到了290秒。此类航太的努力将支持高端市场需求,并促进国内消费。
欧洲市场规模已趋于成熟,但在永续性创新方面却处于领先地位。赢创的碳中和过氧化氢产品已通过「迈向GO2之路」计画认证,正在帮助客户减少范围3排放。儘管更严格的包装法规推动了食品级产品订单的成长,但REACH法规的合规成本却阻碍了小型进口商的参与。预计到2030年,欧洲过氧化氢市场将保持适度成长。
其他福利:
- Excel格式的市场预测(ME)表
- 3个月的分析师支持
目录
第一章 引言
- 研究假设和市场定义
- 调查范围
第二章调查方法
第三章执行摘要
第四章 市场情势
- 市场概览
- 市场驱动因素
- 半导体湿式製程清洗对高纯度清洁剂的需求不断增长
- 欧洲日益严格的食品接触包装法规推动了对食品级过氧化氢的需求。
- 扩大亚太地区综合造纸厂的化学纸浆产能
- 提高工业污水高级氧化处理中H2O2的现场生产效率
- 北美航太向绿色推进剂转型,使用HTP(>90% w/w)
- 市场限制
- 欧盟CLP和REACH健康危害标籤法规会增加合规成本。
- 原物料价格波动
- 环境法规和处置挑战
- 价值链分析
- 监理展望
- 波特五力模型
- 供应商的议价能力
- 买方的议价能力
- 新进入者的威胁
- 替代品的威胁
- 竞争程度
- 定价分析
- 贸易分析
- 供应情景
第五章 市场规模与成长预测
- 按产品功能
- 消毒剂
- 漂
- 氧化剂
- 其他产品特性(清洁剂等)
- 按年级
- 标准等级(低于35% w/w)
- 工业级(35-50%)
- 高纯度等级(50%或以上)
- 按浓度/形式
- 水溶液(70%或以下)
- 无水(90%以上)
- 粉末/颗粒状添加物(例如过硼酸盐、过碳酸盐)
- 按最终用户行业划分
- 纸浆和造纸
- 化学合成
- 污水处理
- 矿业
- 食品/饮料
- 化妆品和医疗保健
- 纺织品
- 其他终端用户产业(电子及半导体、运输、无菌包装、火箭)
- 按地区
- 亚太地区
- 中国
- 印度
- 日本
- 韩国
- 马来西亚
- 泰国
- 印尼
- 越南
- 亚太其他地区
- 北美洲
- 美国
- 加拿大
- 墨西哥
- 南美洲
- 巴西
- 阿根廷
- 哥伦比亚
- 其他南美洲
- 欧洲
- 德国
- 英国
- 法国
- 义大利
- 西班牙
- 北欧的
- 土耳其
- 俄罗斯
- 其他欧洲地区
- 中东和非洲
- 沙乌地阿拉伯
- 卡达
- 阿拉伯聯合大公国
- 南非
- 埃及
- 奈及利亚
- 其他中东和非洲地区
- 亚太地区
第六章 竞争情势
- 市场集中度
- 策略趋势
- 市占率分析
- 公司简介
- Arkema
- BASF
- Chang Chun Group
- Dow
- EnGro Corporation Limited
- Evonik Industries AG
- FMC Corporation
- Guangdong Zhongcheng Chemicals Inc.
- Gujarat Alkalies and Chemicals Limited
- Hodogaya Chemical Co., Ltd.
- Indian Peroxide Ltd.
- Kemira Oyj
- Kingboard Holdings Limited
- Luxi Chemical Group
- MITSUBISHI GAS CHEMICAL COMPANY, INC.
- National Peroxide Limited.
- NIPPON PAPER INDUSTRIES CO., LTD.
- Nouryon
- OCI ALABAMA
- PQ Corporation
- Qingdao LaSheng Co. Ltd.
- Sichuan Hebang Biotechnology Co. Ltd.
- Solvay
第七章 市场机会与未来展望
The hydrogen peroxide market stands at 6.11 million tons in 2025 and is projected to reach 7.40 million tons by 2030, registering a 3.9% CAGR.
Momentum continues to come from pulp and paper bleaching, but semiconductor fabrication, advanced wastewater treatment, and green aerospace propellants are adding new demand layers that lift average selling prices. Capacity additions in Asia-Pacific, low-carbon product launches in Europe, and stricter global hygiene protocols are reinforcing a stable growth runway even as feedstock price swings and tighter hazard classifications temper profit margins. Leading suppliers are enlarging ultra-pure production lines, investing in on-site generation technologies, and signing offtake agreements with electronics customers to secure long-term volumes in the hydrogen peroxide market.
Global Hydrogen Peroxide Market Trends and Insights
Growing Demand for High-Purity Grades in Semiconductor Wet-Process Cleaning
Ultra-high-purity hydrogen peroxide is now indispensable in sub-5 nm semiconductor production. Impurity thresholds have tightened to parts-per-trillion levels, and Solvay's INTEROX PicoPlus meets those specifications with cationic contaminants below 0.01 ppb. New fabs in Taiwan, South Korea, the United States, and Germany are signing multi-year supply agreements that lock in offtake volumes, underpinning the hydrogen peroxide market. Equipment makers are also adopting peroxide-rich advanced cleans that reduce metallic residues, further expanding per-wafer consumption. Capacity additions announced by Evonik and Fuhua Tongda in Sichuan underscore the bullish medium-term outlook.
Stricter Food-Contact Packaging Regulations Driving Food-Grade H2O2 in Europe
EU food-safety directives now require more rigorous sterilization of aseptic cartons and PET bottles. Hydrogen peroxide remains the preferred agent thanks to rapid decomposition into water and oxygen. The European Food Safety Authority reaffirmed its safety in 2024. FDA approvals for antimicrobial use in poultry processing are influencing global processors to harmonize protocols. As a result of these policies, packaging lines have begun integrating vaporized hydrogen peroxide units, driving increased demand for food-grade solutions, particularly in dairies and juice plants.The hydrogen peroxide market benefits from this regulatory tail-wind in the near term.
Health-Hazard Labelling under EU CLP and REACH Creating Compliance Costs
Peroxide producers must maintain extensive safety data sheets and invest in closed loading systems to meet Europe's harmonized hazard statements. The European Chemicals Agency lists hydrogen peroxide under several physical and health hazard categories. Compliance requires periodic toxicology updates, employee training, and upgraded packaging, adding overhead for exporters into the bloc. Smaller suppliers face disproportionate cost burdens, limiting new entrants and marginally slowing overall growth.
Other drivers and restraints analyzed in the detailed report include:
- Expansion of Chemical Pulp Capacity in APAC Integrated Mills
- Increasing On-Site H2O2 Generation for Advanced Oxidation in Industrial Wastewater
- Volatility of Feedstock Prices
For complete list of drivers and restraints, kindly check the Table Of Contents.
Segment Analysis
Bleaching applications accounted for 61% of the hydrogen peroxide market in 2024, anchored by pulp and paper mills that value chlorine-free brightness gains. Replacement of elemental chlorine dioxide with peroxide improves effluent profiles, sustaining baseline demand even as Western print paper declines. Demand elasticity is modest because brightness targets are codified in product specifications.
Disinfection posted the fastest 4.37% CAGR and is forecast to keep climbing as hospitals, food plants, and mass-transit hubs maintain heightened sanitation standards. TOMI Environmental Solutions reported a 42% sales jump in Q1 2025 for ionized peroxide devices. Continuous-mist delivery systems broaden use cases and lift average prices, expanding the hydrogen peroxide market beyond legacy volumes.
The industrial grade segment delivered 41% share in 2024 and remains the workhorse for textiles, mining, and basic chemicals. Cost competitiveness and supply chain density favor industrial grade in most bulk applications.
High-purity material is scaling fastest at 5.23% CAGR as chipmakers specify sub-ppb metal levels. Taiyo Nippon Sanso launched BRUTE Peroxide to serve this niche. A single 300 mm fab can offtake several kilotons annually, so each new facility adds tangible volume to the hydrogen peroxide market size for high-purity products.
The Hydrogen Peroxide Market Report Segments the Industry by Product Function (Disinfectant, Bleaching, Oxidant, and More), Grade (Standard Grade, Industrial Grade, and More), Concentration/Form (Aqueous Solution, Anhydrous, and More), End-User Industry (Pulp and Paper, Chemical Synthesis, Mining, and More), and Geography (Asia-Pacific, North America, Europe, South America, and Middle East and Africa).
Geography Analysis
Asia-Pacific controlled 53% of the hydrogen peroxide market 2024 and is rising at a 4.27% CAGR. Capacity additions in China and India feed the domestic paper and electronics sectors. Engro Polymer and Chemicals invested PKR 12 billion in a new Pakistani plant scheduled for 2026 start-up. Regional suppliers enjoy freight advantages that safeguard margins.
North America holds a significant slice of the hydrogen peroxide market. Wastewater regulations and green propulsion research spur new endpoints for concentrated (more than 90%) grades. Benchmark Space Systems demonstrated a 22 N bipropellant thruster using high-test peroxide that reached a 290-second specific impulse. These aerospace trials anchor premium demand and boost domestic consumption.
Europe exhibits mature volumes but leads sustainability innovation. Evonik's carbon-neutral peroxide, certified under the Way to GO2 program, helps customers cut Scope 3 emissions. Stricter packaging rules raise food-grade orders, while REACH compliance costs restrain smaller importers. The hydrogen peroxide market size for Europe is projected to move modestly yet steadily through 2030.
- Arkema
- BASF
- Chang Chun Group
- Dow
- EnGro Corporation Limited
- Evonik Industries AG
- FMC Corporation
- Guangdong Zhongcheng Chemicals Inc.
- Gujarat Alkalies and Chemicals Limited
- Hodogaya Chemical Co., Ltd.
- Indian Peroxide Ltd.
- Kemira Oyj
- Kingboard Holdings Limited
- Luxi Chemical Group
- MITSUBISHI GAS CHEMICAL COMPANY, INC.
- National Peroxide Limited.
- NIPPON PAPER INDUSTRIES CO., LTD.
- Nouryon
- OCI ALABAMA
- PQ Corporation
- Qingdao LaSheng Co. Ltd.
- Sichuan Hebang Biotechnology Co. Ltd.
- Solvay
Additional Benefits:
- The market estimate (ME) sheet in Excel format
- 3 months of analyst support
TABLE OF CONTENTS
1 Introduction
- 1.1 Study Assumptions and Market Definition
- 1.2 Scope of the Study
2 Research Methodology
3 Executive Summary
4 Market Landscape
- 4.1 Market Overview
- 4.2 Market Drivers
- 4.2.1 Growing Demand for High-Purity Grades in Semiconductor Wet-Process Cleaning
- 4.2.2 Stricter Food-Contact Packaging Regulations Driving Food-Grade H2O2 in the Europe
- 4.2.3 Expansion of Chemical Pulp Capacity in APAC Integrated Mills
- 4.2.4 Increasing On-Site H2O2 Generation for Advanced Oxidation in Industrial Wastewater
- 4.2.5 Aerospace Shift toward Green Propellants Using HTP (>90 % w/w) in North America
- 4.3 Market Restraints
- 4.3.1 Health-Hazard Labelling under EU CLP and REACH Creating Compliance Costs
- 4.3.2 Volatility of Feedstock Prices
- 4.3.3 Environmental Regulations and Disposal Challenges
- 4.4 Value Chain Analysis
- 4.5 Regulatory Outlook
- 4.6 Porter's Five Forces
- 4.6.1 Bargaining Power of Suppliers
- 4.6.2 Bargaining Power of Buyers
- 4.6.3 Threat of New Entrants
- 4.6.4 Threat of Substitutes
- 4.6.5 Degree of Competition
- 4.7 Pricing Analysis
- 4.8 Trade Analysis
- 4.9 Supply Scenerio
5 Market Size and Growth Forecasts (Volume)
- 5.1 By Product Function
- 5.1.1 Disinfectant
- 5.1.2 Bleaching
- 5.1.3 Oxidant
- 5.1.4 Other Product Function (Cleaning Agent, etc.)
- 5.2 By Grade
- 5.2.1 Standard Grade (less than 35 % w/w)
- 5.2.2 Industrial Grade (35-50 %)
- 5.2.3 High-Purity Grade (more than 50 %)
- 5.3 By Concentration / Form
- 5.3.1 Aqueous Solution (less than or equal to 70 %)
- 5.3.2 Anhydrous (more than 90 %)
- 5.3.3 Powder / Granular Adducts (e.g., Perborate, Percarbonate)
- 5.4 By End-user Industry
- 5.4.1 Pulp and Paper
- 5.4.2 Chemical Synthesis
- 5.4.3 Wastewater Treatment
- 5.4.4 Mining
- 5.4.5 Food and Beverage
- 5.4.6 Cosmetics and Healthcare
- 5.4.7 Textiles
- 5.4.8 Other End-user Industries (Electronics and Semiconductors, Transportation, Aseptic Packaging, Rocketry)
- 5.5 By Geography
- 5.5.1 Asia-Pacific
- 5.5.1.1 China
- 5.5.1.2 India
- 5.5.1.3 Japan
- 5.5.1.4 South Korea
- 5.5.1.5 Malaysia
- 5.5.1.6 Thailand
- 5.5.1.7 Indonesia
- 5.5.1.8 Vietnam
- 5.5.1.9 Rest of Asia-Pacific
- 5.5.2 North America
- 5.5.2.1 United States
- 5.5.2.2 Canada
- 5.5.2.3 Mexico
- 5.5.3 South America
- 5.5.3.1 Brazil
- 5.5.3.2 Argentina
- 5.5.3.3 Colombia
- 5.5.3.4 Rest of South America
- 5.5.4 Europe
- 5.5.4.1 Germany
- 5.5.4.2 United Kingdom
- 5.5.4.3 France
- 5.5.4.4 Italy
- 5.5.4.5 Spain
- 5.5.4.6 Nordic
- 5.5.4.7 Turkey
- 5.5.4.8 Russia
- 5.5.4.9 Rest of Europe
- 5.5.5 Middle East and Africa
- 5.5.5.1 Saudi Arabia
- 5.5.5.2 Qatar
- 5.5.5.3 United Arab Emirates
- 5.5.5.4 South Africa
- 5.5.5.5 Egypt
- 5.5.5.6 Nigeria
- 5.5.5.7 Rest of Middle East and Africa
- 5.5.1 Asia-Pacific
6 Competitive Landscape
- 6.1 Market Concentration
- 6.2 Strategic Moves
- 6.3 Market Share Analysis
- 6.4 Company Profiles {(includes Global level Overview, Market level overview, Core Segments, Financials as available, Strategic Information, Market Rank/Share, Products and Services, Recent Developments)}
- 6.4.1 Arkema
- 6.4.2 BASF
- 6.4.3 Chang Chun Group
- 6.4.4 Dow
- 6.4.5 EnGro Corporation Limited
- 6.4.6 Evonik Industries AG
- 6.4.7 FMC Corporation
- 6.4.8 Guangdong Zhongcheng Chemicals Inc.
- 6.4.9 Gujarat Alkalies and Chemicals Limited
- 6.4.10 Hodogaya Chemical Co., Ltd.
- 6.4.11 Indian Peroxide Ltd.
- 6.4.12 Kemira Oyj
- 6.4.13 Kingboard Holdings Limited
- 6.4.14 Luxi Chemical Group
- 6.4.15 MITSUBISHI GAS CHEMICAL COMPANY, INC.
- 6.4.16 National Peroxide Limited.
- 6.4.17 NIPPON PAPER INDUSTRIES CO., LTD.
- 6.4.18 Nouryon
- 6.4.19 OCI ALABAMA
- 6.4.20 PQ Corporation
- 6.4.21 Qingdao LaSheng Co. Ltd.
- 6.4.22 Sichuan Hebang Biotechnology Co. Ltd.
- 6.4.23 Solvay
7 Market Opportunities and Future Outlook
- 7.1 White-Space and Unmet-Need Assessment
- 7.2 Newer Opportunities for Hydrogen Peroxide in Wastewater Treatment
 2026年全球过氧化氢市场报告
 过氧化氢市场 - 全球产业规模、份额、趋势、机会及预测(按等级、类型、应用、地区和竞争格局划分,2021-2031年)
 日本过氧化氢市场报告(按应用、最终用途和地区划分,2026-2034年)
 过氧化氢市场规模、份额和成长分析(按等级、功能、应用和地区划分)-2026-2033年产业预测
 过氧化氢:全球市占率及排名、总收入及需求预测(2025-2031年)半导体的高纯度度过氧化氢:2025-2031年全球市占率排名、总销售额和需求预测
 过氧化氢市场(依最终用途、等级、浓度、形式和分销管道)—2025-2032 年全球预测
 全球半导体高纯度度过氧化氢市场:市场占有率和排名、总销售量和需求预测(2025-2031)
 2021-2031年亚太地区过氧化氢消毒灭菌市场报告:范围、细分、动态和竞争分析
 2021-2031年欧洲过氧化氢消毒灭菌市场报告:范围、细分、动态和竞争分析