


 |
市场调查报告书
商品编码
1850258
虚拟化安全:市场占有率分析、产业趋势、统计数据和成长预测(2025-2030 年)Virtualization Security - Market Share Analysis, Industry Trends & Statistics, Growth Forecasts (2025 - 2030) |
||||||
※ 本网页内容可能与最新版本有所差异。详细情况请与我们联繫。
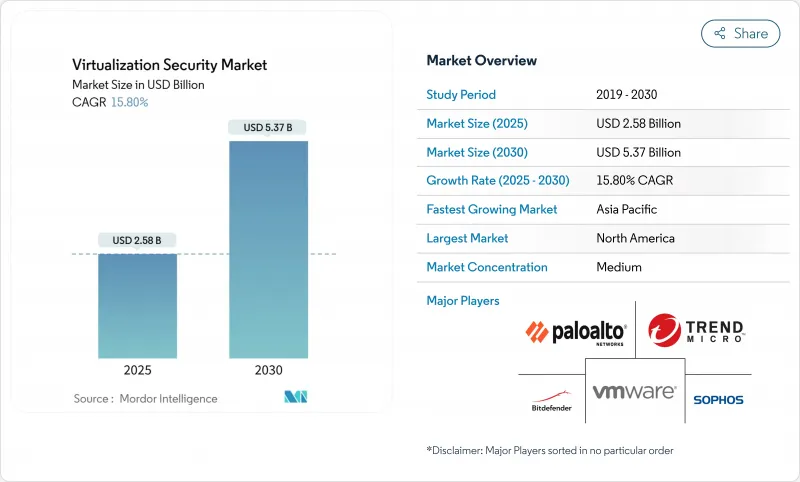
预计到 2025 年,虚拟化安全市场规模将达到 25.8 亿美元,到 2030 年将达到 53.7 亿美元,预测期(2025-2030 年)的复合年增长率为 15.80%。
混合云端云和多重云端部署、厂商平台整合以及机密运算的日益普及,使得可扩展控制的需求持续高涨。博通与 VMware 的整合表明,捆绑式私有云端订阅如何能够提升收益和利润率,也印证了企业对统一技术堆迭的偏好。同时,人工智慧驱动的攻击面发现将微隔离从可选附加元件功能提升为基本要求。诸如英特尔 VT-rp 之类的硬体辅助防御技术表明,随着威胁行为者将目标对准虚拟机器管理程式的记忆体转换路径,晶片创新正成为虚拟化安全市场的重要组成部分。
全球虚拟化安全市场趋势与洞察
混合云和多重云端采用激增
博通预测 VMware Cloud Foundation 在 2024 财年的营收将达到 215 亿美元,这表明客户需要一个能够跨越私有云端云和公共云端的单一控制平面。随着工作负载在不同环境间迁移,东西向可视性变得与边界防御同等重要。 Azure 机密虚拟机器展示了可信任执行环境如何在保持使用中加密的同时实现无缝迁移。以身分为中心和零信任模型取代了传统的边界区域划分,因为策略必须针对每个工作负载而非每个子网路执行。付费使用制确保了即使预算紧张,现代化计划也不会停滞不前。
严格的资料保护条例(GDPR、CCPA、DPDPA)
印度的新《资料保护与隐私法案》(DPDPA) 规定了明确的用途限制和跨境传输限制,这些都必须纳入虚拟化蓝图。马来西亚和越南也有类似的规定,要求提供审核追踪和强化密钥管治。医疗保健系统正在采用符合 HIPAA 标准的虚拟工作空间,以防止电子健康资讯 (ePHI) 储存在个人装置上,同时确保远距临床医生能够安全地工作。由于违规的金额已超过许可费用,虚拟化安全市场正在将隐私设计原则融入所有版本中。
专业安防设备的初始成本很高
KubeVirt 和 OpenShift 被认为是比传统 vSphere 授权更具成本效益的替代方案。调查显示,78% 的中小企业没有为其虚拟伺服器安装防毒软体,48% 的企业因预算限製而没有合适的防火墙。可信任晶片的供应中断正在推高设备成本并延缓更新换代週期。
細項分析
到2024年,解决方案将占据虚拟化安全市场份额的64.2%。 Palo Alto Networks的下一代安全产品年度经常性收入(ARR)将成长34%,达到48亿美元,这清楚地表明平台化正受到买家的青睐。服务也将延续这一成长势头,以19.1%的复合年增长率成长,因为复杂的混合架构需要第三方专业知识。像Fortinet这样的供应商正在将收购的产品(例如Lacework)整合到一个统一的架构中,从而减少工具的分散性,并促使客户签订更长期的合约。因此,市场区隔倾向于将CNAPP、微隔离和零信任网路存取整合到单一授权中的捆绑产品。
中小企业受益于SaaS消费模式,这种模式透过免除前期设备成本和人员负担,实现了服务的普及化。因此,服务提供者正瞄准这个尚未被广泛采用的细分市场,提供现成的部署方案和月度订阅定价模式。
由于硬体/伺服器虚拟化在隔离虚拟机器方面发挥基础性作用,预计到 2024 年,其市场份额将保持在 46.3%。英特尔 VT-rp 技术体现了硅层安全加固的概念,它能够阻止分页结构篡改并加强虚拟机管理程式信任边界,而思科 Hypershield 等原生 AI 架构则在分散式 Pod 中整合了核心级策略执行机制。随着 OT 工厂将感测器和 PLC 虚拟化,需要确定性且安全的流量,网路层虚拟化安全市场规模将进一步扩大。
虚拟化安全市场按元件(解决方案和服务)、虚拟化层(硬体/伺服器虚拟化、应用程式虚拟化等)、部署类型(本地部署、私有云端等)、最终用户产业(IT 和电信、银行、金融服务和保险、医疗保健和生命科学等)、组织规模(大型企业和中小企业)以及地区进行细分。
区域分析
预计到2024年,北美地区的营收将占全球总营收的35.26%,这主要得益于零信任架构的早期应用以及HIPAA和CCPA等严格的产业法规。为了缩短回馈週期并加快功能交付速度,供应商正将研发和通路生态系统集中到美国。
亚太地区是高速成长的引擎,预计到2030年将以每年18.1%的速度成长。印度的《资料保护和个人资料保护法》(DPDPA)以及马来西亚严格的资料负责人要求也将推动中型企业采用符合审核要求的虚拟化技术。中国、越南和泰国的製造业丛集将实现本地工作负载的虚拟化,并推动边缘安全产品的出货量成长。
欧洲在 GDPR 的指导下继续稳步前进,Schrems II 裁决促使人们更加关注机密运算证书,以满足数据传输要求,而海湾合作委员会国家正在将石油收入投入智慧城市和电子政府计划,并依靠安全的虚拟化云端。
其他福利:
- Excel格式的市场预测(ME)表
- 3个月的分析师支持
目录
第一章 引言
- 研究假设和市场定义
- 调查范围
第二章调查方法
第三章执行摘要
第四章 市场情势
- 市场概况
- 市场驱动因素
- 混合云端和多重云端采用率激增
- 严格的资料保护条例(GDPR、CCPA、DPDPA)
- 边缘资料中心虚拟机器和容器工作负载的爆炸性成长
- 虚拟机器管理程式许可证价格上涨推动开放原始码机器管理程式的发展
- 人工智慧驱动的攻击面侦测推动了对微隔离的需求
- 机密运算认证成为采购标准
- 市场限制
- 专业安防设备的前期成本很高
- 缺乏熟练的虚拟安全工程师
- 虚拟机器激增使零信任部署变得复杂
- 量子就绪加密货币溢价减缓购买週期
- 产业价值链分析
- 监管格局
- 技术展望
- 产业吸引力-波特五力分析
- 新进入者的威胁
- 买方的议价能力
- 供应商的议价能力
- 替代品的威胁
- 竞争对手之间的竞争
- 影响市场的宏观经济因素
第五章 市场规模及成长预测(数值)
- 按组件
- 解决方案
- 服务
- 透过虚拟化层
- 硬体/伺服器虚拟化
- 应用程式虚拟化
- 网路和SD-WAN虚拟化
- 储存虚拟化
- 依部署方式
- 本地部署
- 私有云端
- 公共云端
- 混合云端
- 按最终用户产业
- 资讯科技和通讯
- BFSI
- 医疗保健和生命科学
- 政府和国防
- 零售与电子商务
- 製造业
- 其他终端用户产业
- 按组织规模
- 大公司
- 小型企业
- 按地区
- 北美洲
- 美国
- 加拿大
- 墨西哥
- 南美洲
- 巴西
- 阿根廷
- 智利
- 其他南美
- 欧洲
- 德国
- 英国
- 法国
- 义大利
- 西班牙
- 俄罗斯
- 其他欧洲地区
- 亚太地区
- 中国
- 印度
- 日本
- 韩国
- 马来西亚
- 新加坡
- 澳洲
- 其他亚太地区
- 中东和非洲
- 中东
- 阿拉伯聯合大公国
- 沙乌地阿拉伯
- 土耳其
- 其他中东地区
- 非洲
- 南非
- 奈及利亚
- 其他非洲国家
- 北美洲
第六章 竞争情势
- 市场集中度
- 策略趋势
- 市占率分析
- 公司简介
- VMware Inc.(Broadcom Inc.)
- Trend Micro Inc.
- Sophos Ltd.
- Bitdefender LLC
- Palo Alto Networks Inc.
- Fortinet Inc.
- Check Point Software Technologies Ltd.
- Cisco Systems Inc.
- Juniper Networks Inc.
- Kaspersky Lab
- McAfee LLC
- IBM Corporation
- Microsoft Corporation
- Citrix Systems Inc.
- Red Hat Inc.
- Nutanix Inc.
- Parallels International GmbH
- Sangfor Technologies Inc.
- Guardicore(Akamai Technologies)
- Illumio Inc.
- Acronis International GmbH
- Symantec Enterprise Division(Broadcom)
- Hillstone Networks
- Radware Ltd.
- Tenable Holdings Inc.
第七章 市场机会与未来趋势
- 閒置频段与未满足需求评估
The Virtualization Security Market size is estimated at USD 2.58 billion in 2025, and is expected to reach USD 5.37 billion by 2030, at a CAGR of 15.80% during the forecast period (2025-2030).
Rising hybrid and multi-cloud rollouts, vendor platform consolidation, and confidential-computing adoption keep demand for scalable controls high. Broadcom's integration of VMware illustrates how bundled private-cloud subscriptions can lift both revenue and margins, underscoring enterprises' preference for unified stacks. At the same time, AI-driven attack-surface discovery pushes micro-segmentation from an optional add-on to a baseline requirement. Hardware-assisted defenses, such as Intel VT-rp, show that silicon innovation is now an essential layer in the virtualization security market as threat actors target hypervisor memory translation paths.
Global Virtualization Security Market Trends and Insights
Hybrid and Multi-Cloud Adoption Surge
Broadcom lifted VMware Cloud Foundation revenue to USD 21.5 billion in fiscal 2024, proving that customers want a single control plane across private and public clouds. As workloads hop among environments, east-west visibility becomes as critical as perimeter defense. Azure Confidential VMs show how trusted execution environments can preserve encryption in use while enabling seamless migration. Identity-centric and zero-trust models now replace traditional perimeter zoning because policies have to follow each workload, not each subnet. Pay-as-you-go consumption also keeps enterprises from stalling modernization projects when budgets tighten.
Strict Data-Protection Regulations (GDPR, CCPA, DPDPA)
India's new DPDPA rules mandate explicit purpose limitation and cross-border transfer restrictions that must be embedded into virtualization blueprints. Similar mandates in Malaysia and Vietnam drive demand for built-in audit trails and encryption key governance. Healthcare systems adopt HIPAA-compliant virtual workspaces, keeping ePHI off personal devices while allowing remote clinicians to work securely. Penalties for non-compliance now outweigh license fees, so the virtualization security market embeds privacy-by-design principles into every release.
High Up-Front Cost of Specialized Security Appliances
KubeVirt and OpenShift are evaluated as cost-effective alternatives to traditional vSphere licenses, especially after Broadcom's pricing changes. Surveys show 78% of small businesses lack antivirus for virtual servers, while 48% run without proper firewalls due to budget limits. Trusted-chip supply disruptions inflate appliance costs, delaying refresh cycles.
Other drivers and restraints analyzed in the detailed report include:
- Explosive VM and Container Workload Growth in Edge Data-Centers
- AI-Driven Attack-Surface Discovery Boosting Micro-Segmentation Demand
- Shortage of Skilled Virtual-Security Engineers
For complete list of drivers and restraints, kindly check the Table Of Contents.
Segment Analysis
Solutions accounted for 64.2% of the virtualization security market share in 2024 as enterprises gravitated toward integrated suites rather than piecemeal tools. Palo Alto Networks' Next-Generation Security ARR climbed 34% to USD 4.8 billion, a clear indicator that platformization resonates with buyers. Services replicate this momentum, growing at 19.1% CAGR because intricate hybrid designs require third-party expertise. Vendors like Fortinet fold acquisitions such as Lacework into a single fabric, shrinking tool sprawl, and locking customers into longer contracts. The virtualization security market size is, therefore, skewing toward bundled offerings that combine CNAPP, micro-segmentation, and zero-trust network access in one license.
Smaller enterprises benefit from SaaS consumption patterns that remove up-front appliance costs and staffing burdens, democratizing access. As a result, service providers target this under-penetrated tier with off-the-shelf deployment blueprints and monthly subscription pricing.
Hardware/Server Virtualization retained a 46.3% share in 2024 owing to its foundational role in VM isolation. Intel VT-rp exemplifies hardening at the silicon layer, obstructing paging structure tampering and reinforcing hypervisor trust boundaries. Yet, Network and SD-WAN Virtualization will outpace all layers, registering an 18.3% CAGR as AI-native fabrics like Cisco Hypershield embed kernel-level policy enforcement across distributed pods. The virtualization security market size for network layers will widen further when OT factories virtualize sensors and PLCs, requiring deterministic but secure traffic flows.
Virtualization Security Market is Segmented by Component (Solutions and Services), Virtualization Layer (Hardware/Server Virtualization, Application Virtualization, and More), Deployment Mode (On-Premise, Private Cloud, and More), End-User Industry (IT and Telecom, BFSI, Healthcare and Life Sciences, and More), Organization Size (Large Enterprises and Small and Medium Enterprises), and Geography.
Geography Analysis
North America contributed 35.26% of revenue in 2024, sustained by early zero-trust adoption and strict sectoral mandates such as HIPAA and CCPA. Vendors concentrate R&D and channel ecosystems in the United States, shortening feedback cycles and quickening feature delivery.
Asia-Pacific is the high-velocity engine, set to grow 18.1% annually through 2030. India's DPDPA and Malaysia's stricter data officer obligations nudge even midsize firms to adopt audit-ready virtualization stacks. Manufacturing clusters across China, Vietnam, and Thailand virtualize shop-floor workloads, driving edge-security shipments.
Europe keeps a steady pace under GDPR. The Schrems II ruling amplifies interest in confidential-computing attestation to satisfy data transfer conditions. Meanwhile, GCC nations channel oil-windfall budgets into smart-city and e-government projects that rely on secure virtualized clouds, creating a nascent but strategic opportunity for specialists.
- VMware Inc. (Broadcom Inc.)
- Trend Micro Inc.
- Sophos Ltd.
- Bitdefender LLC
- Palo Alto Networks Inc.
- Fortinet Inc.
- Check Point Software Technologies Ltd.
- Cisco Systems Inc.
- Juniper Networks Inc.
- Kaspersky Lab
- McAfee LLC
- IBM Corporation
- Microsoft Corporation
- Citrix Systems Inc.
- Red Hat Inc.
- Nutanix Inc.
- Parallels International GmbH
- Sangfor Technologies Inc.
- Guardicore (Akamai Technologies)
- Illumio Inc.
- Acronis International GmbH
- Symantec Enterprise Division (Broadcom)
- Hillstone Networks
- Radware Ltd.
- Tenable Holdings Inc.
Additional Benefits:
- The market estimate (ME) sheet in Excel format
- 3 months of analyst support
TABLE OF CONTENTS
1 INTRODUCTION
- 1.1 Study Assumptions and Market Definition
- 1.2 Scope of the Study
2 RESEARCH METHODOLOGY
3 EXECUTIVE SUMMARY
4 MARKET LANDSCAPE
- 4.1 Market Overview
- 4.2 Market Drivers
- 4.2.1 Hybrid and multi-cloud adoption surge
- 4.2.2 Strict data-protection regulations (GDPR, CCPA, DPDPA)
- 4.2.3 Explosive VM and container workload growth in edge data centers
- 4.2.4 Hypervisor licence inflation pushing open-source hypervisors
- 4.2.5 AI-driven attack-surface discovery boosting micro-segmentation demand
- 4.2.6 Confidential-computing attestation becoming a procurement criterion
- 4.3 Market Restraints
- 4.3.1 High up-front cost of specialised security appliances
- 4.3.2 Shortage of skilled virtual-security engineers
- 4.3.3 VM sprawl complicating zero-trust enforcement
- 4.3.4 Quantum-ready encryption premiums delaying purchase cycles
- 4.4 Industry Value Chain Analysis
- 4.5 Regulatory Landscape
- 4.6 Technological Outlook
- 4.7 Industry Attractiveness - Porter's Five Forces Analysis
- 4.7.1 Threat of New Entrants
- 4.7.2 Bargaining Power of Buyers
- 4.7.3 Bargaining Power of Suppliers
- 4.7.4 Threat of Substitutes
- 4.7.5 Intensity of Competitive Rivalry
- 4.8 Impact of Macroeconomic Factors on the Market
5 MARKET SIZE AND GROWTH FORECASTS (VALUES)
- 5.1 By Component
- 5.1.1 Solutions
- 5.1.2 Services
- 5.2 By Virtualization Layer
- 5.2.1 Hardware/Server Virtualization
- 5.2.2 Application Virtualization
- 5.2.3 Network and SD-WAN Virtualization
- 5.2.4 Storage Virtualization
- 5.3 By Deployment Mode
- 5.3.1 On-Premise
- 5.3.2 Private Cloud
- 5.3.3 Public Cloud
- 5.3.4 Hybrid Cloud
- 5.4 By End-user Industry
- 5.4.1 IT and Telecom
- 5.4.2 BFSI
- 5.4.3 Healthcare and Life Sciences
- 5.4.4 Government and Defense
- 5.4.5 Retail and E-Commerce
- 5.4.6 Manufacturing
- 5.4.7 Other End-user Industries
- 5.5 By Organization Size
- 5.5.1 Large Enterprises
- 5.5.2 Small and Medium Enterprises (SMEs)
- 5.6 By Geography
- 5.6.1 North America
- 5.6.1.1 United States
- 5.6.1.2 Canada
- 5.6.1.3 Mexico
- 5.6.2 South America
- 5.6.2.1 Brazil
- 5.6.2.2 Argentina
- 5.6.2.3 Chile
- 5.6.2.4 Rest of South America
- 5.6.3 Europe
- 5.6.3.1 Germany
- 5.6.3.2 United Kingdom
- 5.6.3.3 France
- 5.6.3.4 Italy
- 5.6.3.5 Spain
- 5.6.3.6 Russia
- 5.6.3.7 Rest of Europe
- 5.6.4 Asia-Pacific
- 5.6.4.1 China
- 5.6.4.2 India
- 5.6.4.3 Japan
- 5.6.4.4 South Korea
- 5.6.4.5 Malaysia
- 5.6.4.6 Singapore
- 5.6.4.7 Australia
- 5.6.4.8 Rest of Asia-Pacific
- 5.6.5 Middle East and Africa
- 5.6.5.1 Middle East
- 5.6.5.1.1 United Arab Emirates
- 5.6.5.1.2 Saudi Arabia
- 5.6.5.1.3 Turkey
- 5.6.5.1.4 Rest of Middle East
- 5.6.5.2 Africa
- 5.6.5.2.1 South Africa
- 5.6.5.2.2 Nigeria
- 5.6.5.2.3 Rest of Africa
- 5.6.1 North America
6 COMPETITIVE LANDSCAPE
- 6.1 Market Concentration
- 6.2 Strategic Moves
- 6.3 Market Share Analysis
- 6.4 Company Profiles (includes Global level Overview, Market level overview, Core Segments, Financials as available, Strategic Information, Market Rank/Share for key companies, Products and Services, and Recent Developments)
- 6.4.1 VMware Inc. (Broadcom Inc.)
- 6.4.2 Trend Micro Inc.
- 6.4.3 Sophos Ltd.
- 6.4.4 Bitdefender LLC
- 6.4.5 Palo Alto Networks Inc.
- 6.4.6 Fortinet Inc.
- 6.4.7 Check Point Software Technologies Ltd.
- 6.4.8 Cisco Systems Inc.
- 6.4.9 Juniper Networks Inc.
- 6.4.10 Kaspersky Lab
- 6.4.11 McAfee LLC
- 6.4.12 IBM Corporation
- 6.4.13 Microsoft Corporation
- 6.4.14 Citrix Systems Inc.
- 6.4.15 Red Hat Inc.
- 6.4.16 Nutanix Inc.
- 6.4.17 Parallels International GmbH
- 6.4.18 Sangfor Technologies Inc.
- 6.4.19 Guardicore (Akamai Technologies)
- 6.4.20 Illumio Inc.
- 6.4.21 Acronis International GmbH
- 6.4.22 Symantec Enterprise Division (Broadcom)
- 6.4.23 Hillstone Networks
- 6.4.24 Radware Ltd.
- 6.4.25 Tenable Holdings Inc.
7 MARKET OPPORTUNITIES AND FUTURE TRENDS
- 7.1 White-Space and Unmet-Need Assessment


