


 |
市场调查报告书
商品编码
1850265
人工智慧影像识别:市场份额分析、行业趋势、统计数据和成长预测(2025-2030 年)AI Image Recognition - Market Share Analysis, Industry Trends & Statistics, Growth Forecasts (2025 - 2030) |
||||||
※ 本网页内容可能与最新版本有所差异。详细情况请与我们联繫。
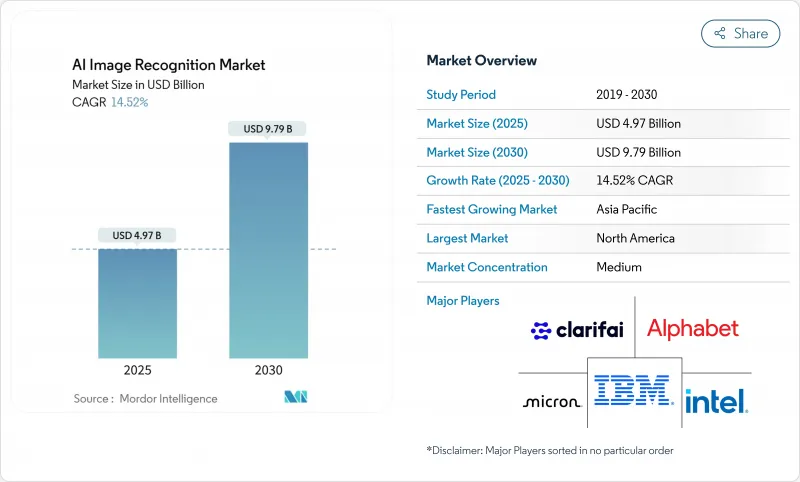
预计2025年AI影像识别市场规模为49.7亿美元,到2030年将达到97.9亿美元,复合年增长率为14.52%。
这一成长源自于企业对自动化视觉智慧的依赖,其应用范围涵盖从工厂车间到诊断实验室的各个环节。晶片成本的下降、多模态基础模型的出现以及边缘硬体的日益成熟,正在降低总体拥有成本,使大规模部署在经济上可行。供应商正将资金投入垂直整合的架构中,将晶片、软体和服务捆绑在一起,从而简化采购流程并加快部署速度。同时,合成数据引擎正在降低标註预算,并扩大先前缺乏标註图像的中型企业获取标註图像的管道。综上所述,这些趋势有望推动人工智慧影像识别市场持续保持两位数的成长。
全球人工智慧影像识别市场趋势与洞察
云端原生人工智慧应用蓬勃发展
超大规模云端服务供应商提供容器化视觉管线,可在数週内将模型从原型部署到生产环境,从而缩短製造商和零售商的价值实现时间。微软 Azure 和谷歌云端正在推出包装好的缺陷侦测蓝图,降低了机器学习人员有限的公司的进入门槛。 Kubernetes编配的推理端点仅在映像到达时才分配运算资源,与固定部署的本地丛集相比,可节省 15% 至 40% 的成本。因此,人工智慧影像识别市场受益于更快的采购週期和更广泛的用户群。
高解析度相机的普及
第五代汽车ADAS单元和8K工业感测器如今与设备端AI加速器相结合,无需网路往返即可实现低于50毫秒的推理速度。大陆集团的MFC525相机可在提供110度视场角的同时进行局部物体分类,而三星最新的神经网路引擎在消费级智慧型手机中实现了38 TOPS的运算速度。这些功能解锁了即时品管和身临其境型AR功能,从而拓展了AI影像识别市场。
资料隐私和合规障碍
欧盟人工智慧法规和加州法规都要求严格的审核追踪,导致医疗影像部署的检验成本增加高达30%。相互衝突的资料居住义务迫使采用双栈架构,这减缓了没有专门隐私团队的中型医院的采用速度。这些摩擦正在抑制人工智慧影像识别市场的成长势头。
細項分析
儘管硬体在2024年将占总收入的45.6%,但服务将以14.9%的复合年增长率超越所有其他类别。 NVIDIA和Intel的边缘摄影机和推理晶片将延迟降低到50毫秒以下,从而推动了製造工厂的棕地维修。软体,尤其是低程式码模型操作平台,正在帮助那些缺乏深厚资料科学基础的公司创建客製化的流程。同时,专业服务提供者正在建立领域优化的资料集和持续学习工作流程,以在最初的概念验证阶段之后,进一步提高生产精度。这种从关注单一产品转向关注整体成果的趋势,正在扩大整合商在人工智慧影像识别市场中的份额。
医院、银行和国防机构必须将影像保存在本地防火墙内,这导致2024年本地部署系统数量增加了68.7%。矿山、船舶和远端工厂等边缘场景也体现了这种偏好,因为这些场景的间歇性连接使得云端往返成为不可能。儘管如此,随着弹性GPU池能够处理大量季节性或突发性影像管线,云工作负载仍以16.7%的复合年增长率成长。混合拓扑结构将边缘预处理与云端重训练相结合,使企业能够集中利用百亿亿次级资料集,同时在边缘协调推理。这种混合模式既能享受超大规模资料中心的经济效益,又能保持合规性,进而推动人工智慧影像识别市场的长期成长。
区域分析
预计到2024年,北美将占全球收入的27.8%,这得益于其密集的资金筹措生态系统和国内晶片製造项目,例如台积电在亚利桑那州投资1,650亿美元的园区。企业併购,例如Meta对Scale AI148亿美元的投资,正在推动该地区的研发步伐。政府为增强半导体产业的韧性而提供的诱因也进一步支持了美国和加拿大的AI影像识别市场。
在欧洲严格的人工智慧法律法规的推动下,人工智慧技术的应用正缓慢但稳定地推进。德国重工业巨头正将人工智慧概念融入自动化组装领域,而法国新兴企业则在GDPR的保护下不断完善临床决策支援系统。投资既谨慎又目标明确,优先考虑那些能够展现透明度和消除偏见能力的供应商。这种严谨的态度正在影响整个人工智慧影像识别市场的解决方案设计。
亚太地区将达到最高的复合年增长率,达到15.9%。中国已拨出超过700亿美元的多年预算用于智慧城市和监控网路建设。日本650亿美元的半导体计画以及韩国在HBM记忆体领域的领先地位,将建构一个垂直整合的供应链。印度的开发者群体将以具有竞争力的价格提供全球模型调优服务,共同加速人工智慧影像识别市场的发展。
其他福利:
- Excel格式的市场预测(ME)表
- 3个月的分析师支持
目录
第一章 引言
- 研究假设和市场定义
- 调查范围
第二章调查方法
第三章执行摘要
第四章 市场情势
- 市场概况
- 市场驱动因素
- 云端原生人工智慧采用率的激增
- 高解析度相机的普及
- 零售损失预防措施
- 智慧城市和监控基础设施的扩展
- 合成资料管道显着降低标籤成本
- 卫星图像公司开放原始码标籤的资料集
- 市场限制
- 资料隐私和合规障碍
- 特定领域人力资源短缺
- GPU供应链的地缘政治因素加剧了资本投资风险。
- 有偏见的演算法会增加法律风险
- 供应链分析
- 监管格局
- 技术展望(边缘推理与云推理)
- 波特五力模型
- 买方的议价能力
- 供应商的议价能力
- 新进入者的威胁
- 替代品的威胁
- 竞争程度
- 宏观经济因素评估
第五章 市场规模与成长预测
- 按组件
- 硬体
- 软体
- 服务
- 按部署模型
- 云
- 本地部署
- 按用途
- 影像分类
- 物体侦测与追踪
- 脸部辨识
- 工业检测
- 医学影像
- 其他利基应用
- 按最终用户产业
- 车
- BFSI
- 医疗保健提供者和医疗技术
- 零售与电子商务
- 安全和监控整合商
- 製造业
- 其他(农业、能源等)
- 按地区
- 北美洲
- 美国
- 加拿大
- 墨西哥
- 南美洲
- 巴西
- 阿根廷
- 其他南美
- 欧洲
- 德国
- 英国
- 法国
- 义大利
- 西班牙
- 其他欧洲地区
- 亚太地区
- 中国
- 日本
- 印度
- 韩国
- 澳洲
- 其他亚太地区
- 中东和非洲
- 中东
- 沙乌地阿拉伯
- 阿拉伯聯合大公国
- 土耳其
- 其他中东地区
- 非洲
- 南非
- 奈及利亚
- 埃及
- 其他非洲国家
- 北美洲
第六章 竞争情势
- 市场集中度
- 策略趋势
- 市占率分析
- 公司简介
- Google(Alphabet)
- Clarifai
- IBM
- Intel
- Micron Technology
- Microsoft
- NVIDIA
- Qualcomm
- Samsung Electronics
- AMD/Xilinx
- Apple
- SenseTime
- Hikvision
- Megvii
- NEC Corporation
- Cognex
- Zebra Technologies
- Huawei Technologies
- Palantir
第七章 市场机会与未来展望
The AI image recognition market size is estimated at USD 4.97 billion in 2025 and is forecast to reach USD 9.79 billion by 2030, reflecting a 14.52% CAGR.
This expansion is rooted in enterprise reliance on automated visual intelligence that now stretches from factory floors to diagnostic suites. Falling silicon costs, multimodal foundation models, and maturing edge hardware keep total cost of ownership on a downward trajectory, making large-scale rollouts economically viable. Vendors redirect capital toward vertically integrated stacks that bundle chips, software, and services, streamlining procurement cycles and boosting deployment velocity. Meanwhile, synthetic data engines shrink labeling budgets, broadening participation for mid-sized firms that previously lacked annotated imagery. Collectively, these trends position the AI image recognition market for durable double-digit growth.
Global AI Image Recognition Market Trends and Insights
Cloud-Native AI Adoption Boom
Hyperscale providers deliver containerized vision pipelines that push models from prototype to production inside weeks, trimming time-to-value for manufacturers and retailers. Microsoft Azure and Google Cloud showcase packaged defect-detection blueprints that lower entry barriers for firms with limited ML staff. Kubernetes-orchestrated inference endpoints allocate compute only when imagery arrives, enabling 15-40% cost savings versus fixed on-premise clusters. As a result, the AI image recognition market benefits from faster procurement cycles and broader user diversity.
Proliferation of High-Resolution Cameras
Fifth-generation automotive ADAS units and 8K industrial sensors now pair with on-device AI accelerators that deliver sub-50 ms inference without network round-trips. Continental's MFC525 camera offers a 110-degree field of view while performing object classification locally, and Samsung's latest neural engines hit 38 TOPS inside consumer smartphones. These capabilities unlock real-time quality control and immersive AR functions, widening the addressable base of the AI image recognition market.
Data-Privacy and Compliance Hurdles
The EU AI Act and California statutes impose robust audit trails, inflating validation costs by up to 30% for medical-imaging deployments. Conflicting data-residency mandates compel dual-stack architectures, slowing rollouts among mid-size hospitals that lack dedicated privacy teams. Such friction tempers growth momentum in the AI image recognition market.
Other drivers and restraints analyzed in the detailed report include:
- Retail Loss-Prevention Initiatives
- Synthetic Data Pipelines Slashing Labelling Cost
- GPU Supply Chain Geopolitics Elevating Capex Risk
For complete list of drivers and restraints, kindly check the Table Of Contents.
Segment Analysis
Hardware controlled 45.6% of 2024 revenue, yet services post a 14.9% CAGR that outpaces all other categories. Edge-ready cameras and inference chips from NVIDIA and Intel lower latency below 50 ms, energizing brownfield retrofits in manufacturing plants. Software, especially low-code model-ops platforms, eases custom pipeline creation for firms without deep data-science benches. Meanwhile, professional services providers craft domain-tuned datasets and continuous-learning workflows that elevate production accuracy beyond initial proof points. This shift toward holistic outcomes rather than discrete products broadens wallet share for integrators inside the AI image recognition market.
On-premises systems retained 68.7% revenue in 2024 because hospitals, banks, and defense agencies must keep imagery within local firewalls. Edge scenarios in mines, ships, and remote factories mirror this preference, where intermittent connectivity precludes cloud round-trips. Even so, cloud workloads grow at 16.7% CAGR as elastic GPU pools absorb seasonal or burst-heavy image pipelines. Hybrid topologies marry edge preprocessing with cloud retraining, letting enterprises tune inference at the edge while leveraging petascale datasets centrally. This blended paradigm safeguards compliance yet benefits from hyperscaler economics, reinforcing long-run expansion of the AI image recognition market.
AI Image Recognition Market Report is Segmented by Type (Hardware, Software, and Services), Deployment Model (Cloud, On-Premises), Application (Image Classification, Object Detection and Tracking, Facial Recognition, and More), End-User Industry (Automotive, BFSI, and More), and by Geography. The Market Forecasts are Provided in Terms of Value (USD).
Geography Analysis
North America held 27.8% revenue in 2024, buoyed by a dense funding ecosystem and domestic chip fabrication initiatives such as TSMC's USD 165 billion Arizona campus. Corporate M&A, evidenced by Meta's USD 14.8 billion stake in Scale AI, intensifies regional R&D velocity. Government incentives for semiconductor resilience further anchor the AI image recognition market in the United States and Canada.
Europe exhibits moderated yet steady adoption, framed by the bloc's stringent AI Act. German heavy-industry leaders weave vision into automated assembly, while French startups refine clinical decision support under GDPR safeguards. Investment remains disciplined but targeted, favoring vendors able to certify transparency and bias mitigation. Such rigor shapes solution design across the AI image recognition market.
Asia-Pacific shows the highest trajectory at 15.9% CAGR. China allocates multiyear budgets topping USD 70 billion for smart-city and surveillance grids. Japan's USD 65 billion semiconductor program and South Korea's leadership in HBM memory create a vertically integrated supply base. India's developer pool sustains global model-tuning services at competitive rates, collectively accelerating the AI image recognition market.
- Google (Alphabet)
- Clarifai
- IBM
- Intel
- Micron Technology
- Microsoft
- NVIDIA
- Qualcomm
- Samsung Electronics
- AMD/Xilinx
- Apple
- SenseTime
- Hikvision
- Megvii
- NEC Corporation
- Cognex
- Zebra Technologies
- Huawei Technologies
- Palantir
Additional Benefits:
- The market estimate (ME) sheet in Excel format
- 3 months of analyst support
TABLE OF CONTENTS
1 INTRODUCTION
- 1.1 Study Assumptions and Market Definition
- 1.2 Scope of the Study
2 RESEARCH METHODOLOGY
3 EXECUTIVE SUMMARY
4 MARKET LANDSCAPE
- 4.1 Market Overview
- 4.2 Market Drivers
- 4.2.1 Cloud-native AI adoption boom
- 4.2.2 Proliferation of high-resolution cameras
- 4.2.3 Retail loss-prevention initiatives
- 4.2.4 Expansion of Smart Cities and Surveillance Infrastructure
- 4.2.5 Synthetic data pipelines slashing labeling cost
- 4.2.6 Satellite imagery firms open-sourcing labeled sets
- 4.3 Market Restraints
- 4.3.1 Data-privacy and compliance hurdles
- 4.3.2 Shortage of domain-specific talent
- 4.3.3 GPU supply chain geopolitics elevating capex risk
- 4.3.4 Rising legal exposure from biased algorithms
- 4.4 Supply-Chain Analysis
- 4.5 Regulatory Landscape
- 4.6 Technological Outlook (Edge vs Cloud inference)
- 4.7 Porter's Five Forces
- 4.7.1 Bargaining Power of Buyers
- 4.7.2 Bargaining Power of Suppliers
- 4.7.3 Threat of New Entrants
- 4.7.4 Threat of Substitutes
- 4.7.5 Degree of Competition
- 4.8 Assessment of Macroeconomic Factors
5 MARKET SIZE AND GROWTH FORECASTS (VALUE)
- 5.1 By Component
- 5.1.1 Hardware
- 5.1.2 Software
- 5.1.3 Services
- 5.2 By Deployment Model
- 5.2.1 Cloud
- 5.2.2 On-premises
- 5.3 By Application
- 5.3.1 Image Classification
- 5.3.2 Object Detection and Tracking
- 5.3.3 Facial Recognition
- 5.3.4 Industrial Inspection
- 5.3.5 Medical Imaging
- 5.3.6 Other Niche Applications
- 5.4 By End-user Industry
- 5.4.1 Automotive
- 5.4.2 BFSI
- 5.4.3 Healthcare Providers and Med-tech
- 5.4.4 Retail and E-commerce
- 5.4.5 Security and Surveillance Integrators
- 5.4.6 Manufacturing
- 5.4.7 Others (Agriculture, Energy, etc.)
- 5.5 By Geography
- 5.5.1 North America
- 5.5.1.1 United States
- 5.5.1.2 Canada
- 5.5.1.3 Mexico
- 5.5.2 South America
- 5.5.2.1 Brazil
- 5.5.2.2 Argentina
- 5.5.2.3 Rest of South America
- 5.5.3 Europe
- 5.5.3.1 Germany
- 5.5.3.2 United Kingdom
- 5.5.3.3 France
- 5.5.3.4 Italy
- 5.5.3.5 Spain
- 5.5.3.6 Rest of Europe
- 5.5.4 Asia-Pacific
- 5.5.4.1 China
- 5.5.4.2 Japan
- 5.5.4.3 India
- 5.5.4.4 South Korea
- 5.5.4.5 Australia
- 5.5.4.6 Rest of Asia-Pacific
- 5.5.5 Middle East and Africa
- 5.5.5.1 Middle East
- 5.5.5.1.1 Saudi Arabia
- 5.5.5.1.2 United Arab Emirates
- 5.5.5.1.3 Turkey
- 5.5.5.1.4 Rest of Middle East
- 5.5.5.2 Africa
- 5.5.5.2.1 South Africa
- 5.5.5.2.2 Nigeria
- 5.5.5.2.3 Egypt
- 5.5.5.2.4 Rest of Africa
- 5.5.1 North America
6 COMPETITIVE LANDSCAPE
- 6.1 Market Concentration
- 6.2 Strategic Moves
- 6.3 Market Share Analysis
- 6.4 Company Profiles (includes Global level Overview, Market level overview, Core Segments, Financials as available, Strategic Information, Market Rank/Share for key companies, Products and Services, and Recent Developments)
- 6.4.1 Google (Alphabet)
- 6.4.2 Clarifai
- 6.4.3 IBM
- 6.4.4 Intel
- 6.4.5 Micron Technology
- 6.4.6 Microsoft
- 6.4.7 NVIDIA
- 6.4.8 Qualcomm
- 6.4.9 Samsung Electronics
- 6.4.10 AMD/Xilinx
- 6.4.11 Apple
- 6.4.12 SenseTime
- 6.4.13 Hikvision
- 6.4.14 Megvii
- 6.4.15 NEC Corporation
- 6.4.16 Cognex
- 6.4.17 Zebra Technologies
- 6.4.18 Huawei Technologies
- 6.4.19 Palantir
7 MARKET OPPORTUNITIES AND FUTURE OUTLOOK
- 7.1 White-space and Unmet-need Assessment
 2026年全球人工智慧(AI)影像识别市场报告
 影像分析软体市场规模、份额和成长分析:按软体类型、应用领域、企业规模、部署模式、最终用户产业和地区划分-2026-2033年产业预测
 2024-2028年全球人工智慧影像识别市场
 全球人工智慧影像辨识市场2024-2031