


 |
市场调查报告书
商品编码
1850307
物联网分析:市场占有率分析、产业趋势、统计数据和成长预测(2025-2030 年)IoT Analytics - Market Share Analysis, Industry Trends & Statistics, Growth Forecasts (2025 - 2030) |
||||||
※ 本网页内容可能与最新版本有所差异。详细情况请与我们联繫。
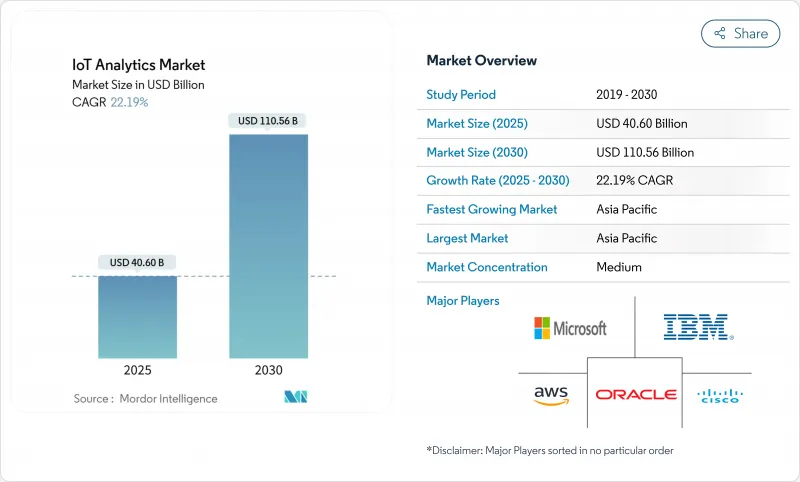
预计到 2025 年,物联网分析市场规模将达到 406 亿美元,到 2030 年将达到 1,105.6 亿美元,在此期间的复合年增长率将达到 22.2%。
快速的设备普及、边缘运算与人工智慧的融合以及企业数位转型计画正在推动这一扩张。企业正将分析工作负载迁移到更靠近互联资产的位置,以降低延迟和频宽成本,同时提升营运决策水准。资产密集型产业预测性维护的成功案例以及永续性要求对持续性能监控的呼声,进一步刺激了市场需求。随着云端超大规模资料中心业者、专业供应商和边缘平台供应商利用伙伴关係和收购来巩固生态系统优势,竞争日益激烈。
全球物联网分析市场趋势与洞察
物联网设备的激增产生了Exabyte资料(以艾位元组为单位)。
连网型设备的数量正呈指数级增长,预计到2025年,全球物联网终端每年将产生超过175Zetta位元组的数据。工厂级感测器阵列每天已经输出Terabyte的数据,迫使企业在边缘部署分析引擎,以避免云端回程传输延迟。采用这种边缘优先模式的製造商,其营运效率比纯云端部署模式提高了30%。海量资料涵盖结构化远端检测、非结构化影片和日誌文件,因此需要投资能够同时处理各种有效载荷的多模态分析框架。
企业广泛采用的云端原生分析平台
微软 Azure IoT Operations 等付费使用制服务使企业能够每天处理数十亿条讯息,同时将基础设施投资减少高达 60%。零信任架构和内建威胁分析降低了安全隐患,加速了製造业和物流业全面采用云端技术。受严格监管的行业正越来越多地将云端处理与本地处理相结合,随着服务供应商不断扩展其合规套件,这一趋势仍然强劲。
资料隐私和跨境合规的复杂性
GDPR 规定了严格的同意、最小化和本地化规则,违规行为将占全球收入的 4%。不同国家的法律迫使公司维护多个区域资料存储,导致计划预算增加高达 25%。即时跨境分析必须纳入策略感知路由才能满足主权法规的要求,从而减慢了企业部署速度。
細項分析
解决方案将继续占据主导地位,到2024年将占总收入的68.7%。在物联网分析领域,解决方案市场规模预计将稳定成长,但随着企业寻求託管专业知识,服务类别预计将以24.0%的复合年增长率更快成长。专业服务对通讯协定映射、边缘堆迭调优和多重云端整合的需求将大幅成长。
人才短缺和日益复杂的架构使得外部合作伙伴更具吸引力。託管服务协议通常捆绑软体、基础设施和基于结果的服务等级协定 (SLA),将风险转移给提供者。由于连网设备相关的攻击面不断扩大,安全分析细分市场蓬勃发展。
到2024年,本地安装将占据65.4%的市场份额,这反映了对控制、延迟和监管的需求。然而,随着超大规模企业将资料撷取管道与无伺服器分析引擎结合,云端实例将以24.1%的复合年增长率成长。混合设计将时间关键型工作负载路由到边缘节点,同时将聚合资料传送到云端进行批次AI处理。
微软和亚马逊在可组合产品方面处于领先地位,使企业能够在几分钟内建立数位双胞胎并进行大规模模型训练。供应链的不稳定和能源价格的波动凸显了弹性运算的需求,并进一步推动了云端运算的采用。
物联网分析市场报告按组件(解决方案和服务)、部署方式(本地部署和云端部署)、组织规模(大型企业和中小企业)、应用程式(预测性维护、资产性能管理、能源管理等)、最终用户行业(製造业、能源和公共产业、运输和物流、零售和电子商务等)以及地区进行细分。
区域分析
亚太地区预计到2024年将占全球营收的35.6%,主要得益于「中国製造2025」和印度智慧城市计画等政府计画。该地区将以23.2%的复合年增长率成长,凸显了工业数位化、5G部署和边缘人工智慧试验的规模。中国工厂正在实施基于视觉的品管,而印度市政当局则利用感测器网路来管理废弃物和交通。
北美凭藉其成熟的云端基础设施和早期的人工智慧应用紧随其后。在风险资金筹措和大学研究管道的推动下,企业正在将流分析整合到其数位营运中心。该地区将继续成为自动驾驶和精密农业计划的试验田。
在欧洲,由ESG合规驱动的即时排放监测将迎来强劲成长。 「欧洲绿色新政」倡议将推动公用事业和製造业转型为数据主导的效率提升模式。随着通讯业者扩大NB-IoT和5G覆盖范围,拉丁美洲和中东等新兴市场将获得发展动力,从而推动物流、石油和公共待开发区部署。
其他福利:
- Excel 格式的市场预测 (ME) 表
- 3个月的分析师支持
目录
第一章 引言
- 研究假设和市场定义
- 调查范围
第二章调查方法
第三章执行摘要
第四章 市场状况
- 市场概况
- 市场驱动因素
- 物联网设备的激增产生了Exabyte资料(以艾位元组为单位)。
- 云端原生分析平台正逐渐被企业接受。
- 资产密集型产业对预测性维护的需求
- 边缘AI加速器,实现亚秒边缘分析
- 统一孤立物联网资料流的企业资料架构架构
- 以环境、社会及公司治理(ESG)主导的永续性监督职责
- 市场限制
- 资料隐私和跨境合规的复杂性
- 物联网资料科学人才短缺
- 工业通讯协定的碎片化阻碍了互通性
- 高频感测器遥测频宽成本不断上涨
- 价值链分析
- 监管格局
- 技术展望
- 波特五力分析
- 供应商的议价能力
- 买方的议价能力
- 新进入者的威胁
- 替代品的威胁
- 竞争对手之间的竞争
- 投资分析
- 评估宏观经济趋势对市场的影响
第五章市场规模及成长预测
- 按组件
- 解决方案
- 网管
- 安全分析
- 即时串流分析
- 资料管理和储存分析
- 视觉化和仪表板
- 服务
- 专业服务
- 託管服务
- 解决方案
- 按部署
- 本地部署
- 云
- 按公司规模
- 大公司
- 小型企业
- 按用途
- 预测性维护
- 资产绩效管理
- 能源管理
- 供应炼和物流优化
- 其他用途
- 按最终用户产业
- 製造业
- 能源和公共产业
- 运输/物流
- 零售与电子商务
- 医疗保健和生命科学
- 其他终端用户产业
- 按地区
- 北美洲
- 美国
- 加拿大
- 墨西哥
- 欧洲
- 德国
- 英国
- 法国
- 义大利
- 西班牙
- 俄罗斯
- 其他欧洲地区
- 亚太地区
- 中国
- 日本
- 印度
- 韩国
- 澳洲和纽西兰
- 其他亚太地区
- 南美洲
- 巴西
- 阿根廷
- 其他南美
- 中东和非洲
- 中东
- 沙乌地阿拉伯
- 阿拉伯聯合大公国
- 土耳其
- 其他中东地区
- 非洲
- 南非
- 奈及利亚
- 其他非洲国家
- 北美洲
第六章 竞争态势
- 市场集中度
- 策略趋势
- 市占率分析
- 公司简介
- Microsoft Corporation
- Amazon Web Services, Inc.
- IBM Corporation
- Google LLC
- Cisco Systems, Inc.
- Oracle Corporation
- SAP SE
- Dell Technologies Inc.
- The Hewlett Packard Enterprise Company
- Teradata Corporation
- Salesforce, Inc.
- Accenture plc
- PTC Inc.
- Hitachi Vantara LLC
- Cloudera, Inc.
- Software AG
- SAS Institute Inc.
- Splunk Inc.
- C3.ai, Inc.
- Uptake Technologies Inc.
- GE Digital
- QlikTech International AB
第七章 市场机会与未来展望
The IoT analytics market size is USD 40.60 billion in 2025 and is forecast to reach USD 110.56 billion in 2030, registering a 22.2% CAGR over the period.
Rapid device proliferation, edge-AI convergence, and enterprise digital-transformation programs underpin this expansion. Enterprises are moving analytic workloads closer to connected assets, reducing latency and bandwidth costs while improving operational decisions. Demand is reinforced by predictive-maintenance success stories in asset-intensive sectors and by sustainability mandates that call for continuous performance monitoring. Competitive intensity is strengthening as cloud hyperscalers, specialist vendors, and edge-platform providers leverage partnerships and acquisitions to secure ecosystem advantages.
Global IoT Analytics Market Trends and Insights
Proliferation of IoT Devices Generating Exabyte-Scale Data
Connected-device counts are rising sharply, with global IoT endpoints expected to produce more than 175 zettabytes of data annually by 2025. Plant-level sensor arrays already emit terabytes each day, forcing enterprises to deploy analytics engines at the edge to avoid cloud-backhaul delays. Manufacturers adopting this edge-first model record 30% higher operational efficiency versus cloud-only setups. The data surge spans structured telemetry, unstructured video, and log files, prompting investment in multimodal analytic frameworks that can handle diverse payloads concurrently.
Cloud-Native Analytics Platforms Gaining Enterprise Acceptance
Scalable, pay-as-you-go services such as Microsoft Azure IoT Operations allow firms to ingest billions of daily messages while cutting infrastructure outlays by up to 60%. Zero-trust architectures and built-in threat analytics lessen security concerns, accelerating full-cloud adoption in manufacturing and logistics. Highly regulated verticals continue to blend cloud and local processing, but migration momentum remains strong as providers extend compliance toolkits.
Data-Privacy and Cross-Border Compliance Complexity
GDPR imposes stringent consent, minimization, and localization rules; non-compliance can cost 4% of global turnover. Divergent national laws force firms to maintain multiple regional data stores, inflating project budgets by up to 25%. Real-time analytics crossing borders must incorporate policy-aware routing to satisfy sovereignty mandates, slowing enterprise rollouts.
Other drivers and restraints analyzed in the detailed report include:
- Predictive-Maintenance Demand Across Asset-Intensive Industries
- Edge-AI Accelerators Enabling Sub-Second Analytics
- Shortage of IoT Data-Science Talent Pool
For complete list of drivers and restraints, kindly check the Table Of Contents.
Segment Analysis
Solutions continued to dominate, accounting for 68.7% revenue in 2024. The IoT analytics market size for solutions is forecast to increase steadily, yet the services category is set to expand faster at 24.0% CAGR as firms seek managed expertise. Professional services are in high demand for protocol mapping, edge-stack tuning, and multi-cloud integration.
The talent shortfall and rising architectural complexity make external partners attractive. Managed-service contracts often bundle software, infrastructure, and outcome-based SLAs, shifting risk to providers. Security-analytics sub-segments are buoyed by expanding attack surfaces tied to connected devices.
On-premise installations held 65.4% share in 2024, reflecting control, latency, and regulatory needs. Yet cloud instances are growing at 24.1% CAGR as hyperscalers couple ingestion pipelines with serverless analytic engines. Hybrid designs route time-critical workloads to edge nodes while sending aggregated data to the cloud for batch AI.
Microsoft and Amazon lead with composable offerings, enabling enterprises to spin up digital twins and large-scale model training within minutes. Supply-chain volatility and energy-price swings underline the need for elastic compute, further pushing cloud uptake.
The IoT Analytics Market Report is Segmented by Component (Solutions and Services), Deployment (On-Premise and Cloud), Organization Size (Large Enterprises and Small and Medium Enterprises (SMEs)), Application (Predictive Maintenance, Asset Performance Management, Energy Management, and More), End-User Industry (Manufacturing, Energy and Utilities, Transportation and Logistics, Retail and E-Commerce, and More), and Geography.
Geography Analysis
Asia-Pacific delivered 35.6% of 2024 revenue, benefiting from government programs such as "Made in China 2025" and India's Smart Cities Mission. Regional CAGR of 23.2% underscores the scale of industrial digitization, 5G rollout, and edge-AI pilots. Chinese factories deploy vision-based quality control, while Indian municipalities apply sensor networks to manage waste and traffic.
North America follows closely, with mature cloud infrastructure and early AI adoption. Enterprises integrate streaming analytics with digital-operations centers, aided by robust venture funding and university research pipelines. The region remains a test-bed for autonomous-mobility and precision-agriculture projects.
Europe posts steady growth as ESG compliance drives real-time emissions monitoring. Initiatives under the European Green Deal push utilities and manufacturers toward data-driven efficiency. Emerging markets in Latin America and the Middle East gain momentum as telecom operators extend NB-IoT and 5G coverage, enabling greenfield deployments in logistics, oil, and public safety.
- Microsoft Corporation
- Amazon Web Services, Inc.
- IBM Corporation
- Google LLC
- Cisco Systems, Inc.
- Oracle Corporation
- SAP SE
- Dell Technologies Inc.
- The Hewlett Packard Enterprise Company
- Teradata Corporation
- Salesforce, Inc.
- Accenture plc
- PTC Inc.
- Hitachi Vantara LLC
- Cloudera, Inc.
- Software AG
- SAS Institute Inc.
- Splunk Inc.
- C3.ai, Inc.
- Uptake Technologies Inc.
- GE Digital
- QlikTech International AB
Additional Benefits:
- The market estimate (ME) sheet in Excel format
- 3 months of analyst support
TABLE OF CONTENTS
1 INTRODUCTION
- 1.1 Study Assumptions and Market Definition
- 1.2 Scope of the Study
2 RESEARCH METHODOLOGY
3 EXECUTIVE SUMMARY
4 MARKET LANDSCAPE
- 4.1 Market Overview
- 4.2 Market Drivers
- 4.2.1 Proliferation of IoT devices generating exabyte-scale data
- 4.2.2 Cloud-native analytics platforms gaining enterprise acceptance
- 4.2.3 Predictive-maintenance demand across asset-intensive industries
- 4.2.4 Edge-AI accelerators enabling sub-second analytics at the edge
- 4.2.5 Enterprise data-fabric architectures unifying siloed IoT streams
- 4.2.6 ESG-driven sustainability monitoring mandates
- 4.3 Market Restraints
- 4.3.1 Data-privacy and cross-border compliance complexity
- 4.3.2 Shortage of IoT data-science talent pool
- 4.3.3 Industrial-protocol fragmentation hindering interoperability
- 4.3.4 Rising telemetry bandwidth costs for high-frequency sensors
- 4.4 Value Chain Analysis
- 4.5 Regulatory Landscape
- 4.6 Technological Outlook
- 4.7 Porter's Five Forces Analysis
- 4.7.1 Bargaining Power of Suppliers
- 4.7.2 Bargaining Power of Buyers
- 4.7.3 Threat of New Entrants
- 4.7.4 Threat of Substitutes
- 4.7.5 Intensity of Competitive Rivalry
- 4.8 Investment Analysis
- 4.9 Assessment of the Impact of Macroeconomic Trends on the Market
5 MARKET SIZE AND GROWTH FORECASTS (VALUE)
- 5.1 By Component
- 5.1.1 Solutions
- 5.1.1.1 Network Management
- 5.1.1.2 Security Analytics
- 5.1.1.3 Real-time Streaming Analytics
- 5.1.1.4 Data Management and Storage Analytics
- 5.1.1.5 Visualization and Dashboard
- 5.1.2 Services
- 5.1.2.1 Professional Services
- 5.1.2.2 Managed Services
- 5.1.1 Solutions
- 5.2 By Deployment
- 5.2.1 On-premise
- 5.2.2 Cloud
- 5.3 By Organisation Size
- 5.3.1 Large Enterprises
- 5.3.2 Small and Medium Enterprises (SMEs)
- 5.4 By Application
- 5.4.1 Predictive Maintenance
- 5.4.2 Asset Performance Management
- 5.4.3 Energy Management
- 5.4.4 Supply-Chain and Logistics Optimisation
- 5.4.5 Other Applications
- 5.5 By End-User Industry
- 5.5.1 Manufacturing
- 5.5.2 Energy and Utilities
- 5.5.3 Transportation and Logistics
- 5.5.4 Retail and E-Commerce
- 5.5.5 Healthcare and Life Sciences
- 5.5.6 Other End-User Industries
- 5.6 By Geography
- 5.6.1 North America
- 5.6.1.1 United States
- 5.6.1.2 Canada
- 5.6.1.3 Mexico
- 5.6.2 Europe
- 5.6.2.1 Germany
- 5.6.2.2 United Kingdom
- 5.6.2.3 France
- 5.6.2.4 Italy
- 5.6.2.5 Spain
- 5.6.2.6 Russia
- 5.6.2.7 Rest of Europe
- 5.6.3 Asia-Pacific
- 5.6.3.1 China
- 5.6.3.2 Japan
- 5.6.3.3 India
- 5.6.3.4 South Korea
- 5.6.3.5 Australia and New Zealand
- 5.6.3.6 Rest of Asia-Pacific
- 5.6.4 South America
- 5.6.4.1 Brazil
- 5.6.4.2 Argentina
- 5.6.4.3 Rest of South America
- 5.6.5 Middle East and Africa
- 5.6.5.1 Middle East
- 5.6.5.1.1 Saudi Arabia
- 5.6.5.1.2 United Arab Emirates
- 5.6.5.1.3 Turkey
- 5.6.5.1.4 Rest of Middle East
- 5.6.5.2 Africa
- 5.6.5.2.1 South Africa
- 5.6.5.2.2 Nigeria
- 5.6.5.2.3 Rest of Africa
- 5.6.1 North America
6 COMPETITIVE LANDSCAPE
- 6.1 Market Concentration
- 6.2 Strategic Moves
- 6.3 Market Share Analysis
- 6.4 Company Profiles (includes Global level Overview, Market level overview, Core Segments, Financials as available, Strategic Information, Market Rank/Share for key companies, Products and Services, and Recent Developments)
- 6.4.1 Microsoft Corporation
- 6.4.2 Amazon Web Services, Inc.
- 6.4.3 IBM Corporation
- 6.4.4 Google LLC
- 6.4.5 Cisco Systems, Inc.
- 6.4.6 Oracle Corporation
- 6.4.7 SAP SE
- 6.4.8 Dell Technologies Inc.
- 6.4.9 The Hewlett Packard Enterprise Company
- 6.4.10 Teradata Corporation
- 6.4.11 Salesforce, Inc.
- 6.4.12 Accenture plc
- 6.4.13 PTC Inc.
- 6.4.14 Hitachi Vantara LLC
- 6.4.15 Cloudera, Inc.
- 6.4.16 Software AG
- 6.4.17 SAS Institute Inc.
- 6.4.18 Splunk Inc.
- 6.4.19 C3.ai, Inc.
- 6.4.20 Uptake Technologies Inc.
- 6.4.21 GE Digital
- 6.4.22 QlikTech International AB
7 MARKET OPPORTUNITIES AND FUTURE OUTLOOK
- 7.1 White-space and Unmet-Need Assessment
 物联网分析市场:依分析类型、部署形式、组织规模及最终用户产业划分-2026-2032年全球预测
 物联网 (AoT) 市场规模、份额和成长分析:按组件、组织规模、技术、部署模式、应用类型、行业和地区划分 - 2026-2033 年行业预测智慧数位货架分析平台市场:按组件、部署模式、组织规模、分析类型和最终用户产业划分,全球预测(2026-2032年)
 物联网分析市场规模、份额和成长分析(按类型、组件、组织规模、部署模式、应用、最终用户产业和地区划分)-2026-2033年产业预测
 物联网分析市场-全球产业规模、份额、趋势、机会和预测,按分析类型、服务类型、最终用户、地区和竞争细分,2020-2030 年预测
 全球物联网分析市场规模研究与预测(按组件、部署、类型、应用和区域划分)2025 年至 2035 年
 全球物联网 (IoT) 分析市场:市场规模、占有率、趋势、行业分析(按组件、组织规模、部署方法、类型、应用、最终用途和地区)、未来预测(2025-2034 年)
 全球物联网分析市场,2024-2028IoT分析的全球市场:产业分析,规模,占有率,成长,趋势,预测(2024年~2031年)
 物联网分析全球市场:市场规模、份额、趋势分析报告 - 按组件、按最终用途、按组织规模、按部署、按类型、按应用、按地区、区域展望、预测,2024-2031 年