


 |
市场调查报告书
商品编码
1850311
应用交付控制器(ADC):市场份额分析、行业趋势、统计数据和成长预测(2025-2030 年)Application Delivery Controllers (ADC) - Market Share Analysis, Industry Trends & Statistics, Growth Forecasts (2025 - 2030) |
||||||
※ 本网页内容可能与最新版本有所差异。详细情况请与我们联繫。
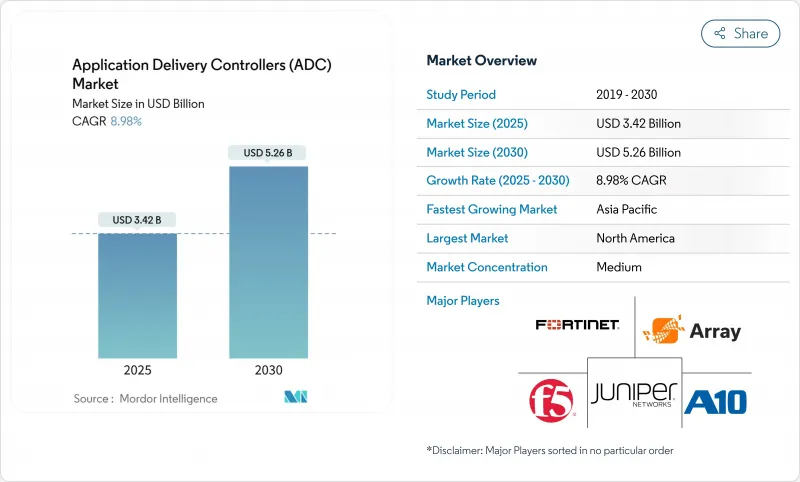
应用交付控制器 (ADC) 市场预计到 2025 年将达到 34.2 亿美元,到 2030 年将达到 52.6 亿美元,复合年增长率为 8.98%。
向云端原生架构的快速转型、东西向资料中心流量的成长以及持续的多重云端策略,正在推动对智慧、安全感知型流量管理平台的需求。供应商现在将先进的第 7 层安全性、API 保护和 AI 辅助分析整合到单一产品中,使企业能够在提升用户体验的同时降低风险。虽然硬体设备仍然主导着对效能要求较高的工作负载,但随着企业优先考虑敏捷性和按需付费的经济外形规格设备正在迅速扩张。从区域来看,北美凭藉其成熟的 IT 资产和有利的监管环境,保持着领先地位;而亚太地区则在 5G 建设和数位化倡议的推动下,实现了最强劲的增长。
全球应用交付控制器 (ADC) 市场趋势与洞察
向云端原生和微服务架构的转变
应用程式交付控制器市场正被迫转向轻量级、以 API 为中心的架构,以便部署在 Kubernetes 丛集和服务网格中。这些微网专注于入了细粒度的流量控制、双向 TLS 终止和自动扩展钩子,以适应现代应用程式的短暂性。供应商正在整合模式感知 API 防火墙和分散式速率限制器,以弥补东西向服务呼叫造成的安全漏洞。随着资讯长们大力推进平台工程,声明式的「ADC 即程式码」与 GitOps 管线无缝集成,减少了开发和网路运维之间的交接环节。
东西向资料中心流量呈指数级增长
由于虚拟伺服器密度高,内部流量已超越传统的南北向模式,推动了对延迟敏感的微交易的成长。分散式应用交付控制器 (ADC) 执行个体现在部署在工作负载 pod 附近,可在不造成瓶颈的情况下提供广泛的远端检测和线上解密功能。金融交易所、通讯业者和游戏供应商正在部署数千个轻量级代理,这些代理商能够适应突发的资源池,并共同执行第 7 层策略。
复杂的第 7 层策略配置给 IT 维运带来负担。
企业团队面临数百个不同的应用程序,每个应用程式都需要自订的路由、重写或WAF逻辑。在多重云端环境中保持准确性会对稀缺的DevSecOps人才带来巨大压力,并阻碍更广泛的应用程式交付控制(ADC)部署。供应商正在透过基于意图的模板、AI驱动的规则创建和视觉化依赖关係图来应对这一挑战,但技能缺口依然存在。
细分市场分析
到2024年,硬体设备将占据应用交付控制器市场59%的份额,这主要得益于用于SSL卸载和确定性吞吐量的专用晶片。然而,随着DevOps团队将ADC镜像直接整合到CI/CD管线中,减少机架占用空间并加快部署速度,虚拟应用交付控制器市场将以14.6%的复合年增长率成长。随着容器技术的普及,虚拟解决方案的应用交付控制器市场规模将大幅成长,挑战硬体在关键任务层级的主导地位。
成熟的供应商正透过发布容器原生代理来分散风险,这些代理商既能降低设备开销,又能继承策略引擎。成本透明度和云端市场收费对敏捷团队极具吸引力,软体解决方案甚至在传统企业中也越来越受欢迎。随着 TLS 1.3 和 QUIC 的普及,程式码层面的敏捷性可能会进一步促使企业倾向于选择软体外形规格。
到2024年,本地部署实例仍将占据应用交付控制器市场64%的份额,尤其受到资料主权驱动型产业的青睐。整合的威胁分析模组和计量型的容量授权模式,无需彻底更换现有系统即可升级传统架构。
相反,随着平台团队将修补程式、扩展和遥测等工作外包给供应商营运的控制平台,云端管理模式将以 15.2% 的复合年增长率成长。多区域部署可在数小时内完成,统一的 API 策略执行可消除站点层级偏差。应用交付控制器市场正透过混合仪表板不断融合这些模式,从而实现从单一主机配置硬体、虚拟和 SaaS 端点。
应用交付控制器 (ADC) 市场按类型(硬体 ADC、虚拟/软体 ADC)、部署方式(本地部署、云端託管/云端管理)、元件(解决方案(控制、加速、安全)、服务(整合、管理、培训))、公司规模(大型企业、中小企业)、最终用户行业(IT 和电信、银行、金融服务和保险 (BFSI)、其他地区以及其他地区进行细分。市场预测以美元计价。
区域分析
到2024年,北美将占据应用交付控制器市场34%的份额,这主要得益于超大规模资料中心生态系统和严格的资料隐私法规,这些法规推动了对整合安全的需求。诸如F5替换数百套Citrix NetScaler系统之类的整合倡议,预示着成熟客户群的流失。
亚太地区正以12.8%的复合年增长率实现最快成长,这主要得益于5G部署和工业4.0计画推动了工厂和智慧城市对低延迟、多租户ADC架构的需求。中国和印度的政府云端专案正在将ADC功能嵌入其自主云中,并与本地供应商建立伙伴关係。
在欧洲,DORA 合规期限的收紧影响着银行和金融科技公司的升级,平衡本地部署和云端部署,以及监管机构对资料驻留的关注,这些因素正在推动对政策主导的位置隔离的需求。
在中东和非洲,应用资料中心(ADC)正被用于支援一项价值3.7兆美元的计划建设项目、物联网赋能的公共工程项目以及全国性的数位政府入口网站。这种混合模式既满足了效能需求,又能适应区域资料中心规模有限的限制。
金融服务和零售电子商务的现代化正在推动拉丁美洲采用云端基础的ADC,在经济波动的情况下,人们更倾向于使用基于云端的ADC来避免资金限制。
其他福利:
- Excel格式的市场预测(ME)表
- 3个月的分析师支持
目录
第一章 引言
- 研究假设和市场定义
- 调查范围
第二章调查方法
第三章执行摘要
第四章 市场情势
- 市场概览
- 市场驱动因素
- 向云端原生和微服务架构转型
- 东西向资料中心流量快速成长
- 北美和欧盟安全数位银行的监管要求
- 亚洲地区5G部署的扩展将推动边缘ADC的采用。
- 全球2000强企业中多重云端和混合IT策略的兴起
- 市场限制
- 复杂的第 7 层策略配置给 IT 维运带来负担。
- 先进ADC许可模式成本不断上升
- 基本负载平衡功能的商品化
- 熟练的网路运维和DevSecOps人才短缺
- 技术展望
- 波特五力分析
- 供应商的议价能力
- 买方的议价能力
- 新进入者的威胁
- 替代品的威胁
- 竞争对手之间的竞争
- 评估宏观经济因素对产业的影响
第五章 市场规模与成长预测
- 按类型
- 基于硬体的类比数位转换器
- 虚拟/软体ADC
- 透过部署
- 本地部署
- 云端託管/託管
- 按组件
- 解决方案(控制、加速、安全)
- 服务(整合、管理、培训)
- 按公司规模
- 大公司
- 小型企业
- 最终用户
- 资讯科技和通讯
- BFSI
- 零售与电子商务
- 医疗保健和生命科学
- 政府和公共部门
- 製造业和工业4.0
- 媒体与娱乐
- 能源与公共产业
- 按地区
- 北美洲
- 美国
- 加拿大
- 墨西哥
- 南美洲
- 巴西
- 阿根廷
- 智利
- 秘鲁
- 其他南美洲
- 欧洲
- 德国
- 英国
- 法国
- 义大利
- 西班牙
- 其他欧洲地区
- 亚太地区
- 中国
- 日本
- 韩国
- 印度
- 澳洲
- 纽西兰
- 亚太其他地区
- 中东和非洲
- 阿拉伯聯合大公国
- 沙乌地阿拉伯
- 土耳其
- 南非
- 其他中东和非洲地区
- 北美洲
第六章 竞争情势
- 策略发展
- 供应商定位分析
- 公司简介
- F5 Networks Inc.
- NetScaler(Citrix Systems)
- Fortinet Inc.
- A10 Networks Inc.
- Array Networks Inc.
- Radware Ltd.
- Akamai Technologies Inc.
- Cisco Systems Inc.
- Barracuda Networks Inc.
- HAProxy Technologies LLC
- Kemp Technologies(Progress Software)
- Loadbalancer.org Inc.
- Cloudflare Inc.
- Dell Technologies Inc.
- Amazon Web Services(ALB/NLB)
- Microsoft Azure(Application Gateway)
- Alibaba Cloud(Global Server Load Balancer)
- Piolink Inc.
- Sangfor Technologies Inc.
- NGINX Inc.(F5)
第七章 市场机会与未来展望
The application delivery controllers market size stands at USD 3.42 billion in 2025 and is set to reach USD 5.26 billion by 2030, expanding at an 8.98% CAGR.
Rapid migration to cloud-native architectures, rising east-west data-center traffic, and persistent multi-cloud strategies keep demand high for intelligent, security-aware traffic-management platforms. Vendors now bundle advanced Layer-7 security, API protection, and AI-assisted analytics into single offerings, allowing enterprises to improve user experience while containing risk. Hardware appliances still dominate performance-critical workloads, yet virtual and cloud-managed form factors are scaling faster as organizations prioritize agility and consumption-based economics. Regionally, North America leverages mature IT estates and regulatory tailwinds to hold leadership, while Asia-Pacific's 5G build-outs and digital initiatives create the steepest growth curve.
Global Application Delivery Controllers (ADC) Market Trends and Insights
Shift Toward Cloud-Native And Microservices Architecture
More than half of enterprise workloads already run as containerized or serverless components, forcing the application delivery controllers market to pivot toward lightweight, API-centric form factors that sit inside Kubernetes clusters and service meshes. These micro-gateways inject granular traffic steering, mutual-TLS termination, and automated scaling hooks that match the ephemeral nature of modern applications . Vendors are embedding schema-aware API firewalls and distributed rate-limiters to close security gaps opened by east-west service calls. As CIOs push for platform engineering, declarative "ADC-as-code" integrates seamlessly with GitOps pipelines, reducing hand-offs between Dev and NetOps.
Exponential East-West Data-Center Traffic Growth
Virtual server density has multiplied internal flows, outpacing traditional north-south patterns and elevating latency-sensitive micro-transactions. Distributed ADC instances now sit closer to workload pods, providing pervasive telemetry and inline decryption without introducing bottlenecks . Financial exchanges, telcos, and gaming providers deploy thousands of lightweight proxies that collectively enforce Layer-7 policies yet adapt to bursty resource pools.
Complex Layer-7 Policy Configuration Burdens IT Ops
Enterprise teams confront hundreds of heterogeneous applications, each demanding bespoke routing, rewrite, or WAF logic. Maintaining accuracy across multi-cloud estates strains scarce DevSecOps talent and can stall broader ADC roll-outs. Vendors answer with intent-based templates, AI-assisted rule creation, and visual dependency maps, yet skill gaps persist.
Other drivers and restraints analyzed in the detailed report include:
- Regulatory Mandates for Secure Digital Banking
- Growing 5G Roll-outs Driving Edge ADC Adoption
- Cost Inflation of Advanced ADC Licensing Models
For complete list of drivers and restraints, kindly check the Table Of Contents.
Segment Analysis
Hardware appliances represented 59% of the application delivery controllers market in 2024, supported by specialized SSL offload chips and deterministic throughput. Yet the virtual segment is scaling at 14.6% CAGR as DevOps teams embed ADC images directly into CI/CD pipelines, reducing rack footprint and accelerating rollout windows. The application delivery controllers market size for virtual solutions is forecast to surge alongside container adoption, challenging hardware's grip on mission-critical tiers.
Mature vendors hedge by releasing container-native proxies that inherit their policy engines while shedding appliance overhead. Cost transparency plus cloud marketplace billing appeal to agile teams, driving incremental share gains for software even inside traditional enterprises. As TLS 1.3 and QUIC adoption climb, code-level agility will further tilt decisions toward software form factors, though hardware will persist for ultra-high TPS gateways in finance and telecom cores.
On-premise instances still command 64% of the application delivery controllers market size in 2024, favored by sectors bound to data-sovereignty mandates. Integrated threat analytics modules and pay-as-you-grow capacity licensing now refresh legacy estates without forklift replacements .
Conversely, the cloud-managed model rises at 15.2% CAGR as platform teams offload patching, scaling, and telemetry to vendor-operated control planes. Multi-region rollouts complete in hours, and unified API policy enforcement eliminates site-level drift, making it the preferred path for digital-native firms. The application delivery controllers market continues to blend these modes through hybrid dashboards that configure hardware, virtual, and SaaS endpoints from a single console.
Application Delivery Controllers (ADC) Market is Segmented by Type (Hardware-Based ADC, Virtual/Software ADC), Deployment (On-Premise, Cloud-Managed/Hosted), Component (Solutions (Control, Acceleration, Security), Services (Integration, Managed, Training)), Enterprise Size (Large Enterprises, Smes), End-User Vertical (IT and Telecom, BFSI, and More), Geography. The Market Forecasts are Provided in Terms of Value (USD).
Geography Analysis
North America retained 34% of the application delivery controllers market in 2024, buoyed by hyperscaler ecosystems and stringent data-privacy regulations that elevate integrated security requirements. Consolidation plays, such as F5's reported displacement of hundreds of Citrix NetScaler estates, demonstrate churn within mature accounts.
Asia-Pacific delivers the steepest 12.8% CAGR as 5G rollouts and Industry 4.0 agendas spur demand for low-latency, multi-tenant ADC fabrics across factories and smart cities. Government cloud programs in China and India embed ADC functionality inside sovereign clouds, driving local vendor partnerships.
Europe balances on-prem and cloud adoption, reinforced by DORA compliance deadlines influencing bank and fintech upgrades. Regulators' focus on data residency fuels demand for policy-driven location fencing.
Middle East and Africa tap ADCs to underpin USD 3.7 trillion in megaproject construction, IoT-enabled utilities, and nationwide digital-government portals. Hybrid models satisfy both performance needs and limited regional data-center footprints.
South America's financial-services modernization and retail e-commerce spur incremental uptake, with cloud-based ADCs preferred to circumvent capital constraints amid economic volatility.
- F5 Networks Inc.
- NetScaler (Citrix Systems)
- Fortinet Inc.
- A10 Networks Inc.
- Array Networks Inc.
- Radware Ltd.
- Akamai Technologies Inc.
- Cisco Systems Inc.
- Barracuda Networks Inc.
- HAProxy Technologies LLC
- Kemp Technologies (Progress Software)
- Loadbalancer.org Inc.
- Cloudflare Inc.
- Dell Technologies Inc.
- Amazon Web Services (ALB / NLB)
- Microsoft Azure (Application Gateway)
- Alibaba Cloud (Global Server Load Balancer)
- Piolink Inc.
- Sangfor Technologies Inc.
- NGINX Inc. (F5)
Additional Benefits:
- The market estimate (ME) sheet in Excel format
- 3 months of analyst support
TABLE OF CONTENTS
1 INTRODUCTION
- 1.1 Study Assumptions and Market Definition
- 1.2 Scope of the Study
2 RESEARCH METHODOLOGY
3 EXECUTIVE SUMMARY
4 MARKET LANDSCAPE
- 4.1 Market Overview
- 4.2 Market Drivers
- 4.2.1 Shift Toward Cloud-Native and Microservices Architecture
- 4.2.2 Exponential East-West Data-Center Traffic Growth
- 4.2.3 Regulatory Mandates for Secure Digital Banking in North America and EU
- 4.2.4 Growing 5G Roll-outs Driving Edge ADC Adoption in Asia
- 4.2.5 Rising Multi-Cloud and Hybrid IT Strategies among Global 2000
- 4.3 Market Restraints
- 4.3.1 Complex Layer-7 Policy Configuration Burdens IT Ops
- 4.3.2 Cost Inflation of Advanced ADC Licensing Models
- 4.3.3 Commoditization of Basic Load-Balancing Features
- 4.3.4 Shortage of Skilled NetOps and DevSecOps Talent
- 4.4 Technological Outlook
- 4.5 Porter's Five Forces Analysis
- 4.5.1 Bargaining Power of Suppliers
- 4.5.2 Bargaining Power of Buyers
- 4.5.3 Threat of New Entrants
- 4.5.4 Threat of Substitutes
- 4.5.5 Intensity of Competitive Rivalry
- 4.6 Assessment of Macroeconomic Factors Impact on the Industry
5 MARKET SIZE AND GROWTH FORECASTS (VALUE)
- 5.1 By Type
- 5.1.1 Hardware-Based ADC
- 5.1.2 Virtual/Software ADC
- 5.2 By Deployment
- 5.2.1 On-premise
- 5.2.2 Cloud-Managed/Hosted
- 5.3 By Component
- 5.3.1 Solutions (Control, Acceleration, Security)
- 5.3.2 Services (Integration, Managed, Training)
- 5.4 By Enterprise Size
- 5.4.1 Large Enterprises
- 5.4.2 Small and Medium Enterprises (SMEs)
- 5.5 By End-user Vertical
- 5.5.1 IT and Telecom
- 5.5.2 BFSI
- 5.5.3 Retail and E-commerce
- 5.5.4 Healthcare and Life Sciences
- 5.5.5 Government and Public Sector
- 5.5.6 Manufacturing and Industrial 4.0
- 5.5.7 Media and Entertainment
- 5.5.8 Energy and Utilities
- 5.6 By Geography
- 5.6.1 North America
- 5.6.1.1 United States
- 5.6.1.2 Canada
- 5.6.1.3 Mexico
- 5.6.2 South America
- 5.6.2.1 Brazil
- 5.6.2.2 Argentina
- 5.6.2.3 Chile
- 5.6.2.4 Peru
- 5.6.2.5 Rest of South America
- 5.6.3 Europe
- 5.6.3.1 Germany
- 5.6.3.2 United Kingdom
- 5.6.3.3 France
- 5.6.3.4 Italy
- 5.6.3.5 Spain
- 5.6.3.6 Rest of Europe
- 5.6.4 Asia-Pacific
- 5.6.4.1 China
- 5.6.4.2 Japan
- 5.6.4.3 South Korea
- 5.6.4.4 India
- 5.6.4.5 Australia
- 5.6.4.6 New Zealand
- 5.6.4.7 Rest of Asia-Pacific
- 5.6.5 Middle East and Africa
- 5.6.5.1 United Arab Emirates
- 5.6.5.2 Saudi Arabia
- 5.6.5.3 Turkey
- 5.6.5.4 South Africa
- 5.6.5.5 Rest of Middle East and Africa
- 5.6.1 North America
6 COMPETITIVE LANDSCAPE
- 6.1 Strategic Developments
- 6.2 Vendor Positioning Analysis
- 6.3 Company Profiles (includes Global level Overview, Market level overview, Core Segments, Financials as available, Strategic Information, Products and Services, and Recent Developments)
- 6.3.1 F5 Networks Inc.
- 6.3.2 NetScaler (Citrix Systems)
- 6.3.3 Fortinet Inc.
- 6.3.4 A10 Networks Inc.
- 6.3.5 Array Networks Inc.
- 6.3.6 Radware Ltd.
- 6.3.7 Akamai Technologies Inc.
- 6.3.8 Cisco Systems Inc.
- 6.3.9 Barracuda Networks Inc.
- 6.3.10 HAProxy Technologies LLC
- 6.3.11 Kemp Technologies (Progress Software)
- 6.3.12 Loadbalancer.org Inc.
- 6.3.13 Cloudflare Inc.
- 6.3.14 Dell Technologies Inc.
- 6.3.15 Amazon Web Services (ALB / NLB)
- 6.3.16 Microsoft Azure (Application Gateway)
- 6.3.17 Alibaba Cloud (Global Server Load Balancer)
- 6.3.18 Piolink Inc.
- 6.3.19 Sangfor Technologies Inc.
- 6.3.20 NGINX Inc. (F5)
7 MARKET OPPORTUNITIES AND FUTURE OUTLOOK
- 7.1 White-space and Unmet-Need Assessment
 全球应用交付控制器市场规模、份额、趋势和成长分析报告(2026-2034)
 全球先进电网负载管理市场:预测(至2034年)-按产品、负载类型、组件、技术、应用、最终用户和地区分類的分析
 应用程式交付控制器市场 - 全球产业规模、份额、趋势、机会和预测,按部署方式、企业规模、最终用户产业、地区和竞争格局划分。 2021-2031年预测全球先进负载平衡技术市场预测(至2032年):依产品类型、组件、材料、技术、应用、最终用户及地区划分
 日本应用交付控制器市场报告:按类型、组件、组织规模、行业垂直领域和地区划分(2026-2034 年)进阶负载平衡系统市场预测至 2032 年:全球分析(按组件、部署类型、组织规模、应用、最终用户和地区划分)
 应用交付控制器市场规模、份额和成长分析(按类型、服务、组织规模、最终用途和地区划分)—产业预测(2026-2033 年)函数即服务 (FaaS) 市场 - 2025-2030 年预测
 2025年全球医疗保健整合通讯即服务市场报告2025年自动提款机(ATM)即服务全球市场报告