


 |
市场调查报告书
商品编码
1850318
模拟软体:市场占有率分析、产业趋势、统计数据和成长预测(2025-2030 年)Simulation Software - Market Share Analysis, Industry Trends & Statistics, Growth Forecasts (2025 - 2030) |
||||||
※ 本网页内容可能与最新版本有所差异。详细情况请与我们联繫。
预计到 2025 年,模拟软体市场规模将达到 135.8 亿美元,到 2030 年将达到 262.6 亿美元,复合年增长率为 14.10%。
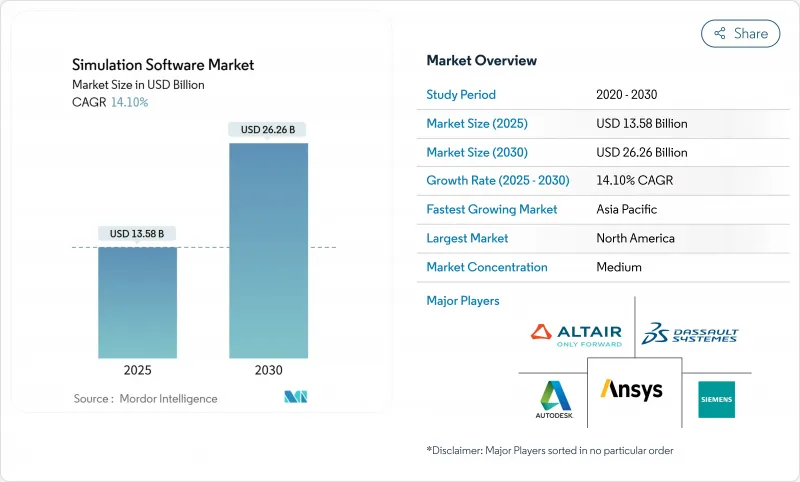
对人工智慧驱动的数位双胞胎的日益偏好、不断强化的永续性要求以及受监管行业对虚拟检验的推动,都在推动市场需求。企业越来越将高阶建模视为加速产品推出、提升产品品质的策略槓桿,而非只专注于成本削减。儘管云端的弹性降低了准入门槛,但在拥有高度敏感资料的行业,本地部署管理仍然至关重要。现有企业的收购活动表明,能够将基于物理的求解器与预测分析相结合的端到端平台正在引领市场潮流。虽然北美仍然占据主导地位,但亚太地区的快速工业化正在加速模拟软体市场的地理多元化。
全球模拟软体市场趋势与洞察
云端原生模拟技术的应用日益普及
弹性运算消除了硬体瓶颈,使分散式工程团队能够不受地理限制地进行协作。可预测的付费使用制与计划预算相匹配,而託管式高效能运算 (HPC) 服务则降低了内部 IT 开销。混合部署模式进一步加速了这一趋势,使企业能够在保留敏感工作负载的同时,利用云端突发进行大规模执行。这种转变正在推动授权模式转向订阅模式,并促使参与企业模拟软体市场。
汽车製造商要求进行虚拟检验
汽车製造商正在利用数位双胞胎重现数百万种驾驶场景,以用于高级驾驶辅助系统 (ADAS)。这种方法简化了对不断变化的安全法规的合规流程,并降低了实体原型的成本。基于经验数据的高保真模型弥合了虚拟测试和实体测试之间的差距,从而缩短了开发週期。随着电动车的日益普及,对能够在单一工作流程中处理热效应、电磁效应和结构效应的多物理场平台的需求也日益增长。
高效能运算的总拥有成本高
模型保真度的不断提升导致记忆体和加速器需求不断增长,令资本预算捉襟见肘。中小企业需要在拥有丛集的稳定性与云爆发的不确定性之间权衡取舍。专用硬体延长了更新周期,也使投资报酬率分析变得更加复杂。服务供应商正透过提供模拟即服务来填补这一空白,为客户分摊整个基础设施成本,并推动模拟软体市场的发展。
细分市场分析
2024年,本地部署仍将主导模拟软体市场,占据61%的市场。拥有成熟高效能运算丛集的公司重视确定性的成本结构和对敏感智慧财产权的直接监管。航太和国防工程团队仍然倾向于使用内部硬体来简化安全认证流程。然而,云端采用率将呈现16.40%的复合年增长率,吸引那些希望在不购买尖峰容量硬体的情况下扩展工作负载的采用者。
混合拓扑结构正在兴起,它将专有模型储存在本地,同时在高峰期将运算密集型运行任务传送到公有云。供应商透过统一的编配层来应对这一趋势,该编排层可在本地和云端资源之间调度作业,从而减少资源閒置并提高资源利用率。订阅定价模式使成本与预算週期保持一致,而自助服务入口网站则将配置时间从数週缩短至数分钟。频宽的提升使得对延迟敏感的模拟器和测试平台能够在异地进行耦合,从而将模拟软体的市场份额扩展到分散式团队。
2024年,汽车产业将以27%的市占率引领模拟软体市场,利用数位双胞胎检验自动驾驶功能和电动动力传动系统。日益严格的碰撞和排放法规正促使汽车製造商转向虚拟认证,从而减少原型车队并缩短专案週期。然而,医疗保健产业将成为成长最快的领域,到2030年复合年增长率将达到17.10%。
製药公司正在利用电脑模拟分子相互作用,以减少早期研发失败;医疗技术开发商则采用患者特异性模型来检验植入的兼容性和使用寿命。监管机构正积极采用虚拟队列来补充临床证据,从而缩短核准週期数月,并凸显模拟软体市场为生命科学创新者带来的规模效益。航太和国防领域正在大力投资用于下一代机身的多物理场求解器,而电子产业则正在加速推进用于5G天线阵列和晶片封装协同设计的电磁场建模。能源巨头正在采用地下模拟器来优化碳捕获井和氢气储存,以实现脱碳目标。
模拟软体市场按部署方式(本地部署、其他)、最终用户产业(汽车、IT、其他)、模拟产品类型(有限元素分析 (FEA)、其他)、应用领域(产品设计与工程、其他)、元件(软体授权、其他)和地区进行细分。市场预测以美元计价。
区域分析
北美地区预计2024年将维持38%的模拟软体市场份额,主要得益于其成熟的航太、国防和汽车产业生态系统。几十年前,联邦研究津贴催生了先进的求解器,如今,高科技云端服务供应商正在加速人工智慧主导能力的发展。订阅模式的广泛应用简化了预算并缩短了采购週期。然而,该地区仍然面临劳动力短缺的困境,这限制了专案规模的扩大,导致企业在安全法规允许的情况下将专业工作外包到海外。
在欧洲,强大的汽车工业基础和以永续性为导向的法规正在推动虚拟排放测试的普及。严格的碳排放政策鼓励虚拟排放测试,而电动车奖励则将资金投入电池和热模拟领域。诸如德国的「工业4.0平台」等工业4.0框架,促进了公共和私人试点项目的开展,这些项目展现了切实的投资回报率,从而刺激了模拟软体市场的需求。高阶多物理场模拟人才的短缺,促使国际院校更新课程设置,更重视以模型为基础的工程。
在製造业规模化发展和政府数位化蓝图的推动下,亚太地区到2030年将以14.80%的复合年增长率实现最快成长速度。中国正大力推动智慧城市试点项目,这些项目需要城市规模的能源和交通模型;而印度大力发展电子产业,推动了晶片封装模拟技术的发展。东南亚国家透过税收优惠政策吸引外资建置数位研发基础设施,促进了云端託管平台在当地的普及。智慧财产权保护仍是重要考量因素,因此跨国公司在进入模拟软体市场时,通常会先从智慧财产权敏感度较低的应用开始。本土厂商则专注于为中型企业提供高性价比的产品,进一步扩大了其在亚太地区的使用者群体。
其他福利:
- Excel格式的市场预测(ME)表
- 3个月的分析师支持
目录
第一章 引言
- 研究假设和市场定义
- 调查范围
第二章调查方法
第三章执行摘要
第四章 市场情势
- 市场概览
- 市场驱动因素
- 云端原生模拟技术的日益普及
- 汽车产业对虚拟检验的需求
- 快速采用数位双胞胎倡议
- AI驱动的生成式模拟工作流程
- ESG 强制性虚拟永续性评估
- 5G/ORAN网路功能虚拟化测试
- 市场限制
- 高效能运算的总拥有成本高
- 数据互通性和标准差距
- 云端外包中的IP安全问题
- 垂直模拟人才短缺
- 价值/供应链分析
- 监管格局
- 技术展望
- 波特五力分析
- 新进入者的威胁
- 买方的议价能力
- 供应商的议价能力
- 替代品的威胁
- 竞争对手之间的竞争
第五章 市场规模与成长预测
- 依部署类型
- 本地部署
- 云/SaaS
- 按最终用户产业
- 车
- 航太与国防
- 电机与电子工程
- 能源、石油和采矿
- 资讯科技和通讯
- 医疗保健和生命科学
- 教育与研究
- 其他的
- 按模拟类型
- 有限元素分析(FEA)
- 计算流体力学(CFD)
- 许多动态
- 离散事件与流程仿真
- 电磁波和射频
- 系统级和一维
- 按应用程式字段
- 产品设计与工程
- 研发/创新
- 流程和营运优化
- 培训、安全和数位模型
- 数位双胞胎生命週期管理
- 按组件
- 软体许可
- 服务和咨询
- 平台与集成
- 按地区
- 北美洲
- 美国
- 加拿大
- 墨西哥
- 南美洲
- 巴西
- 阿根廷
- 其他南美
- 欧洲
- 德国
- 英国
- 法国
- 义大利
- 俄罗斯
- 其他欧洲地区
- 亚太地区
- 中国
- 日本
- 印度
- 韩国
- ASEAN
- 其他亚太地区
- 中东和非洲
- GCC
- 土耳其
- 南非
- 其他中东和非洲地区
- 北美洲
第六章 竞争情势
- 市场集中度
- 策略趋势
- 市占率分析
- 公司简介
- Ansys Inc.
- Dassault Systmes SE
- Siemens Digital Industries Software
- Altair Engineering Inc.
- Autodesk Inc.
- Hexagon AB(MSC Software)
- MathWorks Inc.
- PTC Inc.
- Synopsys Inc.
- ESI Group SA
- CPFD Software LLC
- Rockwell Automation(ARENA)
- Bentley Systems Inc.
- Simio LLC
- Lanner Group Ltd
- SIMUL8 Corporation
- Flow Science Inc.
- COMSOL Inc.
- Schneider Electric(SE Electromechanical)
- SolidWorks Corporation
第七章 市场机会与未来展望
The simulation software market size is valued at USD 13.58 billion in 2025, and it is projected to reach USD 26.26 billion by 2030, advancing at a 14.10% CAGR.
Growing preference for AI-enhanced digital twins, tighter sustainability mandates, and the push for virtual validation across regulated industries combine to lift demand. Enterprises increasingly view advanced modeling as a strategic lever for faster product launches and quality gains rather than a narrow cost-reduction exercise. Cloud elasticity lowers entry barriers, while on-premise control remains vital for sectors that handle highly sensitive data. Acquisitive activity among incumbents shows that end-to-end platforms capable of blending physics-based solvers with predictive analytics now set the competitive pace. North American dominance persists, yet rapid industrialization in Asia-Pacific accelerates geographic diversification within the simulation software market.
Global Simulation Software Market Trends and Insights
Rising Cloud-Native Simulation Adoption
Elastic compute removes hardware bottlenecks and allows distributed engineering teams to collaborate without location constraints. Predictable pay-as-you-go pricing aligns with project budgets, and managed HPC services reduce internal IT overhead. Adoption accelerates further as hybrid deployments let firms keep sensitive workloads on-premise while exploiting cloud bursts for large runs. The shift broadens participation in the simulation software market and pressures license models to move toward subscriptions.
Automotive Demand for Virtual Validation
Automakers rely on digital twins to replicate millions of driving scenarios for advanced driver-assistance systems. The approach streamlines compliance with evolving safety rules and lowers physical prototype costs. High-fidelity models derived from proving-ground data narrow the gap between virtual and physical testing, cutting development cycles. Growing EV penetration intensifies the need for multiphysics platforms that address thermal, electromagnetic, and structural effects in a single workflow.
High Total Cost of Ownership for HPC
Continuous growth in model fidelity inflates memory and accelerator requirements, stretching capital budgets. Smaller enterprises weigh the predictability of owning clusters against the variability of cloud bursts. Specialized hardware lengthens refresh cycles and complicates ROI analyses. Service providers step in with simulation-as-a-service offers that amortize infrastructure across clients and keep adoption on track in the simulation software market
Other drivers and restraints analyzed in the detailed report include:
- Rapid Uptake of Digital-Twin Initiatives
- AI-Driven Generative Simulation Workflows
- Scarcity of Vertical-Domain Simulation Talent
For complete list of drivers and restraints, kindly check the Table Of Contents.
Segment Analysis
On-premise installations still dominate the simulation software market with a 61% share in 2024. Enterprises with established HPC clusters value deterministic cost structures and direct oversight of sensitive intellectual property. Engineering teams in aerospace and defense continue to favor in-house hardware to simplify security accreditation workflows. However, cloud deployments show an 16.40% CAGR and draw adopters looking to scale workloads without purchasing peak-capacity hardware.
Hybrid topologies emerge, storing proprietary models locally while sending compute-heavy runs to public clouds during spike periods. Vendors respond with unified orchestration layers that schedule jobs across on-premise and cloud resources, reducing idle capacity and improving utilization. Subscription pricing aligns expenses with budget cycles, and self-service portals shorten provisioning times from weeks to minutes. As bandwidth improves, latency-sensitive coupling of simulators and test benches can occur off-site, broadening the simulation software market footprint across dispersed teams.
Automotive led the simulation software market with a 27% share in 2024, using digital twins to validate autonomous features and electrified powertrains. Stringent crash and emissions norms drive vehicle makers toward virtual homologation, trimming prototype fleets, and compressing program timelines. Yet healthcare stands out as the fastest learner, poised for a 17.10% CAGR through 2030.
Pharmaceutical firms simulate molecular interactions in silico to cut early-stage failures, while med-tech developers employ patient-specific models to verify implant fit and longevity. Regulatory bodies now accept virtual cohorts to augment clinical evidence, shaving months from approval cycles and spotlighting the simulation software market size benefits for life-science innovators. Aerospace and defense keep steady investment in multi-physics solvers for next-generation airframes, whereas electronics groups intensify electromagnetic modeling for 5G antenna arrays and chip-package co-design. Energy majors adopt subsurface simulators to optimize carbon-capture wells and hydrogen storage, aligning with decarbonization targets.
Simulation Software Market is Segmented by Deployment (On-Premises, and More), End-User Industry (Automotive, IT and More), Simulation Type (Finite-Element Analysis (FEA) and More), Application Area (Product Design & Engineering and More), Component (Software Licenses and More) and by Geography. The Market Forecasts are Provided in Terms of Value (USD).
Geography Analysis
North America maintained 38% of simulation software market share in 2024 on the back of mature aerospace, defense, and automotive ecosystems. Federal research grants seeded advanced solvers decades ago, and the presence of big-tech cloud providers accelerates AI-driven functionality today. Broad adoption of subscription models streamlines budgets and shortens procurement cycles. The region still contends with tightening labor pools that limit scaling programs, causing firms to outsource specialized tasks offshore when security rules permit.
Europe leverages a strong automotive base and sustainability-focused regulations to stimulate adoption. Stringent carbon policies encourage virtual exhaust testing, and electric-vehicle incentives channel funds into battery and thermal simulations. Industry 4.0 frameworks such as Germany's Plattform Industrie 4.0 foster public-private pilots that demonstrate tangible ROI, nurturing demand within the simulation software market. Skills shortages emerge in high-end multiphysics roles, prompting cross-border academies to update curricula around model-based engineering.
Asia-Pacific posts the fastest 14.80% CAGR through 2030 thanks to manufacturing scale-up and government digitalization roadmaps. China sponsors smart-city pilots requiring urban-scale energy and traffic models, while India's electronics push drives chip-package simulations. Southeast Asian nations court foreign investment with tax breaks on digital R&D infrastructure, spurring local adoption of cloud-hosted platforms. Intellectual-property protection remains a consideration, so multinationals often start with non-sensitive workloads when entering the simulation software market. Domestic vendors emphasize cost-effective offerings tailored to medium enterprises, further expanding the regional user base.
- Ansys Inc.
- Dassault Systmes SE
- Siemens Digital Industries Software
- Altair Engineering Inc.
- Autodesk Inc.
- Hexagon AB (MSC Software)
- MathWorks Inc.
- PTC Inc.
- Synopsys Inc.
- ESI Group SA
- CPFD Software LLC
- Rockwell Automation (ARENA)
- Bentley Systems Inc.
- Simio LLC
- Lanner Group Ltd
- SIMUL8 Corporation
- Flow Science Inc.
- COMSOL Inc.
- Schneider Electric (SE Electromechanical)
- SolidWorks Corporation
Additional Benefits:
- The market estimate (ME) sheet in Excel format
- 3 months of analyst support
TABLE OF CONTENTS
1 INTRODUCTION
- 1.1 Study Assumptions and Market Definition
- 1.2 Scope of the Study
2 RESEARCH METHODOLOGY
3 EXECUTIVE SUMMARY
4 MARKET LANDSCAPE
- 4.1 Market Overview
- 4.2 Market Drivers
- 4.2.1 Rising cloud-native simulation adoption
- 4.2.2 Automotive demand for virtual validation
- 4.2.3 Rapid uptake of digital-twin initiatives
- 4.2.4 AI-driven generative simulation workflows
- 4.2.5 ESG-mandated virtual sustainability assessments
- 4.2.6 5G/ORAN network-function virtualization testing
- 4.3 Market Restraints
- 4.3.1 High total cost of ownership for HPC
- 4.3.2 Data-interoperability and standards gaps
- 4.3.3 IP-security concerns in cloud outsourcing
- 4.3.4 Scarcity of vertical-domain simulation talent
- 4.4 Value / Supply-Chain Analysis
- 4.5 Regulatory Landscape
- 4.6 Technological Outlook
- 4.7 Porters Five Forces Analysis
- 4.7.1 Threat of New Entrants
- 4.7.2 Bargaining Power of Buyers
- 4.7.3 Bargaining Power of Suppliers
- 4.7.4 Threat of Substitutes
- 4.7.5 Intensity of Competitive Rivalry
5 MARKET SIZE AND GROWTH FORECASTS (VALUE)
- 5.1 By Deployment Type
- 5.1.1 On-premise
- 5.1.2 Cloud / SaaS
- 5.2 By End-user Industry
- 5.2.1 Automotive
- 5.2.2 Aerospace and Defense
- 5.2.3 Electrical and Electronics
- 5.2.4 Energy, Oil and Mining
- 5.2.5 IT and Telecom
- 5.2.6 Healthcare and Life Sciences
- 5.2.7 Education and Research
- 5.2.8 Others
- 5.3 By Simulation Type
- 5.3.1 Finite-Element Analysis (FEA)
- 5.3.2 Computational Fluid Dynamics (CFD)
- 5.3.3 Multibody and Dynamics
- 5.3.4 Discrete-Event and Process Simulation
- 5.3.5 Electromagnetic and RF
- 5.3.6 System-level and 1-D
- 5.4 By Application Area
- 5.4.1 Product Design and Engineering
- 5.4.2 Research and Development / Innovation
- 5.4.3 Process and Operations Optimization
- 5.4.4 Training, Safety and Digital Mock-up
- 5.4.5 Digital Twin Lifecycle Management
- 5.5 By Component
- 5.5.1 Software Licenses
- 5.5.2 Services and Consulting
- 5.5.3 Platform and Integration
- 5.6 By Geography
- 5.6.1 North America
- 5.6.1.1 United States
- 5.6.1.2 Canada
- 5.6.1.3 Mexico
- 5.6.2 South America
- 5.6.2.1 Brazil
- 5.6.2.2 Argentina
- 5.6.2.3 Rest of South America
- 5.6.3 Europe
- 5.6.3.1 Germany
- 5.6.3.2 United Kingdom
- 5.6.3.3 France
- 5.6.3.4 Italy
- 5.6.3.5 Russia
- 5.6.3.6 Rest of Europe
- 5.6.4 APAC
- 5.6.4.1 China
- 5.6.4.2 Japan
- 5.6.4.3 India
- 5.6.4.4 South Korea
- 5.6.4.5 ASEAN
- 5.6.4.6 Rest of APAC
- 5.6.5 Middle East and Africa
- 5.6.5.1 GCC
- 5.6.5.2 Turkey
- 5.6.5.3 South Africa
- 5.6.5.4 Rest of Middle East and Africa
- 5.6.1 North America
6 COMPETITIVE LANDSCAPE
- 6.1 Market Concentration
- 6.2 Strategic Moves
- 6.3 Market Share Analysis
- 6.4 Company Profiles (Includes Global level Overview, Market level overview, Core Segments, Financials as available, Strategic Information, Market Rank/Share for key companies, Products & Services, and Recent Developments)
- 6.4.1 Ansys Inc.
- 6.4.2 Dassault Systmes SE
- 6.4.3 Siemens Digital Industries Software
- 6.4.4 Altair Engineering Inc.
- 6.4.5 Autodesk Inc.
- 6.4.6 Hexagon AB (MSC Software)
- 6.4.7 MathWorks Inc.
- 6.4.8 PTC Inc.
- 6.4.9 Synopsys Inc.
- 6.4.10 ESI Group SA
- 6.4.11 CPFD Software LLC
- 6.4.12 Rockwell Automation (ARENA)
- 6.4.13 Bentley Systems Inc.
- 6.4.14 Simio LLC
- 6.4.15 Lanner Group Ltd
- 6.4.16 SIMUL8 Corporation
- 6.4.17 Flow Science Inc.
- 6.4.18 COMSOL Inc.
- 6.4.19 Schneider Electric (SE Electromechanical)
- 6.4.20 SolidWorks Corporation
7 MARKET OPPORTUNITIES AND FUTURE OUTLOOK
- 7.1 White-space and Unmet-need Assessment
 模拟软体市场:按产品、技术、部署、应用和最终用户划分 - 全球预测(2025-2032 年)
 2025年模拟软体全球市场报告
 2025 年至 2033 年模拟软体市场规模、份额、趋势及预测(按组件、部署、最终用途及地区划分)工业 CAE模拟软体市场(按模拟类型、部署类型、公司规模、应用和最终用途行业)- 2025-2030 年全球预测离散事件模拟软体市场:按软体类型、产品类型、组织规模、部署类型、应用和垂直产业 - 全球预测 2025-2030
 全球运动模拟市场
 模拟软体的全球市场:各零件,软体类别,各部署模式,各终端用户产业,各地区,机会,预测,2018年~2032年
 模拟的全球市场:零组件·技术·用途·各地区 - 市场规模·产业动态·机会分析·预测 (2025~2033年)2025年工厂模拟软体全球市场报告模拟软体市场规模、份额、趋势分析报告:按组件、部署、应用、最终用途、地区、细分市场预测,2025-2030 年