


 |
市场调查报告书
商品编码
1850321
固态硬碟(SSD):市场占有率分析、产业趋势、统计数据和成长预测(2025-2030 年)Solid State Drive (SSD) - Market Share Analysis, Industry Trends & Statistics, Growth Forecasts (2025 - 2030) |
||||||
※ 本网页内容可能与最新版本有所差异。详细情况请与我们联繫。
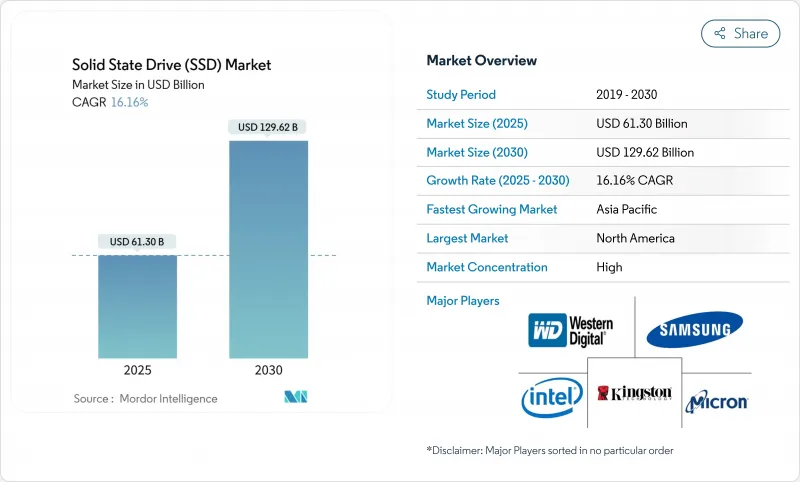
预计到 2025 年,固态硬碟市场规模将达到 613 亿美元,到 2030 年将达到 1,296.2 亿美元,年复合成长率为 16.16%。
企业级人工智慧训练丛集需求激增、超大规模资料中心创纪录的资本支出,以及机械储存介质向高性能固态阵列的持续转型,共同推动了这一发展势头。随着资料中心架构师将密度、效率和低延迟置于优先地位,那些能够将高层NAND快闪记忆体、先进的PCIe介面和精密的散热设计相结合的供应商将从中受益。目前,NAND快闪记忆体製造商正在调整晶圆生产週期和层间转换以维持利润率,因此价格仍处于波动状态,但强劲的需求讯号允许他们进行选择性涨价。同时,竞争也在加剧,中国供应商正在扩大国内市场份额,而现有供应商则在加速推出高容量QLC快闪记忆体产品和服务导向的韧体更新。
全球固态硬碟 (SSD) 市场趋势与洞察
资料中心快速采用 NVMe 和 PCIe Gen4-5
PCIe Gen4 和 Gen5 通道能够提供 AI 加速器和即时分析所需的频宽,促使企业架构师果断转向 NVMe。超大规模资料中心正在采用 EDSFF E1.S 机箱,每个 1U 机架最多可容纳 64 个硬碟,密度比传统的 U.2 阵列高出 10 倍,同时保持热插拔维护功能。 Meta、微软和其他云端营运商正在将这种新型外形规格作为标准,以简化丛集维护和散热。对 Corsair MP700 等消费级 Gen5 硬碟的测试表明,如果散热不当,它们会在三分钟内关闭,这凸显了伺服器底盘内气流的重要性。基于韧体的 PCIe 6.0 限速功能已进入原型阶段,这证实了只有主动管理散热预算,才能将更高的介面速度转换为应用程式效能。
云端超大规模资料中心建置推动了对固态硬碟 (SSD) 的需求。
这些超大规模云端计划与Petabyte硬碟(SSD)的竞标直接相关,因为人工智慧服务需要全快闪层来确保GPU的满载运作。一家东南亚银行透过迁移到全NVMe架构,在满足严格的RAID容错要求的同时,将资料库延迟降低了60%。这类案例研究进一步强化了全快闪架构的趋势,尤其是在整合能够减少机架数量并简化电源调度的情况下。
NAND供应链和价格波动
为了遏制价格持续下跌,生产商在2024年全年都减少了晶圆出货量,然后在2024年第三季有意将合约价格上调15-20%,以调整盈利。这种週期性波动给依赖可预测成本曲线的买家带来了预算不确定性。产业整合加剧了价格波动:SK海力士以19亿美元完成了对英特尔NAND资产的收购,将产能集中在少数决策者手中。同时,中国长江储存加速推进232层QLC的生产,即使在出口限制的情况下,也将其位密度提升至19.8 Gb/mm²。因此,供需关係的突然调整(无论是正向调整或反向调整)都可能扩大季度价格分布,并使长期总体拥有成本(TCO)规划变得更加复杂。
细分市场分析
M.2 凭藉其纤薄的外形,适用于客户端设备和入门级伺服器,在 2024 年占据了 SSD 市场 42.70% 的份额。然而,受云端服务供应商对免工具热插拔、可安装在高密度机架中并能有效散热的 SSD 托架的青睐,EDSFF E1.S 预计到 2030 年将以 16.9% 的复合年增长率增长。 U.2 主要应用于需要双埠 PCIe 的场景,例如优先考虑高可用性拓朴结构的金融交易中心。 E3.S 已在超大规模资料中心业者进行试点,以满足其对 PCIe 5.0 效能和 EDSFF 可维护性的需求。消费级主机板仍然依赖 M.2,因为它无需托架,从而降低了物料清单成本,但随着 QLC 快闪记忆体成本的下降,笔记型电脑 OEM 厂商已经开始尝试使用 CAMM 和焊接式 BGA 快闪记忆体。在预测期内,各公司将逐步扩大其采购政策,将 E1.S 纳入其中,并最终透过 Gen6 部署将 E3.S 纳入其中。
儘管到 2024 年企业工作负载将占 SSD 市场份额的 45.1%,但 AI 优化部署的成长速度将超过更广泛的企业存储,年增长率将达到 17.5%。金融分析、风险建模和生成式 AI 推理正推动储存架构师将快闪记忆体与加速器共存,使机架方案只需更少、更大容量的硬碟即可降低交叉开关延迟。随着 GPU 在各行业的普及,预计到 2030 年,AI 优化储存的 SSD 市占率将超过 30%。
客户端设备仍然是出货量最大的类别,但产品同质化正在限制利润空间。智慧型手机正在采用读取速度高达 4200 MB/s 的 UFS 4.0 NAND 快闪记忆体,而轻薄笔记型电脑则转向 4TB 模组,以满足内容创作者对 8K计划快取的需求。这些应用的工作环境温度范围为 -40 度C至 85 度C,并需要 15 万次的插拔循环,因此像 ATP Electronics 这样的厂商需要利用 pSLC 模式和 ECC 演算法来满足长期使用的要求。
固态硬碟以外形尺寸(2.5吋、M.2、其他)、应用领域(企业/资料中心、客户/消费设备、其他)、储存容量(小于1TB、1-2TB、其他)、终端用户产业(云端服务供应商、游戏和电竞、其他)以及地区进行细分。市场预测以美元计价。
区域分析
北美地区预计在2024年将占全球收入的26.7%,这主要得益于高密度超大规模资料中心园区以及金融和医疗保健产业对人工智慧的早期应用。北美固态硬碟市场预计到2030年将成长至314亿美元,但由于其庞大的装置量,其复合年增长率将落后于亚太地区,仅约15%。投资税收优惠和完善的託管生态系统正在推动新模组的部署,并平衡通路库存。该地区的企业高度重视资料主权,因此营运商在多个城市园区部署区域储存集群,以确保资料居住合规性。
亚太地区将以18.2%的复合年增长率成为成长最快的地区,这主要得益于中国、韩国和日本的晶圆厂,它们在出口限制收紧的情况下仍能确保本地供应。目前,全球十大固态硬碟品牌中有四个来自中国,这两家公司合计将在2024年双十一购物节期间占据23%的全球市场份额。阿里云和腾讯云等国内超大规模资料中心营运商正在将这些固态硬碟整合到白盒伺服器中,加速销售成长。政府为半导体投资提供的税收优惠政策进一步刺激了比特产量,而印度和印尼的区域性资料中心营运商正在开设新的资料中心区域,将国内运算和低延迟储存相结合。
随着欧洲将重点放在碳预算和循环经济目标上,营运商更倾向于选择具备耐久性分析、功率损耗保护和检验的回收途径的固态硬碟 (SSD) 产品线。由于能源上限和位置许可限制了超大规模待开发区的建设,市场成长依然稳健但速度放缓。目前,大部分出货量来自现有资料中心的维修,即在现有机房中用快闪记忆体替换棕地硬碟 (HDD)。中东地区,沙乌地阿拉伯和阿联酋的资料中心计划正在增加,而非洲仍处于早期应用阶段,电信应用的边缘快取是其首个应用案例。
其他福利:
- Excel格式的市场预测(ME)表
- 3个月的分析师支持
目录
第一章 引言
- 研究假设和市场定义
- 调查范围
第二章调查方法
第三章执行摘要
第四章 市场情势
- 市场概览
- 市场驱动因素
- 资料中心快速采用 NVMe 和 PCIe Gen4-5
- 云端超大规模资料中心业者中心建置推动了对固态硬碟 (SSD) 的需求。
- OEM整合到智慧型手机和平板电脑中
- 随着美元/GB价格下跌,NAND快闪记忆体的可寻址基数扩大
- AI/ML训练伺服器对高耐久性QLC和TLC的需求
- 边缘运算向可热插拔 E1.S/EDSFF 的过渡
- 市场限制
- 在冷资料储存领域,固态硬碟比机械硬碟更贵。
- NAND供应链及价格波动
- 就资料归檔而言,其写入寿命与硬碟相比是有限的。
- PCIe Gen5热感节流与电力消耗挑战
- 供应链分析
- 监管格局
- 技术展望
- 波特五力分析
- 供应商的议价能力
- 消费者议价能力
- 新进入者的威胁
- 替代品的威胁
- 竞争对手之间的竞争
- 评估市场中的宏观经济因素
第五章 市场规模与成长预测
- 按外形规格
- 2.5英寸
- M.2
- U.2
- 其他的
- 透过使用
- 企业/资料中心
- 客户端/消费设备
- 工业和汽车
- 其他(边缘运算、监控、物联网)
- 按储存容量
- 小于 1TB
- 1~2TB
- 其他的
- 按最终用户产业
- 云端服务供应商
- 游戏和电子竞技
- 金融服务
- 政府和国防部
- 其他的
- 按地区
- 北美洲
- 美国
- 加拿大
- 墨西哥
- 南美洲
- 巴西
- 阿根廷
- 哥伦比亚
- 欧洲
- 德国
- 英国
- 法国
- 义大利
- 西班牙
- 其他欧洲地区
- 亚太地区
- 中国
- 日本
- 韩国
- 印度
- 台湾
- 其他亚太地区
- 中东和非洲
- 中东
- 沙乌地阿拉伯
- 阿拉伯聯合大公国
- 土耳其
- 其他中东地区
- 非洲
- 南非
- 奈及利亚
- 埃及
- 其他非洲国家
- 北美洲
第六章 竞争情势
- 市场集中度
- 策略趋势
- 市占率分析
- 公司简介
- Samsung Electronics Co. Ltd.
- Western Digital Corporation
- SK hynix Inc.(incl. Solidigm)
- Micron Technology Inc.
- Kioxia Holdings Corporation
- Seagate Technology LLC
- Kingston Technology Corporation
- ADATA Technology Co. Ltd.
- Transcend Information Inc.
- Crucial(Micron Consumer)
- Silicon Motion Technology Corp.
- Marvell Technology Group
- Phison Electronics Corp.
- Corsair Memory Inc.
- Patriot Memory LLC
- Team Group Inc.
- PNY Technologies Inc.
- G.SKILL International Enterprise
- Intel Corporation
- Sabrent
第七章 市场机会与未来展望
The SSD market commands USD 61.30 billion in 2025 and is on course to touch USD 129.62 billion by 2030, advancing at a 16.16% CAGR.
Sharply rising demand for enterprise AI training clusters, record hyperscaler capital outlays, and an ongoing migration from mechanical media toward high-performance solid-state arrays underpin this momentum. Vendors that combine high-layer NAND, advanced PCIe interfaces, and sophisticated thermal designs are positioned to benefit as data-center architects prioritise density, efficiency, and low latency. Pricing remains fluid because NAND producers now calibrate wafer starts and layer transitions to preserve margins, yet healthy demand signals enable them to pass through selective increases. Competitive intensity also rises; Chinese suppliers gain domestic share, prompting incumbents to accelerate high-capacity QLC offerings and service-oriented firmware updates.
Global Solid State Drive (SSD) Market Trends and Insights
Rapid NVMe and PCIe Gen4-5 Penetration in Data Centers
Enterprise architects move decisively toward NVMe because PCIe Gen4 and Gen5 lanes supply the bandwidth that AI accelerators and real-time analytics now require. Hyperscalers adopt EDSFF E1.S enclosures that fit up to 64 drives per 1U, lifting density tenfold versus legacy U.2 arrays while maintaining hot-swap serviceability. Meta, Microsoft, and other cloud operators standardise on the newer form factor to simplify fleet service and cooling. Yet thermal loads escalate; tests on consumer Gen5 drives such as Corsair's MP700 show shutdown within three minutes when cooling is inadequate, highlighting the importance of server chassis airflow. Firmware-based throttling for PCIe 6.0 is already in prototype, confirming that interface speed gains will only translate to application performance when heat budgets are proactively managed.
Cloud-Hyperscaler Build-outs Boosting SSD Demand
These cloud hyperscale projects translate directly into petabyte-scale SSD tenders because AI services require all-flash tiers to keep GPUs saturated. Transactional proof points emerge in enterprise settings as well: a Southeast Asian bank cut database latency by 60% by shifting to an all-NVMe fabric, while still meeting stringent RAID tolerance.Such case studies reinforce a preference for flash-only architectures, especially where consolidation lowers rack count and eases power scheduling.
NAND Supply-Chain and Price Volatility
Producers curtailed wafer starts throughout 2024 to arrest a prolonged price slide, then deliberately raised contract pricing by 15-20% in Q3 2024 to realign profitability. The cycle injects budgeting uncertainty for buyers that depend on predictable cost curves. Industry consolidation exacerbates swings: SK Hynix closed its USD 1.9 billion acquisition of Intel's NAND assets, concentrating output under fewer decision makers. China's YMTC simultaneously accelerates 232-layer QLC, pushing bit density to 19.8 Gb/mm2 even under export controls. Sudden alignment or misalignment between supply and hyperscale demand can therefore widen quarterly price bands and complicate long-range TCO planning.
Other drivers and restraints analyzed in the detailed report include:
- AI/ML Training Servers' Need for High-Endurance QLC and TLC
- Thermal Throttling and Power-Draw Challenges in PCIe Gen5
For complete list of drivers and restraints, kindly check the Table Of Contents.
Segment Analysis
M.2 preserved 42.70% of SSD market share in 2024 because its slim profile aligns with client devices and entry-level servers. EDSFF E1.S, however, is on track for a 16.9% CAGR through 2030 as cloud providers favor tool-less hot-swap sleds that fit denser racks while managing thermals. U.2 lingers where dual-port PCIe is mandatory, chiefly in financial trading hubs that prize HA topologies. E3.S variants enter pilot at hyperscalers that want PCIe 5.0 performance with EDSFF serviceability. Consumer boards continue to rely on M.2 because its absence of a caddy keeps BOM costs down, yet laptop OEMs already test CAMM and soldered BGA flash as QLC cost curves sink. Over the forecast period, enterprises will progressively widen procurement policies to include E1.S and, eventually, E3.S for Gen6 deployments.
Enterprise workloads held 45.1% of the SSD market size in 2024, yet AI-tuned deployments are slated to out-run broader enterprise storage, advancing at 17.5% annually. Financial analytics, risk modelling, and generative AI inference push storage architects to co-locate flash with accelerators, so rack plans now require fewer, larger drives to reduce cross-bar latency. The SSD market share for AI-optimised storage is set to exceed 30% by 2030 as GPUs proliferate across verticals.
Client devices still ship the largest unit volumes, but commoditisation suppresses margin. Smartphones adopt UFS 4.0 NAND that posts 4,200 MB/s reads, and thin-and-light laptops jump to 4TB modules as creators demand 8K project caches. Industrial controls and autonomous robots make up a small but growing niche; these applications run in -40 °C to 85 °C envelopes and expect 150k P/E cycles, so vendors like ATP Electronics leverage pSLC modes and ECC algorithms to satisfy extended duty requirements.
Solid State Drive is Segmented by Form Factor (2. 5-Inch, M. 2, and More), Application (Enterprise/Data-Center, Client/Consumer Devices, and More), Storage Capacity (less Than 1 TB, 1 - 2 TB, and Others), End-User Industry (Cloud Service Providers, Gaming and Esports, and More), by Geography. The Market Forecasts are Provided in Terms of Value (USD).
Geography Analysis
North America controlled 26.7% of 2024 revenue, a position built on dense hyperscaler campuses and early AI adoption in financial and healthcare domains. The SSD market size for North America is forecast to grow to USD 31.4 billion by 2030, but its mid-teens CAGR lags Asia-Pacific because the installed base is already large. Investment tax incentives and an abundant colocation ecosystem sustain new module rollouts and keep channel inventory balanced. Enterprises in the region emphasise data-sovereignty; as a result, operators deploy zonal storage clusters across multiple metropolitan campuses to tighten data-residency compliance.
Asia-Pacific exhibits the fastest CAGR at 18.2% thanks to Chinese, South Korean, and Japanese fabs that secure local supply even when export controls tighten. Four of the ten largest SSD brands are now Chinese, and together they captured 23% global unit share during Singles' Day 2024 promotions. Domestic hyperscalers such as Alibaba Cloud and Tencent Cloud integrate those drives into white-box servers, accelerating volume ramp. Government programmes offering tax holidays for semiconductor investments further stimulate bit output, and regional colocation players in India and Indonesia open new zones that pair domestic compute with low-latency storage.
Europe concentrates on carbon budgeting and circular-economy targets, so operators favour SSD lines with endurance analytics, power-loss protection, and verified recycling paths. Market growth remains healthy but modest because energy caps and site permitting slow hyperscale green-field builds. Instead, brown-field retrofits that replace HDDs with flash in existing shells form the bulk of shipments. Middle East data-center projects in Saudi Arabia and UAE add incremental upside, whereas Africa stays early in the adoption curve, with edge caching for telco applications as the first use case.
- Samsung Electronics Co. Ltd.
- Western Digital Corporation
- SK hynix Inc. (incl. Solidigm)
- Micron Technology Inc.
- Kioxia Holdings Corporation
- Seagate Technology LLC
- Kingston Technology Corporation
- ADATA Technology Co. Ltd.
- Transcend Information Inc.
- Crucial (Micron Consumer)
- Silicon Motion Technology Corp.
- Marvell Technology Group
- Phison Electronics Corp.
- Corsair Memory Inc.
- Patriot Memory LLC
- Team Group Inc.
- PNY Technologies Inc.
- G.SKILL International Enterprise
- Intel Corporation
- Sabrent
Additional Benefits:
- The market estimate (ME) sheet in Excel format
- 3 months of analyst support
TABLE OF CONTENTS
1 INTRODUCTION
- 1.1 Study Assumptions and Market Definition
- 1.2 Scope of the Study
2 RESEARCH METHODOLOGY
3 EXECUTIVE SUMMARY
4 MARKET LANDSCAPE
- 4.1 Market Overview
- 4.2 Market Drivers
- 4.2.1 Rapid NVMe and PCIe Gen4-5 penetration in data centers
- 4.2.2 Cloud-hyperscaler build-outs boosting SSD demand
- 4.2.3 OEM Integration in Smartphones and Tablets
- 4.2.4 NAND USD/GB decline widening addressable base
- 4.2.5 AI/ML training servers' need for high-endurance QLC and TLC
- 4.2.6 Edge-computing shift to hot-swappable E1.S / EDSFF
- 4.3 Market Restraints
- 4.3.1 SSD price premium over HDD in cold-storage tiers
- 4.3.2 NAND supply-chain and price volatility
- 4.3.3 Limited write-endurance versus HDD for archival use
- 4.3.4 Thermal throttling and power-draw challenges in PCIe Gen5
- 4.4 Supply-Chain Analysis
- 4.5 Regulatory Landscape
- 4.6 Technological Outlook
- 4.7 Porter's Five Force Analysis
- 4.7.1 Bargaining Power of Suppliers
- 4.7.2 Bargaining Power of Consumers
- 4.7.3 Threat of New Entrants
- 4.7.4 Threat of Substitute Products
- 4.7.5 Intensity of Competitive Rivalry
- 4.8 Assesment of Macroeconomic Factors on the Market
5 MARKET SIZE AND GROWTH FORECASTS (VALUE)
- 5.1 By Form Factor
- 5.1.1 2.5-inch
- 5.1.2 M.2
- 5.1.3 U.2
- 5.1.4 Others
- 5.2 By Application
- 5.2.1 Enterprise / Data-Center
- 5.2.2 Client / Consumer Devices
- 5.2.3 Industrial and Automotive
- 5.2.4 Others (Edge, Surveillance, IoT)
- 5.3 By Storage Capacity
- 5.3.1 Less than 1 TB
- 5.3.2 1 - 2 TB
- 5.3.3 Others
- 5.4 By End-user Industry
- 5.4.1 Cloud Service Providers
- 5.4.2 Gaming and Esports
- 5.4.3 Financial Services
- 5.4.4 Government and Defense
- 5.4.5 Others
- 5.5 By Geography
- 5.5.1 North America
- 5.5.1.1 United States
- 5.5.1.2 Canada
- 5.5.1.3 Mexico
- 5.5.2 South America
- 5.5.2.1 Brazil
- 5.5.2.2 Argentina
- 5.5.2.3 Colombia
- 5.5.3 Europe
- 5.5.3.1 Germany
- 5.5.3.2 United Kingdom
- 5.5.3.3 France
- 5.5.3.4 Italy
- 5.5.3.5 Spain
- 5.5.3.6 Rest of Europe
- 5.5.4 Asia-Pacific
- 5.5.4.1 China
- 5.5.4.2 Japan
- 5.5.4.3 South Korea
- 5.5.4.4 India
- 5.5.4.5 Taiwan
- 5.5.4.6 Rest of Asia-Pacific
- 5.5.5 Middle East and Africa
- 5.5.5.1 Middle East
- 5.5.5.1.1 Saudi Arabia
- 5.5.5.1.2 United Arab Emirates
- 5.5.5.1.3 Turkey
- 5.5.5.1.4 Rest of Middle East
- 5.5.5.2 Africa
- 5.5.5.2.1 South Africa
- 5.5.5.2.2 Nigeria
- 5.5.5.2.3 Egypt
- 5.5.5.2.4 Rest of Africa
- 5.5.1 North America
6 COMPETITIVE LANDSCAPE
- 6.1 Market Concentration
- 6.2 Strategic Moves
- 6.3 Market Share Analysis
- 6.4 Company Profiles (includes Global level Overview, Market level overview, Core Segments, Financials as available, Strategic Information, Market Rank/Share for key companies, Products and Services, and Recent Developments)
- 6.4.1 Samsung Electronics Co. Ltd.
- 6.4.2 Western Digital Corporation
- 6.4.3 SK hynix Inc. (incl. Solidigm)
- 6.4.4 Micron Technology Inc.
- 6.4.5 Kioxia Holdings Corporation
- 6.4.6 Seagate Technology LLC
- 6.4.7 Kingston Technology Corporation
- 6.4.8 ADATA Technology Co. Ltd.
- 6.4.9 Transcend Information Inc.
- 6.4.10 Crucial (Micron Consumer)
- 6.4.11 Silicon Motion Technology Corp.
- 6.4.12 Marvell Technology Group
- 6.4.13 Phison Electronics Corp.
- 6.4.14 Corsair Memory Inc.
- 6.4.15 Patriot Memory LLC
- 6.4.16 Team Group Inc.
- 6.4.17 PNY Technologies Inc.
- 6.4.18 G.SKILL International Enterprise
- 6.4.19 Intel Corporation
- 6.4.20 Sabrent
7 MARKET OPPORTUNITIES AND FUTURE OUTLOOK
- 7.1 White-space and Unmet-need Assessment
 ZNS SSD全球市场报告2026
 固态硬碟 (SSD) 市场规模、份额和成长分析:按介面、外形规格、技术、储存容量和地区划分-2026-2033 年产业预测
 固态硬碟市场分析及预测(至2035年):依类型、产品、应用、技术、组件、外形、设备、最终用户、部署方式及功能划分
 全球固态硬碟市场:依储存类型、介面、技术、最终用户、国家及地区划分-产业分析、市场规模、份额及预测(2025-2032年)2026年全球固态硬碟市场报告
 全球固态硬碟(SSD)市场:市场规模、占有率、成长率、产业分析、依类型、应用和地区划分的分析及预测(2026-2034)
 AI 效能驱动企业级 SSD 在储存领域的主导地位 - 2026 年趋势
 近线SSD的崛起:硬碟缺口加速人工智慧资料中心的重塑固态硬碟市场:2025-2030 年预测
 全球客户端固态硬碟(SSD)市场