


 |
市场调查报告书
商品编码
1850370
感测器融合:市场份额分析、行业趋势、统计数据和成长预测(2025-2030 年)Sensor Fusion - Market Share Analysis, Industry Trends & Statistics, Growth Forecasts (2025 - 2030) |
||||||
※ 本网页内容可能与最新版本有所差异。详细情况请与我们联繫。
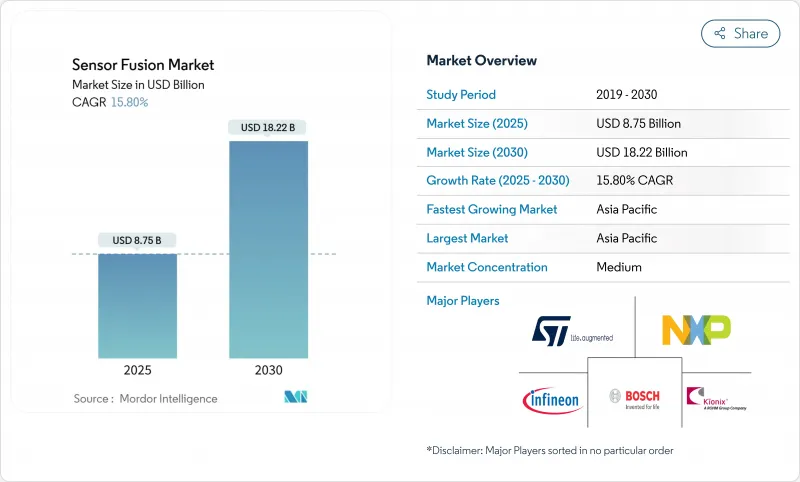
预计到 2025 年感测器融合市场规模将达到 87.5 亿美元,到 2030 年将达到 182.2 亿美元,年复合成长率为 15.8%。
成长的驱动力来自自动驾驶系统对可靠即时感知的需求、日益严格的安全法规以及固态雷射雷达等关键硬体成本的持续下降。亚太地区引领技术应用,主要得益于中国快速部署的自动驾驶汽车(AV)测试路线和工业自动化计划。欧洲以安全为先的政策以及美国车联网(V2X)基础设施的投资也进一步推动了这一趋势。虽然硬体仍然占据收益的大部分,但随着边缘人工智慧将运算从云端转移到终端,降低延迟和资料隐私风险,软体的价值份额正在不断增长。儘管雷达和摄影机融合目前仍占据主导地位,但包含光达的三感测器套件正在迅速扩张,重塑着竞争格局。
全球感测器融合市场趋势与洞察
Euro NCAP 的五星评级使得感测器融合成为强制性要求,加速了欧洲汽车製造商的采用。
欧洲新车安全评鑑协会 (Euro NCAP) 的 2025 年蓝图将多感测器感知提升为欧洲汽车製造商不可妥协的安全标准。乘用车平台必须协调摄影机、雷达以及最近加入的雷射雷达 (LiDAR) 系统,才能通过严格的行人侦测测试,包括白天和夜间测试。美国公路交通安全管理局 (NHTSA) 的政策协调加强了全球一致性,并使供应商能够分摊跨区域的研发成本。像 Aptiv 这样的顶级供应商正在积极回应,推出可透过 OTA 空中升级的 ADAS 系统,以降低延迟并提高在复杂城市环境中的物体侦测精度。监管的推动加速了软体创新,因为演算法升级无需重新设计硬体即可带来可衡量的安全改进。
固态雷射雷达成本的下降将使中国中阶车型能够配备多感测器套件。
汽车级固态雷射雷达的单价已较早商用水准下降约99.5%,使得三感测器融合系统在中国庞大的中型车市场成为可能。到2025年,国产配备光达的车辆数量将年增一倍,达到94辆。北京将于2025年4月推出的L3级自动驾驶框架将进一步刺激市场需求,使汽车製造商能够透过叫车和个人应用等项目收益。在中国雷射雷达销售排名中,本土供应商合赛科技和乐视科技落后于华为,加剧了激烈的价格竞争,加速了全球成本的压缩。
缺乏统一的融合架构标准阻碍了互通性。
由于缺乏通用资料格式和检验框架,原始设备製造商 (OEM) 和供应商不得不设计客製化的整合流程,这推高了整合成本并阻碍了组件的兼容性。美国国家标准与技术研究院 (NIST) 呼吁制定标准化的参考资料集和评估标准,以加快跨供应商的相容性。数据碎片化也使汽车认证变得复杂,因为在一个平台上收集的证据可能无法转移到另一个平台上,从而延迟了不同车型系列的功能发布。
细分市场分析
到2024年,硬体市场规模将达到57亿美元,占总支出的65%,凸显了摄影机、雷达、雷射雷达和惯性测量单元(IMU)在感知领域的关键作用。儘管随着汽车整合超过30种感测器,硬体市场持续成长,但价格下降正在限制收益成长。相较之下,软体市场到2030年将以18.9%的复合年增长率成长,因为空中下载(OTA)更新将开启新的售后收益阶段。
先进的融合演算法能够提升现有硬体的效能,无需进行实体改动即可实现利润丰厚的升级。 CEVA 的 FSP201 感测器中心 MCU 正是这一趋势的典范。这款低功耗晶片可融合惯性、音讯和环境数据,应用于无人机和穿戴式设备,充分展现了优化程式码将如何持续推动感测器融合市场在未来数年的发展。
到2024年,雷达摄影机系统将占据感测器融合市场38%的份额,其优势在于兼顾成本和应对恶劣天气条件的能力。大多数L2 ADAS系统都依赖这种组合来实现主动式车距维持定速系统和自动煞车。然而,受固态雷射雷达价格下降的推动,预计到2030年,三感测器平台相关的感测器融合市场规模将以22.5%的复合年增长率快速成长。
整合式雷射雷达可提高深度精度和冗余度,这对于L3及以上的自主运作至关重要。京瓷的相机和雷射雷达融合感测器将两种成像模式整合于单一机壳中,从而降低视差并简化校准要求。这种封装效率对于空间和散热预算紧张的成本敏感应用领域至关重要。
感测器融合市场按产品类型(硬体、软体)、融合方法(雷达+摄影机融合、雷射雷达+摄影机融合等)、演算法类型(卡尔曼滤波(EKF、UKF)、贝氏网路等)、应用、车辆类型和地区进行细分。市场预测以美元计价。
区域分析
亚太地区将占据感测器融合市场最大份额,到2024年市场规模将达33亿美元,复合年增长率达17.2%。中国50多个自动驾驶汽车测试区正在不断扩张,同时政府也加强了工业机器人的补助。日本和韩国在微型感测器领域拥有丰富的技术,这些技术已融入全球供应链。北美地区的感测器融合市场规模虽然落后,但得益于硅谷丰富的AI人才储备以及美国大力推进在高速公路沿线部署V2X无线技术(这是实现L4感知冗余的先决条件),北美市场正从中受益。
欧洲的发展方向受严格的安全和资料隐私法规驱动。该地区的顶级供应商利用精密工程技术满足欧洲新车安全评鑑协会(Euro NCAP)的多感测器要求,在功能安全指标方面始终领先于欧洲平台。在中东,国防现代化正在推动多感测器目标瞄准系统的发展。这些计划通常会产生军民两用智慧财产权,这些智慧财产权随后会应用于民用自动驾驶汽车。由于光达(LiDAR)应用有限且资料基础设施尚未成熟,非洲和南美洲的发展相对滞后,但一些智慧城市资金筹措正在试验将感测器融合技术应用于交通管理和公共无人机。
从北京的自动驾驶汽车法令到布鲁塞尔的人工智慧法,区域法律规范将决定感测器融合部署的速度和深度。习惯于跨洲认证流程的供应商正透过将认证工具链与其感知技术堆迭捆绑销售,从而将监管差异转化为业务收益。
其他福利:
- Excel格式的市场预测(ME)表
- 3个月的分析师支持
目录
第一章 引言
- 研究假设和市场定义
- 调查范围
第二章调查方法
第三章执行摘要
第四章 市场情势
- 市场概览
- 市场驱动因素
- 欧洲新车安全评鑑协会(Euro NCAP)强制要求采用感测器融合技术以获得五星评级,这将加速欧洲汽车製造商的采用。
- 固态雷射雷达成本的下降将使多感测器套件能够安装在中国的中檔车辆上。
- 边缘人工智慧晶片的进步使得行动装置和XR设备上的即时多模态融合成为可能。
- 将AMR机器人引入需要高精度和感测器融合的智慧工厂
- 国防现代化计画为中东地区的多感测器瞄准和导航系统提供资金
- 将V2X资料流整合到Fusion Stack中,以在美国实现L4级自动驾驶
- 市场限制
- 缺乏统一的Fusion架构标准阻碍了互通性。
- 高运算开销会增加非汽车物联网设备的物料清单成本。
- 新兴市场雷射雷达普及率有限,限制了多模态融合技术的应用。
- 云端辅助管道中的资料隐私和网路安全问题
- 价值/供应链分析
- 监管或技术前景
- 多感测器融合平台的技术演进蓝图
- 边缘人工智慧整合和SoC技术进步
- 波特五力分析
- 供应商的议价能力
- 买方/消费者的议价能力
- 新进入者的威胁
- 替代品的威胁
- 竞争对手之间的竞争
- 主要市场趋势
- 主要专利和研究活动
- 关键和新兴应用
- 主动车距控制巡航系统(ACC)
- 自动紧急煞车(AEB)
- 电子稳定控制系统(ESC)
- 前方碰撞警报(FCW)
- 其他新兴应用
- 投资情势
第五章 市场规模与成长预测
- 报价
- 硬体
- 软体
- 透过熔融法
- 雷达+摄影机融合
- 光达+相机融合
- 雷达+光达融合
- IMU+GPS融合
- 三感测器融合(摄影机+雷达+光达)
- 按演算法类型
- 卡尔曼滤波器(EKF、UKF)
- 贝氏网络
- 神经网路/深度学习
- GNSS/INS集成
- 透过使用
- ADAS(进阶驾驶辅助系统)
- ACC
- AEB
- ESC
- FCW
- 车道维持系统(LKA)
- 自动驾驶(3级至5级)
- 消费性电子产品(AR/VR、智慧型手机、穿戴式装置)
- 机器人和无人机
- 工业自动化和智慧製造
- 国防/航太
- ADAS(进阶驾驶辅助系统)
- 按车辆类型
- 搭乘用车
- 轻型商用车
- 大型商用车辆
- 其他自动驾驶车辆(穿梭巴士、AGV)
- 按地区
- 北美洲
- 美国
- 加拿大
- 墨西哥
- 加勒比海群岛
- 欧洲
- 德国
- 英国
- 法国
- 义大利
- 西班牙
- 其他欧洲地区
- 亚太地区
- 中国
- 日本
- 韩国
- 印度
- 其他亚太地区
- 南美洲
- 巴西
- 阿根廷
- 其他南美
- 中东
- 沙乌地阿拉伯
- 阿拉伯聯合大公国
- 以色列
- 土耳其
- 其他中东地区
- 非洲
- 南非
- 奈及利亚
- 埃及
- 其他非洲国家
- 北美洲
第六章 竞争情势
- 市场集中度
- 策略趋势
- 市占率分析
- 公司简介
- Robert Bosch GmbH
- Continental AG
- NXP Semiconductors NV
- STMicroelectronics NV
- Infineon Technologies AG
- Texas Instruments Inc.
- Nvidia Corporation
- Qualcomm Incorporated
- Analog Devices Inc.
- Mobileye Global Inc.
- Aptiv PLC
- Renesas Electronics Corporation
- Valeo SA
- ZF Friedrichshafen AG
- Arbe Robotics Ltd.
- BASELABS GmbH
- LeddarTech Inc.
- TDK Corporation
- Kionix Inc.(ROHM)
- Memsic Inc.
- CEVA Inc.
- AMD Xilinx
第七章 市场机会与未来展望
The sensor fusion market size is estimated at USD 8.75 billion in 2025 and is set to reach USD 18.22 billion by 2030, expanding at a 15.8% CAGR.
Growth rests on the need for reliable, real-time perception in autonomous systems, tighter safety regulations, and steady cost declines in key hardware such as solid-state LiDAR. Asia-Pacific leads adoption on the back of China's rapid rollout of autonomous vehicle (AV) testing routes and industrial automation projects. Europe's safety-first policies and the United States' V2X infrastructure investments provide additional momentum. Hardware still dominates revenue, yet software is capturing a rising share of value as edge AI shifts compute from the cloud to the endpoint, trimming latency and data-privacy risk. Radar-camera fusion is currently the workhorse configuration, but three-sensor suites that add LiDAR are scaling fastest and reshaping competitive positioning as component prices fall.
Global Sensor Fusion Market Trends and Insights
Mandate of Sensor Fusion for Euro NCAP 5-Star Ratings Accelerating European OEM Adoption
Euro NCAP's 2025 roadmap elevates multi-sensor perception to a non-negotiable safety baseline for European automakers. Passenger-car platforms must harmonize cameras, radar, and increasingly LiDAR to pass demanding pedestrian detection tests in both daylight and darkness. Converging policies by NHTSA in the United States reinforce global alignment, enabling suppliers to amortize development across regions. Tier-1s such as Aptiv respond with over-the-air-upgradable ADAS stacks that lower latency and sharpen object detection in cluttered urban scenes. The regulatory push accelerates software innovation because algorithm upgrades deliver measurable safety gains without re-engineering hardware.
Solid-State LiDAR Cost Decline Enabling Multi-Sensor Suites in Mid-Segment Cars across China
Unit prices for automotive-grade solid-state LiDAR have fallen roughly 99.5% from early commercial levels, making three-sensor fusion suites viable in China's sprawling mid-market segment. In 2025, 94 domestic vehicle models ship with LiDAR, double the prior year. Beijing's April 2025 L3 framework further catalyses demand, letting OEMs monetize higher autonomy through ride-hailing and personal-use programs. Local suppliers Hesai and RoboSense trail only Huawei in China's LiDAR revenue ranking, reinforcing a fiercely price-competitive environment that speeds global cost compression.
Lack of Uniform Fusion Architecture Standards Hindering Interoperability
Without common data formats and validation frameworks, OEMs and suppliers design bespoke fusion pipelines, elevating integration cost and hindering component interchangeability. NIST calls for standardized reference datasets and evaluation metrics to accelerate cross-vendor compatibility. Fragmentation also complicates automotive homologation because evidence collected on one platform may not transfer to another, slowing feature rollouts across model lines.
Other drivers and restraints analyzed in the detailed report include:
- Edge-AI Chip Advancements Allowing Real-Time Multi-Modal Fusion in Mobile and XR Devices
- Deployment of AMR Robots in Smart Factories Demanding High-Accuracy Sensor Fusion
- Data-Privacy and Cyber-Security Concerns Around Cloud-Aided Sensor Fusion Pipelines
For complete list of drivers and restraints, kindly check the Table Of Contents.
Segment Analysis
The sensor fusion market size for hardware stood at USD 5.7 billion in 2024, equal to 65% of total spending, underscoring the indispensable role of cameras, radar, LiDAR, and IMUs in perception. Hardware growth continues as vehicles exceed 30 discrete sensors, yet price erosion tempers revenue expansion. The software slice, by contrast, is scaling at an 18.9% CAGR to 2030 as OTA updates unlock new revenue stages post-sale, a shift already evident in Aptiv's Gen 6 ADAS rollouts.
Sophisticated fusion algorithms elevate installed hardware performance, yielding margin-rich upgrades without physical changes. CEVA's FSP201 sensor hub MCU illustrates the trend: a single low-power chip fuses inertial, audio, and environmental data for drones and wearables, signalling how optimized code will keep lifting the sensor fusion market for years to come.
Radar-camera systems controlled 38% of sensor fusion market share in 2024, balancing cost and robustness against poor weather. Most L2 ADAS stacks rely on this pairing for adaptive cruise control and automatic braking. The sensor fusion market size tied to three-sensor platforms is predicted to surge, however, on a 22.5% CAGR through 2030 as solid-state LiDAR prices tumble.
Integrating LiDAR enhances depth accuracy and redundancy, critical for L3 and above autonomy. Kyocera's camera-LiDAR fusion sensor collapses two modalities into one housing, reducing parallax while simplifying calibration demands. This packaging efficiency is vital for cost-sensitive segments where space and heat budgets are tight.
Sensor Fusion Market Sensor Fusion Market Segmented by Offering (Hardware, Software), Fusion Method (Radar + Camera Fusion, Lidar + Camera Fusion and More), Algorithm Type (Kalman Filter (EKF, UKF), Bayesian Networks and More), Application, Vehicle Type and Geography. The Market Forecasts are Provided in Terms of Value (USD).
Geography Analysis
Asia-Pacific controls the largest slice of the sensor fusion market, reaching USD 3.3 billion in 2024 and advancing on a 17.2% CAGR. China's 50-plus AV test zones, alongside national subsidies for industrial robotics, create scale. Japan and South Korea contribute miniaturized sensor know-how that feeds global supply chains. The sensor fusion market size in North America trails but benefits from Silicon Valley's deep AI talent pool and the U.S. push to embed V2X radios in highway corridors, a prerequisite for L4 perception redundancy.
Europe's direction is set by stringent safety and data-privacy rules. The region's Tier-1 suppliers leverage precision engineering to meet Euro NCAP's multi-sensor demands, keeping European platforms ahead on functional-safety metrics. Across the Middle East, defense modernization fuels multi-sensor targeting systems; these projects often birth dual-use IP that later migrates into civilian AVs. Africa and South America lag due to limited LiDAR penetration and less mature data infrastructure, but pockets of smart-city funding are piloting sensor fusion for traffic management and public-safety drones.
Collectively, regional regulatory frameworks, from Beijing's AV decree to Brussels' AI Act, dictate the pace and depth of sensor fusion rollouts. Suppliers accustomed to cross-continent homologation processes are turning regulatory variance into service revenue by offering certification toolchains bundled with their perception stacks.
- Robert Bosch GmbH
- Continental AG
- NXP Semiconductors N.V.
- STMicroelectronics N.V.
- Infineon Technologies AG
- Texas Instruments Inc.
- Nvidia Corporation
- Qualcomm Incorporated
- Analog Devices Inc.
- Mobileye Global Inc.
- Aptiv PLC
- Renesas Electronics Corporation
- Valeo S.A.
- ZF Friedrichshafen AG
- Arbe Robotics Ltd.
- BASELABS GmbH
- LeddarTech Inc.
- TDK Corporation
- Kionix Inc. (ROHM)
- Memsic Inc.
- CEVA Inc.
- AMD Xilinx
Additional Benefits:
- The market estimate (ME) sheet in Excel format
- 3 months of analyst support
TABLE OF CONTENTS
1 INTRODUCTION
- 1.1 Study Assumptions and Market Definition
- 1.2 Scope of the Study
2 RESEARCH METHODOLOGY
3 EXECUTIVE SUMMARY
4 MARKET LANDSCAPE
- 4.1 Market Overview
- 4.2 Market Drivers
- 4.2.1 Mandate of Sensor Fusion for Euro NCAP 5-Star Ratings Accelerating European OEM Adoption
- 4.2.2 Solid-State LiDAR Cost Decline Enabling Multi-Sensor Suites in Mid-Segment Cars across China
- 4.2.3 Edge-AI Chip Advancements Allowing Real-time Multi-Modal Fusion in Mobile and XR Devices
- 4.2.4 Deployment of AMR Robots in Smart Factories Demanding High-Accuracy Sensor Fusion
- 4.2.5 Defense Modernization Programs Funding Multi-Sensor Targeting and Navigation Systems in Middle East
- 4.2.6 Integration of V2X Data Streams into Fusion Stacks to Unlock L4 Autonomous Driving in the US
- 4.3 Market Restraints
- 4.3.1 Lack of Uniform Fusion Architecture Standards Hindering Interoperability
- 4.3.2 High Computational Overhead Raising BoM for Non-Automotive IoT Devices
- 4.3.3 Limited LiDAR Penetration in Emerging Markets Restricts Multi-Modal Fusion Adoption
- 4.3.4 Data-Privacy and Cyber-Security Concerns Around Cloud-Aided Sensor Fusion Pipelines
- 4.4 Value / Supply-Chain Analysis
- 4.5 Regulatory or Technological Outlook
- 4.5.1 Technology Evolution Roadmap for Multi-Sensor Fusion Platforms
- 4.5.2 Edge-AI Integration and SoC Advancements
- 4.6 Porter's Five Forces Analysis
- 4.6.1 Bargaining Power of Suppliers
- 4.6.2 Bargaining Power of Buyers/Consumers
- 4.6.3 Threat of New Entrants
- 4.6.4 Threat of Substitute Products
- 4.6.5 Intensity of Competitive Rivalry
- 4.7 Key Market Trends
- 4.7.1 Key Patents and Research Activities
- 4.7.2 Major and Emerging Applications
- 4.7.2.1 Adaptive Cruise Control (ACC)
- 4.7.2.2 Autonomous Emergency Braking (AEB)
- 4.7.2.3 Electronic Stability Control (ESC)
- 4.7.2.4 Forward Collision Warning (FCW)
- 4.7.2.5 Other Emerging Applications
- 4.8 Investment Landscape
5 MARKET SIZE AND GROWTH FORECASTS (VALUE)
- 5.1 By Offering
- 5.1.1 Hardware
- 5.1.2 Software
- 5.2 By Fusion Method
- 5.2.1 Radar + Camera Fusion
- 5.2.2 LiDAR + Camera Fusion
- 5.2.3 Radar + LiDAR Fusion
- 5.2.4 IMU + GPS Fusion
- 5.2.5 3-Sensor Fusion (Camera + Radar + LiDAR)
- 5.3 By Algorithm Type
- 5.3.1 Kalman Filter (EKF, UKF)
- 5.3.2 Bayesian Networks
- 5.3.3 Neural Network / Deep Learning
- 5.3.4 GNSS/INS Integration
- 5.4 By Application
- 5.4.1 Advanced Driver Assistance Systems (ADAS)
- 5.4.1.1 ACC
- 5.4.1.2 AEB
- 5.4.1.3 ESC
- 5.4.1.4 FCW
- 5.4.1.5 Lane-Keep Assist (LKA)
- 5.4.2 Autonomous Driving (Level 3-5)
- 5.4.3 Consumer Electronics (AR/VR, Smartphones, Wearables)
- 5.4.4 Robotics and Drones
- 5.4.5 Industrial Automation and Smart Manufacturing
- 5.4.6 Defense and Aerospace
- 5.4.1 Advanced Driver Assistance Systems (ADAS)
- 5.5 By Vehicle Type
- 5.5.1 Passenger Cars
- 5.5.2 Light Commercial Vehicles
- 5.5.3 Heavy Commercial Vehicles
- 5.5.4 Other Autonomous Vehicles (Shuttles, AGVs)
- 5.6 By Geography
- 5.6.1 North America
- 5.6.1.1 United States
- 5.6.1.2 Canada
- 5.6.1.3 Mexico
- 5.6.1.4 Caribbeans
- 5.6.2 Europe
- 5.6.2.1 Germany
- 5.6.2.2 United Kingdom
- 5.6.2.3 France
- 5.6.2.4 Italy
- 5.6.2.5 Spain
- 5.6.2.6 Rest of Europe
- 5.6.3 Asia-Pacific
- 5.6.3.1 China
- 5.6.3.2 Japan
- 5.6.3.3 South Korea
- 5.6.3.4 India
- 5.6.3.5 Rest of Asia-Pacific
- 5.6.4 South America
- 5.6.4.1 Brazil
- 5.6.4.2 Argentina
- 5.6.4.3 Rest of South America
- 5.6.5 Middle East
- 5.6.5.1 Saudi Arabia
- 5.6.5.2 United Arab Emirates
- 5.6.5.3 Israel
- 5.6.5.4 Turkey
- 5.6.5.5 Rest of Middle East
- 5.6.6 Africa
- 5.6.6.1 South Africa
- 5.6.6.2 Nigeria
- 5.6.6.3 Egypt
- 5.6.6.4 Rest of Africa
- 5.6.1 North America
6 COMPETITIVE LANDSCAPE
- 6.1 Market Concentration
- 6.2 Strategic Moves
- 6.3 Market Share Analysis
- 6.4 Company Profiles (includes Global level Overview, Market level overview, Core Segments, Financials as available, Strategic Information, Market Rank/Share for key companies, Products and Services, and Recent Developments)
- 6.4.1 Robert Bosch GmbH
- 6.4.2 Continental AG
- 6.4.3 NXP Semiconductors N.V.
- 6.4.4 STMicroelectronics N.V.
- 6.4.5 Infineon Technologies AG
- 6.4.6 Texas Instruments Inc.
- 6.4.7 Nvidia Corporation
- 6.4.8 Qualcomm Incorporated
- 6.4.9 Analog Devices Inc.
- 6.4.10 Mobileye Global Inc.
- 6.4.11 Aptiv PLC
- 6.4.12 Renesas Electronics Corporation
- 6.4.13 Valeo S.A.
- 6.4.14 ZF Friedrichshafen AG
- 6.4.15 Arbe Robotics Ltd.
- 6.4.16 BASELABS GmbH
- 6.4.17 LeddarTech Inc.
- 6.4.18 TDK Corporation
- 6.4.19 Kionix Inc. (ROHM)
- 6.4.20 Memsic Inc.
- 6.4.21 CEVA Inc.
- 6.4.22 AMD Xilinx
7 MARKET OPPORTUNITIES AND FUTURE OUTLOOK
- 7.1 White-Space and Unmet-Need Assessment
 感测器融合市场分析及预测(至2035年):依类型、产品类型、服务、技术、组件、应用、功能、部署类型及最终用户划分
 感测器融合市场-全球产业规模、份额、趋势、机会和预测,按类型(雷达感测器、惯性测量单元感测器、影像感测器及其他)、技术、最终用户、地区和竞争格局划分,2021-2031年预测
 感测器融合积体电路市场预测至2032年:按感测器类型、技术、应用、最终用户和地区分類的全球分析
 感测器融合市场规模、份额和成长分析(按技术、产品、最终用途和地区划分)—产业预测(2026-2033 年)
 感测器融合系统:全球市场份额和排名、总收入和需求预测(2025-2031年)
 感测器融合市场按应用、技术、组件、车辆类型和部署方式划分-2025-2032年全球预测
 人工智慧感测器融合套件市场 - 全球及区域分析:按应用、产品和国家 - 分析与预测(2025 年至 2035 年)
 2025 年至 2033 年感测器融合市场报告(按类型、技术、产业垂直和地区)
 自动驾驶汽车中的感测器融合 -市场占有率分析、行业趋势和统计、成长预测(2025-2030 年)
 汽车感测器融合市场,按感测器类型、自动化程度、应用、车辆类型、最终用户和地区 - 2024-2032 年行业分析、市场规模、市场份额和预测