


 |
市场调查报告书
商品编码
1850964
虚拟化软体:市场占有率分析、产业趋势、统计数据和成长预测(2025-2030 年)Virtualization Software - Market Share Analysis, Industry Trends & Statistics, Growth Forecasts (2025 - 2030) |
||||||
※ 本网页内容可能与最新版本有所差异。详细情况请与我们联繫。
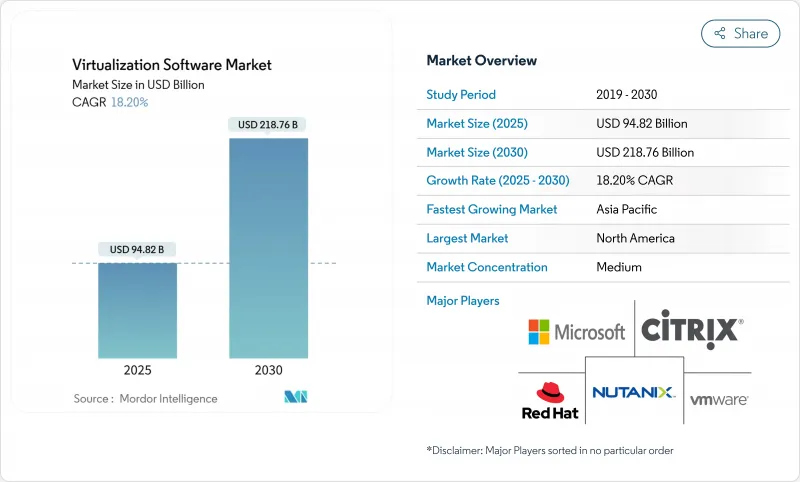
预计到 2025 年,虚拟化软体市场规模将达到 948.2 亿美元,到 2030 年将达到 2,187.6 亿美元,预测期(2025-2030 年)的复合年增长率为 18.20%。
向混合基础设施的果断转型、云端支出的成长以及人工智慧优化工作负载的激增,共同推动了市场前景的强劲发展。博通对 VMware 的整合导致授权费用上涨,供应商经济模式发生变化,促使企业实现供应商多元化,并加速开放原始码和云端原生虚拟机器管理程式的试用。边缘运算部署、产业合规性的提高以及混合办公模式的普及,正在拓展资料中心、分公司和行动终端等虚拟化应用场景。北美买家正在积极推进优化倡议,而亚太地区的企业则在扩大其在多重云端基础设施上的初始部署。日益增长的价格敏感性和不断变化的安全需求,正在推动自动化编配工具、人工智慧主导的资源分配以及基于订阅的交付模式的发展,这些因素共同支撑着虚拟化软体市场的长期成长。
全球虚拟化软体市场趋势与洞察
透过伺服器整合降低成本
伺服器整合仍然是推动财务成长的重要因素,因为虚拟机器使企业能够用利用率较低的节点替换成机架的单一用途硬体。政府关闭旧资料中心的专案报告称,整合率超过 10:1,从而降低了能源成本和更新预算。硬体成本的上涨以及对供应链前置作业时间的担忧进一步凸显了在采购新伺服器之前评估现有资产的重要性。金融机构也强调了较小的实体空间占用和更快的恢復速度所带来的好处。综上所述,这些因素使得降低成本成为虚拟化软体市场的核心要务。
云端优先型企业IT策略
如今,云端转型的核心是复杂的混合云和多重云端架构,虚拟化则是抽象层。微软的云端收入预计到2025年将年增20-22%,达到424亿美元,显示按需付费模式正在持续扩张。亚洲企业在这方面特别领先,92%的中国主管和91%的印度高层表示,他们的组织在云端运作工作负载。随着人工智慧工作负载的成熟,对能够快速、可预测地灵活调整计算池的虚拟机器管理程式的需求将持续增长。因此,订阅授权和API主导的自动化对于未来的虚拟化软体市场至关重要。
配置和生命週期管理的复杂性
混合架构增加了工具集和策略的范围,对于缺乏深厚虚拟化专业知识的团队而言,日常运作将面临挑战。政府机构指出,预算限制和文化变革是实现传统技术栈现代化的障碍。中小企业通常会将管理工作外包,从而引入新的依赖关係和合约成本。因此,在自动化技术更加成熟之前,不同云端平台、虚拟机器管理程式和安全基准之间的一致性将在一定程度上阻碍虚拟化软体市场的发展。
细分市场分析
儘管到2024年,PC和伺服器技术将占据虚拟化软体市场规模的67.4%,但成长势头正转向行动和终端应用场景,预计到2030年复合年增长率将达到22.1%。传统伺服器虚拟机器管理程式持续领先地位,反映了其庞大的企业级装置量。医疗保健系统和金融公司正在部署虚拟桌面来隔离敏感应用程序,确保符合HIPAA和PCI标准,同时实现广泛的员工存取。日本的Azure虚拟桌面部署展现了网路安全框架与终端虚拟化融合所带来的规模经济。
市场偏好正转向将零信任安全模型与人工智慧驱动的会话优化相结合的平台。整合用户行为分析和动态策略执行的供应商将在虚拟化软体市场中脱颖而出。企业也将设备无关客户端、低频宽转码器和简化的许可作为采购标准。预计在预测期内,端点虚拟化与身分识别服务和安全存取服务边际(SASE) 的整合将推动市场进一步成长。
至2024年,伺服器和运算工作负载将占虚拟化软体市场份额的46.6%,而网路和软体定义网路虚拟化预计到2030年将以21.2%的复合年增长率成长。部署5G专用网路和边缘工作负载的组织需要可编程的网路迭加层来支援对延迟敏感的应用。博通公司的VeloSky产品将光纤、蜂巢和卫星链路与虚拟化基础设施结合,清楚地展现了技术创新的方向。
亚太地区的企业正日益抛弃传统路由器,转而将软体定义广域网路 (SWAN) 纳入其多重云端策略。人工智慧驱动的流量控制与网路功能虚拟化的结合,透过减少手动配置的负担,加速了 SWAN 的普及。儘管储存和应用虚拟化对于传统系统的现代化改造仍然至关重要,但预算分配正逐渐转向网路层,以释放云端敏捷性。
虚拟化软体市场按平台(PC/伺服器虚拟化、行动/终端虚拟化)、虚拟化类别(应用程式虚拟化、网路/SD-网路虚拟化、其他)、部署模式(本地部署、云端/SaaS託管、混合部署)、组织规模(大型企业、中小企业)、最终用户垂直行业(IT和通讯地区进行细分。
区域分析
北美在虚拟化软体市场占据主导地位,预计到2024年将占据34.6%的收入份额,这反映了该地区早期采用虚拟化技术、拥有密集的超大规模云端服务供应商生态系统以及VMware的大规模部署。多项联邦政府指令正推动各机构将其90%的应用程式虚拟化,其中公共部门处于领先地位。儘管博通的定价策略促使人们评估微软Hyper-V和Nutanix AHV的替代方案,但随着企业将重点放在优化而非扩张上,市场成长正在放缓。
预计亚太地区将实现最大成长,到2030年复合年增长率将达到21.4%。中国正加大对国内云端技术的投资,以提高技术自主性;而印度政府的数位化和私部门的现代化倡议将推动虚拟化技术的广泛应用。 Virtuozzo已与AXLBIT签署分销协议,并计划在六个月内将五分之一的本地VMware用户迁移到Virtuozzo平台。在韩国和澳大利亚,与5G部署相关的边缘运算的推出,进一步推动了对可在空间受限环境中运行的轻量级虚拟机器管理程式的需求。
随着 GDPR 和新的资料主权立法使混合部署和本地部署更具吸引力,欧洲的云端市场稳步扩张。德国和英国已推出主权云端蓝图,以确保敏感资料集留在本国境内。已有 50 家 VMware 云端服务供应商合作伙伴提供基于 VMware Cloud Foundation 的主权云端服务。法国加强了政府对云端的强制规定,东欧市场正在探索国内替代方案以降低地缘政治风险。该地区缓慢但稳健的成长凸显了政策要求如何刺激虚拟基础设施支出。
儘管拉丁美洲和中东及非洲地区的收入贡献仍然较小,但行动优先的经济体为采用云端原生虚拟化技术以规避传统硬体的限制提供了新的机会。部署5G独立核心网路的通讯业者正在利用虚拟网路功能来缩短服务引进週期。同样,波湾合作理事会国家的公共部门数位包容计划也在投资基于虚拟化技术的私有云端平台,以符合资料居住法的要求。这些动态正在使虚拟化软体市场的地域收入来源更加多元化。
其他福利:
- Excel格式的市场预测(ME)表
- 3个月的分析师支持
目录
第一章 引言
- 研究假设和市场定义
- 调查范围
第二章调查方法
第三章执行摘要
第四章 市场情势
- 市场概览
- 市场驱动因素
- 透过伺服器整合降低成本
- 云端优先企业IT策略
- 远距办公和边缘运算的兴起
- 供应商多角化,来自 vSphere
- 人工智慧优化的工作负载分配
- 市场限制
- 部署和生命週期管理的复杂性
- 虚拟机器管理程式授权成本不断上涨
- 扩大虚拟机器特有的安全攻击面
- 产业价值链分析
- 监管环境
- 技术展望
- 产业吸引力-波特五力分析
- 新进入者的威胁
- 供应商的议价能力
- 买方的议价能力
- 替代品的威胁
- 竞争对手之间的竞争
- 影响市场的宏观经济因素
第五章 市场规模与成长预测
- 按平台
- PC/伺服器虚拟化
- 行动/终端虚拟化
- 按虚拟化类别
- 应用虚拟化
- 网路/SD网路虚拟化
- 伺服器/计算虚拟化
- 储存虚拟化
- 按部署模式
- 本地部署
- 云端/SaaS託管
- 杂交种
- 按组织规模
- 大公司
- 小型企业
- 按最终用户行业划分
- 资讯科技和通讯
- BFSI
- 医疗保健和生命科学
- 製造业
- 政府和国防部
- 媒体与娱乐
- 其他终端用户产业
- 按地区
- 北美洲
- 美国
- 加拿大
- 墨西哥
- 南美洲
- 巴西
- 阿根廷
- 智利
- 其他南美洲
- 欧洲
- 德国
- 英国
- 法国
- 义大利
- 西班牙
- 俄罗斯
- 其他欧洲地区
- 亚太地区
- 中国
- 印度
- 日本
- 韩国
- 新加坡
- 马来西亚
- 澳洲
- 亚太其他地区
- 中东和非洲
- 中东
- 阿拉伯聯合大公国
- 沙乌地阿拉伯
- 土耳其
- 其他中东地区
- 非洲
- 南非
- 奈及利亚
- 埃及
- 其他非洲地区
- 北美洲
第六章 竞争情势
- 市场集中度
- 策略趋势
- 市占率分析
- 公司简介
- VMware Inc.
- Microsoft Corporation
- Citrix Systems Inc.
- Red Hat Inc.(IBM Corporation)
- Nutanix Inc.
- Oracle Corp.
- Amazon Web Services Inc.
- Google LLC(Google Cloud)
- Huawei Technologies Co. Ltd.
- Parallels International GmbH
- NComputing Co. Ltd.
- Lynx Software Technologies
- TenAsys Corporation
- Proxmox Server Solutions GmbH
- SUSE LLC(Harvester)
- Virtuozzo International GmbH
- Xen Project
- KVM(Open-source)
- QEMU Project
- Scale Computing Inc.
- Dell Technologies Inc.
- Cisco Systems Inc.
- HPE(Hyperconverged SimpliVity)
- IBM PowerVM(IBM Corporation)
- TuxCare(KernelCare)
第七章 市场机会与未来趋势
- 閒置频段与未满足需求评估
The Virtualization Software Market size is estimated at USD 94.82 billion in 2025, and is expected to reach USD 218.76 billion by 2030, at a CAGR of 18.20% during the forecast period (2025-2030).
A decisive shift toward hybrid infrastructure, higher cloud spending, and the spread of AI-optimized workloads all contribute to the robust outlook. Broadcom's integration of VMware has altered vendor economics by widening license fees, prompting enterprises to diversify suppliers and accelerate trials of open-source or cloud-native hypervisors. Edge computing roll-outs, tighter industry compliance mandates, and a permanent hybrid-work culture are broadening virtualization use cases across datacenters, branch sites, and mobile endpoints. North American buyers are driving optimization initiatives, while Asia-Pacific organizations are scaling first-time deployments on multi-cloud foundations. Heightened price sensitivity and evolving security requirements are encouraging automated orchestration tools, AI-driven resource allocation, and subscription-based delivery models, elements that collectively underpin long-term growth in the virtualization software market.
Global Virtualization Software Market Trends and Insights
Cost-reduction from Server Consolidation
Server consolidation remains an enduring financial catalyst because virtual machines let enterprises replace racks of single-purpose hardware with fewer highly utilized nodes. Government programmes that closed older data centers report consolidation ratios above 10:1, lowering energy bills and refresh budgets. Heightened hardware costs and supply-chain lead-time concerns further elevate the importance of sweating existing assets before procuring new servers. Financial institutions cite smaller physical footprints and faster recovery objectives as added advantages. Collectively, these factors keep cost-saving imperatives central to the virtualization software market trajectory.
Cloud-first Enterprise IT Strategies
Cloud transformation now centers on sophisticated hybrid and multi-cloud blueprints that rest on virtualization as the abstraction layer. Microsoft's cloud revenue grew 20-22% year over year to USD 42.4 billion in 2025, evidence that consumption-based models continue to scale. Asian enterprises are especially progressive; 92% of Chinese and 91% of Indian executives say their organizations run workloads in the cloud. As AI workloads mature, demand rises for hypervisors that can flex compute pools quickly and predictively. Subscription licensing and API-driven automation are thus integral to the future virtualization software market.
Deployment and Lifecycle-management Complexity
Hybrid architectures multiply toolsets and policy domains, making day-two operations a challenge for teams that lack deep virtualization expertise. Government agencies cite budget limits and culture change as hurdles when modernizing entrenched legacy stacks. Smaller businesses often outsource management but encounter new dependencies and contractual overhead. Consistency across disparate clouds, hypervisors, and security baselines thus restrains a portion of the virtualization software market until automation matures further.
Other drivers and restraints analyzed in the detailed report include:
- Remote-work and Edge-compute Proliferation
- Vendor Diversification Away from vSphere
- Escalating Hypervisor Licence Costs
For complete list of drivers and restraints, kindly check the Table Of Contents.
Segment Analysis
In 2024, PC and server technology accounted for 67.4% of the virtualization software market size, yet growth momentum has shifted toward mobile and endpoint use cases, advancing at 22.1% CAGR to 2030. The enduring lead of traditional server hypervisors reflects deep enterprise install bases; however, hybrid work patterns now demand secure remote desktops accessed from unmanaged devices. Healthcare systems and financial firms deploy virtual desktops to segment sensitive applications, ensuring compliance with HIPAA and PCI while enabling broad workforce reach. Japan's Azure Virtual Desktop roll-out illustrates the scale possible when cybersecurity frameworks and endpoint virtualization converge.
Market preference is shifting toward platforms that combine zero-trust security models with AI-assisted session optimization. Vendors that integrate user-behaviour analytics and dynamic policy enforcement can differentiate in the virtualization software market. Enterprises also weigh device-agnostic clients, lower bandwidth codecs, and simplified licensing as purchase criteria. The convergence of endpoint virtualization with identity services and secure access service edge (SASE) offerings presents further growth levers over the forecast horizon.
Server and compute workloads represented 46.6% of the virtualization software market share in 2024, but network and software-defined networking virtualization is on track for a 21.2% CAGR to 2030. Organizations implementing 5G private networks and edge workloads require programmable network overlays that adjust to latency-sensitive applications. Broadcom's VeloSky product bundles fiber, cellular, and satellite links via virtualized infrastructure, underscoring where innovation is heading.
Enterprises in Asia-Pacific increasingly bypass legacy routers to adopt software-defined wide area networks within multi-cloud strategies. The intersection of AI-assisted traffic steering and network-function virtualization accelerates adoption because it reduces manual configuration burdens. Storage and application virtualization remain important for legacy modernization, yet budget allocation is shifting to network layers that unlock cloud agility.
Virtualization Software Market is Segmented by Platform (PC/Server Virtualisation and Mobile/Endpoint Virtualisation), Virtualisation Category (Application Virtualisation, Network/SD-Network Virtualisation, and More), Deployment Model (On-Premise, Cloud/SaaS-hosted, and Hybrid), Organization Size (Large Enterprises and Small and Medium Enterprises), End-User Industry (IT and Telecommunications, BFSI, and More), and Geography.
Geography Analysis
North America dominated the virtualization software market with 34.6% revenue share in 2024, reflecting early adoption, a dense ecosystem of hyperscale providers, and a large installed VMware base. Multiple federal consolidation mandates pushed agencies toward 90% application virtualization, showcasing public-sector leadership. Growth is moderating as enterprises focus on optimization over net-new expansion, though Broadcom's pricing strategy is triggering evaluations of Microsoft Hyper-V and Nutanix AHV alternatives.
Asia-Pacific is projected to add the most incremental dollars, rising at a 21.4% CAGR to 2030. China finances domestic cloud stacks to enhance technological self-reliance, while India's government digitization and private-sector modernization initiatives drive broad virtualization uptake. Japanese organizations lead vendor diversification; Virtuozzo's distribution pact with AXLBIT targets migrating one-fifth of local VMware users within six months. Edge computing deployments tied to 5G roll-outs in South Korea and Australia create additional demand for lightweight hypervisors capable of operating in space-constrained environments.
Europe records steady expansion because GDPR and emerging data-sovereignty legislation make hybrid and on-premise deployments attractive. Germany and the United Kingdom implement sovereign cloud blueprints that keep sensitive datasets within national borders. Fifty VMware Cloud Service Provider partners already deliver sovereign services leveraging VMware Cloud Foundation. France intensifies government cloud mandates, while Eastern European markets explore domestic alternatives to mitigate geopolitical risk. The region's moderate but resilient growth profile underscores how policy requirements can stimulate virtual infrastructure spending.
Latin America and the Middle East, and Africa remain smaller revenue contributors but present emerging opportunities where mobile-first economies adopt cloud-native virtualization to bypass legacy hardware constraints. Telcos rolling out 5G stand-alone cores rely on virtual network functions to shorten service-introduction cycles. Public-sector digital-inclusion projects across Gulf Cooperation Council states likewise invest in private-cloud platforms backed by virtualization to comply with data-residency laws. These dynamics collectively diversify geographic revenue streams inside the virtualization software market.
- VMware Inc.
- Microsoft Corporation
- Citrix Systems Inc.
- Red Hat Inc. (IBM Corporation)
- Nutanix Inc.
- Oracle Corp.
- Amazon Web Services Inc.
- Google LLC (Google Cloud)
- Huawei Technologies Co. Ltd.
- Parallels International GmbH
- NComputing Co. Ltd.
- Lynx Software Technologies
- TenAsys Corporation
- Proxmox Server Solutions GmbH
- SUSE LLC (Harvester)
- Virtuozzo International GmbH
- Xen Project
- KVM (Open-source)
- QEMU Project
- Scale Computing Inc.
- Dell Technologies Inc.
- Cisco Systems Inc.
- HPE (Hyperconverged SimpliVity)
- IBM PowerVM (IBM Corporation)
- TuxCare (KernelCare)
Additional Benefits:
- The market estimate (ME) sheet in Excel format
- 3 months of analyst support
TABLE OF CONTENTS
1 INTRODUCTION
- 1.1 Study Assumptions and Market Definition
- 1.2 Scope of the Study
2 RESEARCH METHODOLOGY
3 EXECUTIVE SUMMARY
4 MARKET LANDSCAPE
- 4.1 Market Overview
- 4.2 Market Drivers
- 4.2.1 Cost-reduction from server consolidation
- 4.2.2 Cloud-first enterprise IT strategies
- 4.2.3 Remote-work and edge-compute proliferation
- 4.2.4 Vendor-diversification away from vSphere
- 4.2.5 AI-optimised workload placement
- 4.3 Market Restraints
- 4.3.1 Deployment and lifecycle-management complexity
- 4.3.2 Escalating hypervisor licence costs
- 4.3.3 Rising VM-specific security attack-surface
- 4.4 Industry Value Chain Analysis
- 4.5 Regulatory Landscape
- 4.6 Technological Outlook
- 4.7 Industry Attractiveness - Porter's Five Forces Analysis
- 4.7.1 Threat of New Entrants
- 4.7.2 Bargaining Power of Suppliers
- 4.7.3 Bargaining Power of Buyers
- 4.7.4 Threat of Substitutes
- 4.7.5 Intensity of Competitive Rivalry
- 4.8 Impact of Macroeconomic Factors on the Market
5 MARKET SIZE AND GROWTH FORECASTS (VALUES)
- 5.1 By Platform
- 5.1.1 PC/Server Virtualisation
- 5.1.2 Mobile/Endpoint Virtualisation
- 5.2 By Virtualisation Category
- 5.2.1 Application Virtualisation
- 5.2.2 Network/SD-Network Virtualisation
- 5.2.3 Server/Compute Virtualisation
- 5.2.4 Storage Virtualisation
- 5.3 By Deployment Model
- 5.3.1 On-premise
- 5.3.2 Cloud/SaaS-hosted
- 5.3.3 Hybrid
- 5.4 By Organization Size
- 5.4.1 Large Enterprises
- 5.4.2 Small and Medium Enterprises (SMEs)
- 5.5 By End-user Industry
- 5.5.1 IT and Telecommunications
- 5.5.2 BFSI
- 5.5.3 Healthcare and Life Sciences
- 5.5.4 Manufacturing
- 5.5.5 Government and Defence
- 5.5.6 Media and Entertainment
- 5.5.7 Other End-user Industries
- 5.6 By Geography
- 5.6.1 North America
- 5.6.1.1 United States
- 5.6.1.2 Canada
- 5.6.1.3 Mexico
- 5.6.2 South America
- 5.6.2.1 Brazil
- 5.6.2.2 Argentina
- 5.6.2.3 Chile
- 5.6.2.4 Rest of South America
- 5.6.3 Europe
- 5.6.3.1 Germany
- 5.6.3.2 United Kingdom
- 5.6.3.3 France
- 5.6.3.4 Italy
- 5.6.3.5 Spain
- 5.6.3.6 Russia
- 5.6.3.7 Rest of Europe
- 5.6.4 Asia-Pacific
- 5.6.4.1 China
- 5.6.4.2 India
- 5.6.4.3 Japan
- 5.6.4.4 South Korea
- 5.6.4.5 Singapore
- 5.6.4.6 Malaysia
- 5.6.4.7 Australia
- 5.6.4.8 Rest of Asia-Pacific
- 5.6.5 Middle East and Africa
- 5.6.5.1 Middle East
- 5.6.5.1.1 United Arab Emirates
- 5.6.5.1.2 Saudi Arabia
- 5.6.5.1.3 Turkey
- 5.6.5.1.4 Rest of Middle East
- 5.6.5.2 Africa
- 5.6.5.2.1 South Africa
- 5.6.5.2.2 Nigeria
- 5.6.5.2.3 Egypt
- 5.6.5.2.4 Rest of Africa
- 5.6.1 North America
6 COMPETITIVE LANDSCAPE
- 6.1 Market Concentration
- 6.2 Strategic Moves
- 6.3 Market Share Analysis
- 6.4 Company Profiles (includes Global level Overview, Market level overview, Core Segments, Financials as available, Strategic Information, Market Rank/Share for key companies, Products and Services, and Recent Developments)
- 6.4.1 VMware Inc.
- 6.4.2 Microsoft Corporation
- 6.4.3 Citrix Systems Inc.
- 6.4.4 Red Hat Inc. (IBM Corporation)
- 6.4.5 Nutanix Inc.
- 6.4.6 Oracle Corp.
- 6.4.7 Amazon Web Services Inc.
- 6.4.8 Google LLC (Google Cloud)
- 6.4.9 Huawei Technologies Co. Ltd.
- 6.4.10 Parallels International GmbH
- 6.4.11 NComputing Co. Ltd.
- 6.4.12 Lynx Software Technologies
- 6.4.13 TenAsys Corporation
- 6.4.14 Proxmox Server Solutions GmbH
- 6.4.15 SUSE LLC (Harvester)
- 6.4.16 Virtuozzo International GmbH
- 6.4.17 Xen Project
- 6.4.18 KVM (Open-source)
- 6.4.19 QEMU Project
- 6.4.20 Scale Computing Inc.
- 6.4.21 Dell Technologies Inc.
- 6.4.22 Cisco Systems Inc.
- 6.4.23 HPE (Hyperconverged SimpliVity)
- 6.4.24 IBM PowerVM (IBM Corporation)
- 6.4.25 TuxCare (KernelCare)
7 MARKET OPPORTUNITIES AND FUTURE TRENDS
- 7.1 White-Space and Unmet-Need Assessment


